Cities with the Highest Male Poverty Level in Tennessee
RELATED REPORTS & OPTIONS
Highest Poverty | Male
Tennessee
Compare Cities
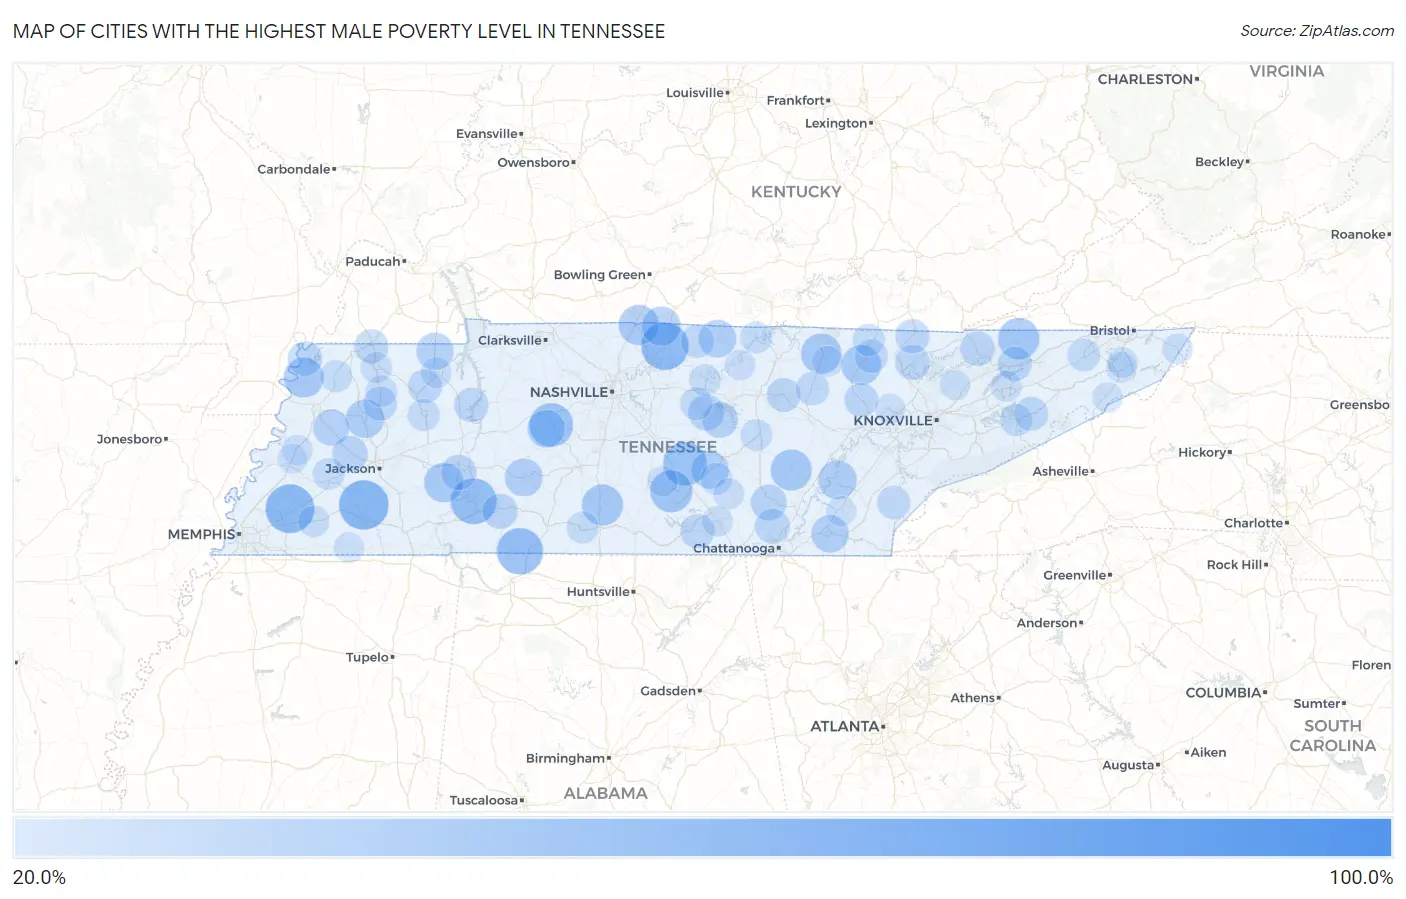
Map of Cities with the Highest Male Poverty Level in Tennessee
0.0%
100.0%
Cities with the Highest Male Poverty Level in Tennessee
| City | Male Poverty | vs State | vs National | |
| 1. | Coker Creek | 83.3% | 12.6%(+70.8)#1 | 11.3%(+72.0)#177 |
| 2. | Sequatchie | 73.6% | 12.6%(+61.0)#2 | 11.3%(+62.3)#261 |
| 3. | Nixon | 67.9% | 12.6%(+55.3)#3 | 11.3%(+56.5)#343 |
| 4. | Dukedom | 55.0% | 12.6%(+42.4)#4 | 11.3%(+43.7)#664 |
| 5. | Toone | 53.8% | 12.6%(+41.3)#5 | 11.3%(+42.5)#703 |
| 6. | Gallaway | 52.8% | 12.6%(+40.2)#6 | 11.3%(+41.5)#741 |
| 7. | Bethpage | 50.5% | 12.6%(+37.9)#7 | 11.3%(+39.2)#844 |
| 8. | Iron City | 48.6% | 12.6%(+36.0)#8 | 11.3%(+37.3)#946 |
| 9. | Clifton | 48.0% | 12.6%(+35.5)#9 | 11.3%(+36.7)#974 |
| 10. | Lakewood Park | 44.6% | 12.6%(+32.0)#10 | 11.3%(+33.2)#1,183 |
| 11. | Bon Aqua Junction | 44.5% | 12.6%(+32.0)#11 | 11.3%(+33.2)#1,185 |
| 12. | Normandy | 42.1% | 12.6%(+29.5)#12 | 11.3%(+30.8)#1,367 |
| 13. | Sneedville | 40.7% | 12.6%(+28.1)#13 | 11.3%(+29.3)#1,522 |
| 14. | Rocky Top | 40.3% | 12.6%(+27.7)#14 | 11.3%(+29.0)#1,546 |
| 15. | Dellrose | 40.3% | 12.6%(+27.7)#15 | 11.3%(+29.0)#1,549 |
| 16. | Pikeville | 40.2% | 12.6%(+27.7)#16 | 11.3%(+28.9)#1,553 |
| 17. | Cornersville | 40.2% | 12.6%(+27.6)#17 | 11.3%(+28.8)#1,559 |
| 18. | Morris Chapel | 40.0% | 12.6%(+27.4)#18 | 11.3%(+28.7)#1,569 |
| 19. | Jamestown | 39.1% | 12.6%(+26.5)#19 | 11.3%(+27.8)#1,659 |
| 20. | Mitchellville | 38.6% | 12.6%(+26.0)#20 | 11.3%(+27.2)#1,732 |
| 21. | Ridgely | 38.5% | 12.6%(+25.9)#21 | 11.3%(+27.1)#1,740 |
| 22. | Robbins | 38.2% | 12.6%(+25.7)#22 | 11.3%(+26.9)#1,763 |
| 23. | Scotts Hill | 37.5% | 12.6%(+24.9)#23 | 11.3%(+26.1)#1,853 |
| 24. | Fairfield | 36.9% | 12.6%(+24.3)#24 | 11.3%(+25.6)#1,918 |
| 25. | Greenvale | 36.6% | 12.6%(+24.0)#25 | 11.3%(+25.2)#1,953 |
| 26. | Decatur | 36.0% | 12.6%(+23.4)#26 | 11.3%(+24.7)#2,027 |
| 27. | Trenton | 35.9% | 12.6%(+23.3)#27 | 11.3%(+24.6)#2,037 |
| 28. | Walnut Grove Cdp Hardin County | 35.7% | 12.6%(+23.1)#28 | 11.3%(+24.3)#2,067 |
| 29. | Hohenwald | 34.8% | 12.6%(+22.2)#29 | 11.3%(+23.4)#2,177 |
| 30. | Morrison | 34.5% | 12.6%(+21.9)#30 | 11.3%(+23.2)#2,218 |
| 31. | East Cleveland | 34.4% | 12.6%(+21.9)#31 | 11.3%(+23.1)#2,233 |
| 32. | Wrigley | 34.4% | 12.6%(+21.8)#32 | 11.3%(+23.1)#2,238 |
| 33. | Red Boiling Springs | 34.4% | 12.6%(+21.8)#33 | 11.3%(+23.0)#2,239 |
| 34. | Puryear | 33.8% | 12.6%(+21.2)#34 | 11.3%(+22.4)#2,311 |
| 35. | John Sevier | 33.1% | 12.6%(+20.5)#35 | 11.3%(+21.8)#2,422 |
| 36. | Oak Grove Cdp Sumner County | 32.8% | 12.6%(+20.3)#36 | 11.3%(+21.5)#2,473 |
| 37. | Friendship | 32.3% | 12.6%(+19.7)#37 | 11.3%(+21.0)#2,545 |
| 38. | Dowelltown | 32.1% | 12.6%(+19.5)#38 | 11.3%(+20.8)#2,585 |
| 39. | Randolph | 31.8% | 12.6%(+19.2)#39 | 11.3%(+20.5)#2,638 |
| 40. | Dunlap | 31.8% | 12.6%(+19.2)#40 | 11.3%(+20.5)#2,646 |
| 41. | Smithville | 31.4% | 12.6%(+18.8)#41 | 11.3%(+20.0)#2,717 |
| 42. | Bells | 31.3% | 12.6%(+18.7)#42 | 11.3%(+19.9)#2,727 |
| 43. | Decaturville | 31.1% | 12.6%(+18.5)#43 | 11.3%(+19.8)#2,767 |
| 44. | Waynesboro | 30.7% | 12.6%(+18.1)#44 | 11.3%(+19.3)#2,845 |
| 45. | Lone Oak | 30.3% | 12.6%(+17.7)#45 | 11.3%(+18.9)#2,923 |
| 46. | La Follette | 30.1% | 12.6%(+17.5)#46 | 11.3%(+18.8)#2,958 |
| 47. | Tazewell | 29.8% | 12.6%(+17.2)#47 | 11.3%(+18.5)#3,023 |
| 48. | Valley Forge | 29.6% | 12.6%(+17.0)#48 | 11.3%(+18.2)#3,068 |
| 49. | Farner | 29.5% | 12.6%(+16.9)#49 | 11.3%(+18.2)#3,086 |
| 50. | Tiptonville | 29.5% | 12.6%(+16.9)#50 | 11.3%(+18.1)#3,091 |
| 51. | Cowan | 29.5% | 12.6%(+16.9)#51 | 11.3%(+18.1)#3,093 |
| 52. | Jellico | 29.3% | 12.6%(+16.7)#52 | 11.3%(+18.0)#3,132 |
| 53. | Mooresburg | 29.3% | 12.6%(+16.7)#53 | 11.3%(+17.9)#3,139 |
| 54. | Eva | 29.3% | 12.6%(+16.7)#54 | 11.3%(+17.9)#3,146 |
| 55. | Henry | 28.7% | 12.6%(+16.2)#55 | 11.3%(+17.4)#3,257 |
| 56. | South Fulton | 28.7% | 12.6%(+16.1)#56 | 11.3%(+17.4)#3,268 |
| 57. | Wartburg | 28.7% | 12.6%(+16.1)#57 | 11.3%(+17.4)#3,269 |
| 58. | Bradford | 28.7% | 12.6%(+16.1)#58 | 11.3%(+17.3)#3,283 |
| 59. | Monterey | 28.6% | 12.6%(+16.0)#59 | 11.3%(+17.3)#3,294 |
| 60. | Parrottsville | 28.6% | 12.6%(+16.0)#60 | 11.3%(+17.2)#3,305 |
| 61. | Tellico Plains | 28.1% | 12.6%(+15.5)#61 | 11.3%(+16.7)#3,428 |
| 62. | Lafayette | 27.8% | 12.6%(+15.3)#62 | 11.3%(+16.5)#3,476 |
| 63. | Clarkrange | 27.7% | 12.6%(+15.2)#63 | 11.3%(+16.4)#3,508 |
| 64. | Huntsville | 27.7% | 12.6%(+15.1)#64 | 11.3%(+16.3)#3,525 |
| 65. | Fall Branch | 27.0% | 12.6%(+14.4)#65 | 11.3%(+15.6)#3,715 |
| 66. | Bon Air | 26.9% | 12.6%(+14.3)#66 | 11.3%(+15.5)#3,743 |
| 67. | Briceville | 26.8% | 12.6%(+14.2)#67 | 11.3%(+15.5)#3,755 |
| 68. | Wildersville | 26.8% | 12.6%(+14.2)#68 | 11.3%(+15.4)#3,771 |
| 69. | Alexandria | 26.5% | 12.6%(+14.0)#69 | 11.3%(+15.2)#3,823 |
| 70. | Newport | 26.5% | 12.6%(+14.0)#70 | 11.3%(+15.2)#3,824 |
| 71. | Yuma | 26.2% | 12.6%(+13.7)#71 | 11.3%(+14.9)#3,920 |
| 72. | Oneida | 26.1% | 12.6%(+13.5)#72 | 11.3%(+14.8)#3,965 |
| 73. | Huntingdon | 26.1% | 12.6%(+13.5)#73 | 11.3%(+14.7)#3,981 |
| 74. | Pulaski | 25.9% | 12.6%(+13.3)#74 | 11.3%(+14.6)#4,027 |
| 75. | Viola | 25.5% | 12.6%(+13.0)#75 | 11.3%(+14.2)#4,136 |
| 76. | Brownsville | 25.5% | 12.6%(+12.9)#76 | 11.3%(+14.2)#4,142 |
| 77. | Doyle | 25.5% | 12.6%(+12.9)#77 | 11.3%(+14.2)#4,143 |
| 78. | Obion | 25.5% | 12.6%(+12.9)#78 | 11.3%(+14.1)#4,151 |
| 79. | Celina | 25.3% | 12.6%(+12.7)#79 | 11.3%(+13.9)#4,227 |
| 80. | South Carthage | 25.2% | 12.6%(+12.7)#80 | 11.3%(+13.9)#4,233 |
| 81. | Greenfield | 24.9% | 12.6%(+12.3)#81 | 11.3%(+13.5)#4,385 |
| 82. | Somerville | 24.7% | 12.6%(+12.1)#82 | 11.3%(+13.3)#4,460 |
| 83. | Martin | 24.3% | 12.6%(+11.8)#83 | 11.3%(+13.0)#4,564 |
| 84. | Morristown | 24.0% | 12.6%(+11.5)#84 | 11.3%(+12.7)#4,686 |
| 85. | Altamont | 23.8% | 12.6%(+11.2)#85 | 11.3%(+12.5)#4,783 |
| 86. | Paris | 23.8% | 12.6%(+11.2)#86 | 11.3%(+12.4)#4,784 |
| 87. | Allardt | 23.7% | 12.6%(+11.1)#87 | 11.3%(+12.3)#4,816 |
| 88. | Mountain City | 23.5% | 12.6%(+10.9)#88 | 11.3%(+12.1)#4,895 |
| 89. | Ripley | 23.5% | 12.6%(+10.9)#89 | 11.3%(+12.1)#4,896 |
| 90. | Wartrace | 23.4% | 12.6%(+10.8)#90 | 11.3%(+12.1)#4,933 |
| 91. | Central | 23.4% | 12.6%(+10.8)#91 | 11.3%(+12.0)#4,942 |
| 92. | Monteagle | 23.3% | 12.6%(+10.8)#92 | 11.3%(+12.0)#4,964 |
| 93. | Gainesboro | 23.3% | 12.6%(+10.7)#93 | 11.3%(+11.9)#4,993 |
| 94. | Saulsbury | 23.1% | 12.6%(+10.5)#94 | 11.3%(+11.7)#5,046 |
| 95. | Watauga | 23.0% | 12.6%(+10.4)#95 | 11.3%(+11.6)#5,084 |
| 96. | Luttrell | 22.9% | 12.6%(+10.4)#96 | 11.3%(+11.6)#5,102 |
| 97. | Banner Hill | 22.9% | 12.6%(+10.3)#97 | 11.3%(+11.6)#5,110 |
| 98. | Henning | 22.9% | 12.6%(+10.3)#98 | 11.3%(+11.5)#5,146 |
| 99. | Calhoun | 22.8% | 12.6%(+10.2)#99 | 11.3%(+11.4)#5,181 |
| 100. | Oliver Springs | 22.7% | 12.6%(+10.1)#100 | 11.3%(+11.4)#5,222 |
Common Questions
What are the Top 10 Cities with the Highest Male Poverty Level in Tennessee?
Top 10 Cities with the Highest Male Poverty Level in Tennessee are:
#1
53.8%
#2
52.8%
#3
50.5%
#4
48.6%
#5
48.0%
#6
44.6%
#7
44.5%
#8
42.1%
#9
40.7%
#10
40.2%
What city has the Highest Male Poverty Level in Tennessee?
Toone has the Highest Male Poverty Level in Tennessee with 53.8%.
What is the Poverty Level Among Males in the State of Tennessee?
Poverty Level Among Males in Tennessee is 12.6%.
What is the Poverty Level Among Males in the United States?
Poverty Level Among Males in the United States is 11.3%.