Cities with the Highest Male Poverty Level in Michigan
RELATED REPORTS & OPTIONS
Highest Poverty | Male
Michigan
Compare Cities
Map of Cities with the Highest Male Poverty Level in Michigan
0.0%
60.0%
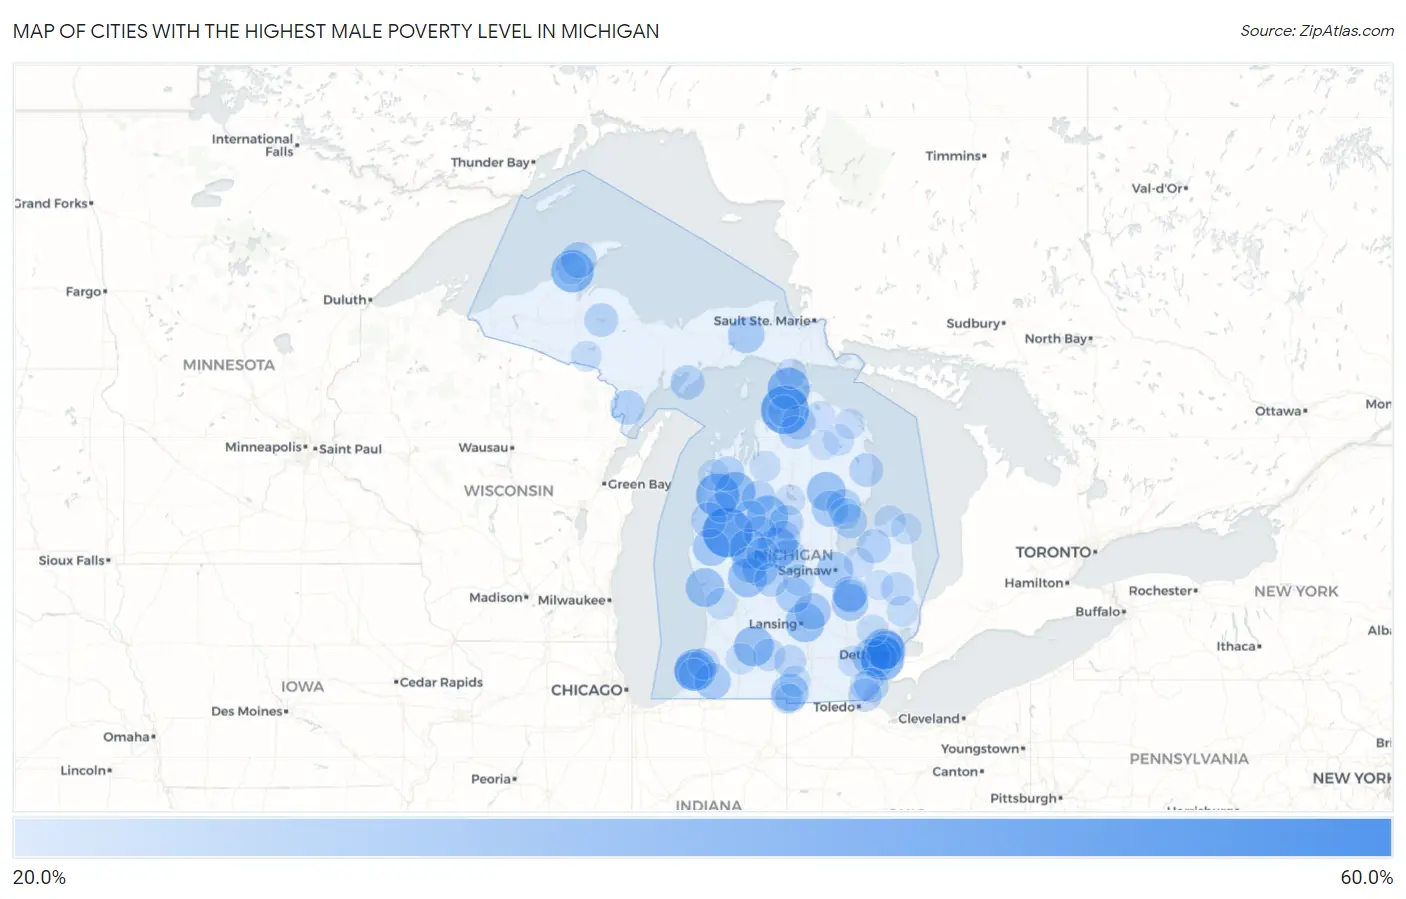
Cities with the Highest Male Poverty Level in Michigan
| City | Male Poverty | vs State | vs National | |
| 1. | Pelkie | 59.4% | 12.0%(+47.4)#1 | 11.3%(+48.0)#524 |
| 2. | Baldwin | 52.1% | 12.0%(+40.2)#2 | 11.3%(+40.8)#765 |
| 3. | Dodgeville | 51.2% | 12.0%(+39.2)#3 | 11.3%(+39.8)#808 |
| 4. | Oden | 49.7% | 12.0%(+37.8)#4 | 11.3%(+38.4)#896 |
| 5. | Paris | 48.7% | 12.0%(+36.7)#5 | 11.3%(+37.3)#942 |
| 6. | Hurontown | 46.5% | 12.0%(+34.5)#6 | 11.3%(+35.1)#1,071 |
| 7. | River Rouge | 42.7% | 12.0%(+30.7)#7 | 11.3%(+31.4)#1,318 |
| 8. | Kaleva | 42.6% | 12.0%(+30.6)#8 | 11.3%(+31.2)#1,331 |
| 9. | Elm Hall | 42.4% | 12.0%(+30.5)#9 | 11.3%(+31.1)#1,347 |
| 10. | Houghton | 41.6% | 12.0%(+29.7)#10 | 11.3%(+30.3)#1,411 |
| 11. | Carp Lake | 41.3% | 12.0%(+29.3)#11 | 11.3%(+30.0)#1,442 |
| 12. | Benton Heights | 40.4% | 12.0%(+28.5)#12 | 11.3%(+29.1)#1,540 |
| 13. | Marion | 39.6% | 12.0%(+27.6)#13 | 11.3%(+28.2)#1,611 |
| 14. | Mesick | 39.3% | 12.0%(+27.3)#14 | 11.3%(+28.0)#1,638 |
| 15. | Weidman | 38.4% | 12.0%(+26.5)#15 | 11.3%(+27.1)#1,748 |
| 16. | Hickory Corners | 37.6% | 12.0%(+25.7)#16 | 11.3%(+26.3)#1,828 |
| 17. | Highland Park | 37.5% | 12.0%(+25.6)#17 | 11.3%(+26.2)#1,832 |
| 18. | Big Rapids | 37.4% | 12.0%(+25.4)#18 | 11.3%(+26.0)#1,868 |
| 19. | Rockland | 37.3% | 12.0%(+25.4)#19 | 11.3%(+26.0)#1,869 |
| 20. | East Lansing | 36.8% | 12.0%(+24.8)#20 | 11.3%(+25.4)#1,937 |
| 21. | Pierson | 36.5% | 12.0%(+24.5)#21 | 11.3%(+25.2)#1,961 |
| 22. | Rose City | 36.1% | 12.0%(+24.2)#22 | 11.3%(+24.8)#2,013 |
| 23. | Benton Harbor | 35.8% | 12.0%(+23.9)#23 | 11.3%(+24.5)#2,047 |
| 24. | Muskegon Heights | 35.7% | 12.0%(+23.8)#24 | 11.3%(+24.4)#2,060 |
| 25. | Hamtramck | 35.7% | 12.0%(+23.7)#25 | 11.3%(+24.3)#2,066 |
| 26. | Reading | 33.8% | 12.0%(+21.9)#26 | 11.3%(+22.5)#2,307 |
| 27. | Inkster | 33.8% | 12.0%(+21.8)#27 | 11.3%(+22.4)#2,316 |
| 28. | Riverdale | 33.6% | 12.0%(+21.7)#28 | 11.3%(+22.3)#2,340 |
| 29. | Walkerville | 33.3% | 12.0%(+21.4)#29 | 11.3%(+22.0)#2,377 |
| 30. | Melvindale | 33.3% | 12.0%(+21.3)#30 | 11.3%(+22.0)#2,410 |
| 31. | Flint | 33.1% | 12.0%(+21.1)#31 | 11.3%(+21.7)#2,431 |
| 32. | Kincheloe | 32.8% | 12.0%(+20.8)#32 | 11.3%(+21.4)#2,481 |
| 33. | Laingsburg | 32.7% | 12.0%(+20.8)#33 | 11.3%(+21.4)#2,487 |
| 34. | Saginaw | 32.6% | 12.0%(+20.6)#34 | 11.3%(+21.2)#2,507 |
| 35. | Newberry | 32.4% | 12.0%(+20.4)#35 | 11.3%(+21.0)#2,534 |
| 36. | Lakeview | 32.3% | 12.0%(+20.3)#36 | 11.3%(+20.9)#2,559 |
| 37. | Skidway Lake | 32.2% | 12.0%(+20.3)#37 | 11.3%(+20.9)#2,563 |
| 38. | Dowagiac | 32.1% | 12.0%(+20.2)#38 | 11.3%(+20.8)#2,576 |
| 39. | Morley | 31.9% | 12.0%(+19.9)#39 | 11.3%(+20.6)#2,622 |
| 40. | Maple Rapids | 31.9% | 12.0%(+19.9)#40 | 11.3%(+20.5)#2,625 |
| 41. | Calumet | 31.9% | 12.0%(+19.9)#41 | 11.3%(+20.5)#2,626 |
| 42. | Mount Morris | 31.5% | 12.0%(+19.5)#42 | 11.3%(+20.1)#2,704 |
| 43. | Fountain | 31.2% | 12.0%(+19.2)#43 | 11.3%(+19.8)#2,754 |
| 44. | Detroit | 30.4% | 12.0%(+18.4)#44 | 11.3%(+19.0)#2,894 |
| 45. | Whittemore | 30.3% | 12.0%(+18.3)#45 | 11.3%(+18.9)#2,918 |
| 46. | Woodland Beach | 29.9% | 12.0%(+17.9)#46 | 11.3%(+18.5)#3,009 |
| 47. | Mount Pleasant | 29.9% | 12.0%(+17.9)#47 | 11.3%(+18.5)#3,010 |
| 48. | Daggett | 29.8% | 12.0%(+17.9)#48 | 11.3%(+18.5)#3,015 |
| 49. | Bendon | 29.7% | 12.0%(+17.8)#49 | 11.3%(+18.4)#3,031 |
| 50. | Garden | 29.7% | 12.0%(+17.7)#50 | 11.3%(+18.3)#3,046 |
| 51. | Harrison | 29.4% | 12.0%(+17.4)#51 | 11.3%(+18.0)#3,119 |
| 52. | Owendale | 29.4% | 12.0%(+17.4)#52 | 11.3%(+18.0)#3,121 |
| 53. | Au Gres | 29.2% | 12.0%(+17.2)#53 | 11.3%(+17.9)#3,164 |
| 54. | Jennings | 28.9% | 12.0%(+17.0)#54 | 11.3%(+17.6)#3,215 |
| 55. | Tower | 28.9% | 12.0%(+16.9)#55 | 11.3%(+17.6)#3,232 |
| 56. | Wolverine | 28.8% | 12.0%(+16.9)#56 | 11.3%(+17.5)#3,242 |
| 57. | Lincoln | 28.7% | 12.0%(+16.8)#57 | 11.3%(+17.4)#3,262 |
| 58. | Michigamme | 28.6% | 12.0%(+16.6)#58 | 11.3%(+17.2)#3,307 |
| 59. | Stanton | 28.5% | 12.0%(+16.6)#59 | 11.3%(+17.2)#3,325 |
| 60. | Farwell | 28.5% | 12.0%(+16.5)#60 | 11.3%(+17.1)#3,340 |
| 61. | Lakeport | 28.5% | 12.0%(+16.5)#61 | 11.3%(+17.1)#3,342 |
| 62. | Beecher | 28.4% | 12.0%(+16.5)#62 | 11.3%(+17.1)#3,346 |
| 63. | Luna Pier | 28.2% | 12.0%(+16.2)#63 | 11.3%(+16.9)#3,395 |
| 64. | Melvin | 27.8% | 12.0%(+15.8)#64 | 11.3%(+16.4)#3,493 |
| 65. | Evart | 27.4% | 12.0%(+15.4)#65 | 11.3%(+16.0)#3,596 |
| 66. | Vanderbilt | 27.1% | 12.0%(+15.2)#66 | 11.3%(+15.8)#3,664 |
| 67. | Brownlee Park | 26.9% | 12.0%(+14.9)#67 | 11.3%(+15.5)#3,741 |
| 68. | Albion | 26.8% | 12.0%(+14.9)#68 | 11.3%(+15.5)#3,747 |
| 69. | Mecosta | 26.6% | 12.0%(+14.7)#69 | 11.3%(+15.3)#3,808 |
| 70. | Paw Paw Lake | 26.3% | 12.0%(+14.4)#70 | 11.3%(+15.0)#3,881 |
| 71. | Tustin | 26.0% | 12.0%(+14.0)#71 | 11.3%(+14.7)#3,996 |
| 72. | Conway | 26.0% | 12.0%(+14.0)#72 | 11.3%(+14.7)#3,997 |
| 73. | Ithaca | 25.8% | 12.0%(+13.9)#73 | 11.3%(+14.5)#4,042 |
| 74. | Turner | 25.8% | 12.0%(+13.8)#74 | 11.3%(+14.5)#4,053 |
| 75. | Port Austin | 25.7% | 12.0%(+13.8)#75 | 11.3%(+14.4)#4,070 |
| 76. | Allendale | 25.6% | 12.0%(+13.7)#76 | 11.3%(+14.3)#4,103 |
| 77. | Benzonia | 25.5% | 12.0%(+13.5)#77 | 11.3%(+14.1)#4,155 |
| 78. | Pontiac | 25.4% | 12.0%(+13.5)#78 | 11.3%(+14.1)#4,164 |
| 79. | Montgomery | 25.4% | 12.0%(+13.4)#79 | 11.3%(+14.0)#4,182 |
| 80. | Ypsilanti | 25.3% | 12.0%(+13.3)#80 | 11.3%(+13.9)#4,209 |
| 81. | Winn | 25.3% | 12.0%(+13.3)#81 | 11.3%(+13.9)#4,212 |
| 82. | Kalamazoo | 25.2% | 12.0%(+13.2)#82 | 11.3%(+13.9)#4,254 |
| 83. | Hancock | 25.2% | 12.0%(+13.2)#83 | 11.3%(+13.8)#4,261 |
| 84. | Jonesville | 25.2% | 12.0%(+13.2)#84 | 11.3%(+13.8)#4,263 |
| 85. | Memphis | 25.1% | 12.0%(+13.1)#85 | 11.3%(+13.7)#4,286 |
| 86. | Hillman | 25.0% | 12.0%(+13.0)#86 | 11.3%(+13.7)#4,311 |
| 87. | Kalkaska | 24.9% | 12.0%(+12.9)#87 | 11.3%(+13.5)#4,382 |
| 88. | Port Hope | 24.6% | 12.0%(+12.6)#88 | 11.3%(+13.3)#4,478 |
| 89. | Crystal Falls | 24.4% | 12.0%(+12.4)#89 | 11.3%(+13.0)#4,555 |
| 90. | St Ignace | 24.2% | 12.0%(+12.3)#90 | 11.3%(+12.9)#4,601 |
| 91. | Houghton Lake | 24.2% | 12.0%(+12.3)#91 | 11.3%(+12.9)#4,610 |
| 92. | Onaway | 24.0% | 12.0%(+12.1)#92 | 11.3%(+12.7)#4,691 |
| 93. | Wellston | 23.9% | 12.0%(+12.0)#93 | 11.3%(+12.6)#4,720 |
| 94. | Fairgrove | 23.8% | 12.0%(+11.9)#94 | 11.3%(+12.5)#4,754 |
| 95. | Posen | 23.8% | 12.0%(+11.9)#95 | 11.3%(+12.5)#4,770 |
| 96. | Camden | 23.6% | 12.0%(+11.6)#96 | 11.3%(+12.2)#4,867 |
| 97. | Fair Plain | 23.5% | 12.0%(+11.5)#97 | 11.3%(+12.1)#4,902 |
| 98. | Atlanta | 23.5% | 12.0%(+11.5)#98 | 11.3%(+12.1)#4,904 |
| 99. | North Branch | 23.5% | 12.0%(+11.5)#99 | 11.3%(+12.1)#4,909 |
| 100. | West Monroe | 23.4% | 12.0%(+11.5)#100 | 11.3%(+12.1)#4,929 |
Common Questions
What are the Top 10 Cities with the Highest Male Poverty Level in Michigan?
Top 10 Cities with the Highest Male Poverty Level in Michigan are:
#1
52.1%
#2
49.7%
#3
42.7%
#4
42.6%
#5
41.6%
#6
41.3%
#7
40.4%
#8
39.6%
#9
39.3%
#10
38.4%
What city has the Highest Male Poverty Level in Michigan?
Baldwin has the Highest Male Poverty Level in Michigan with 52.1%.
What is the Poverty Level Among Males in the State of Michigan?
Poverty Level Among Males in Michigan is 12.0%.
What is the Poverty Level Among Males in the United States?
Poverty Level Among Males in the United States is 11.3%.