Cities with the Highest Male Poverty Level in Vermont
RELATED REPORTS & OPTIONS
Highest Poverty | Male
Vermont
Compare Cities
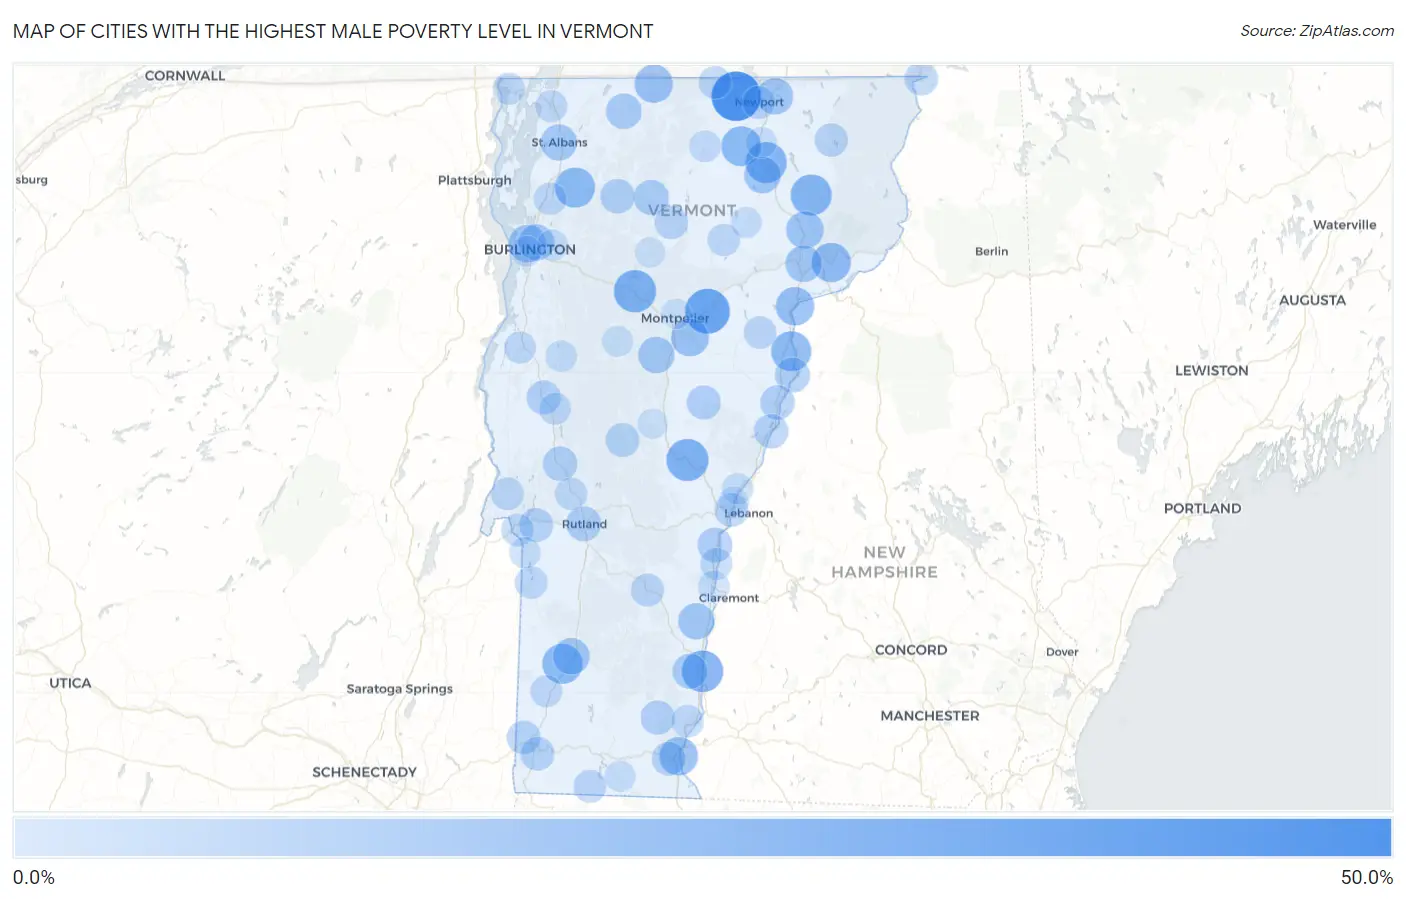
Map of Cities with the Highest Male Poverty Level in Vermont
0.0%
50.0%
Cities with the Highest Male Poverty Level in Vermont
| City | Male Poverty | vs State | vs National | |
| 1. | Newport Center | 46.8% | 9.3%(+37.5)#1 | 11.3%(+35.5)#1,052 |
| 2. | Plainfield | 36.3% | 9.3%(+26.9)#2 | 11.3%(+24.9)#1,992 |
| 3. | Waterbury | 31.0% | 9.3%(+21.6)#3 | 11.3%(+19.6)#2,794 |
| 4. | South Royalton | 30.4% | 9.3%(+21.0)#4 | 11.3%(+19.0)#2,896 |
| 5. | Bellows Falls | 29.2% | 9.3%(+19.8)#5 | 11.3%(+17.8)#3,165 |
| 6. | West Burke | 28.4% | 9.3%(+19.1)#6 | 11.3%(+17.1)#3,352 |
| 7. | Barton | 28.3% | 9.3%(+19.0)#7 | 11.3%(+17.0)#3,370 |
| 8. | Manchester | 26.3% | 9.3%(+17.0)#8 | 11.3%(+15.0)#3,886 |
| 9. | Fairfax | 26.3% | 9.3%(+16.9)#9 | 11.3%(+14.9)#3,901 |
| 10. | Wells River | 26.2% | 9.3%(+16.8)#10 | 11.3%(+14.8)#3,935 |
| 11. | Irasburg | 25.8% | 9.3%(+16.4)#11 | 11.3%(+14.4)#4,059 |
| 12. | Lunenburg | 24.5% | 9.3%(+15.2)#12 | 11.3%(+13.2)#4,519 |
| 13. | Concord | 24.3% | 9.3%(+15.0)#13 | 11.3%(+13.0)#4,574 |
| 14. | Weston | 23.5% | 9.3%(+14.2)#14 | 11.3%(+12.2)#4,881 |
| 15. | Brattleboro | 22.9% | 9.3%(+13.5)#15 | 11.3%(+11.5)#5,130 |
| 16. | Barnet | 22.6% | 9.3%(+13.2)#16 | 11.3%(+11.2)#5,281 |
| 17. | Richford | 22.0% | 9.3%(+12.6)#17 | 11.3%(+10.6)#5,560 |
| 18. | Barre | 21.4% | 9.3%(+12.0)#18 | 11.3%(+10.0)#5,857 |
| 19. | West Pawlet | 21.3% | 9.3%(+12.0)#19 | 11.3%(+10.0)#5,867 |
| 20. | Burlington | 20.7% | 9.3%(+11.4)#20 | 11.3%(+9.38)#6,158 |
| 21. | East Dorset | 20.4% | 9.3%(+11.1)#21 | 11.3%(+9.10)#6,302 |
| 22. | Lyndonville | 20.4% | 9.3%(+11.0)#22 | 11.3%(+9.02)#6,346 |
| 23. | Glover | 19.0% | 9.3%(+9.66)#23 | 11.3%(+7.66)#7,070 |
| 24. | Manchester Center | 18.7% | 9.3%(+9.34)#24 | 11.3%(+7.34)#7,292 |
| 25. | St Johnsbury | 18.7% | 9.3%(+9.33)#25 | 11.3%(+7.33)#7,300 |
| 26. | Derby Center | 18.4% | 9.3%(+9.06)#26 | 11.3%(+7.06)#7,464 |
| 27. | Northfield | 18.2% | 9.3%(+8.89)#27 | 11.3%(+6.89)#7,566 |
| 28. | Springfield | 18.2% | 9.3%(+8.87)#28 | 11.3%(+6.87)#7,582 |
| 29. | St Albans | 18.0% | 9.3%(+8.66)#29 | 11.3%(+6.66)#7,742 |
| 30. | Winooski | 18.0% | 9.3%(+8.66)#30 | 11.3%(+6.66)#7,744 |
| 31. | Enosburg Falls | 16.6% | 9.3%(+7.24)#31 | 11.3%(+5.24)#8,715 |
| 32. | Johnson | 15.8% | 9.3%(+6.45)#32 | 11.3%(+4.45)#9,264 |
| 33. | Pownal | 15.7% | 9.3%(+6.37)#33 | 11.3%(+4.37)#9,332 |
| 34. | Saxtons River | 15.6% | 9.3%(+6.24)#34 | 11.3%(+4.23)#9,467 |
| 35. | Newbury | 15.1% | 9.3%(+5.79)#35 | 11.3%(+3.79)#9,797 |
| 36. | Rutland | 15.1% | 9.3%(+5.72)#36 | 11.3%(+3.72)#9,854 |
| 37. | Danby | 15.0% | 9.3%(+5.61)#37 | 11.3%(+3.61)#9,939 |
| 38. | Hartland | 14.9% | 9.3%(+5.58)#38 | 11.3%(+3.58)#9,965 |
| 39. | West Woodstock | 14.6% | 9.3%(+5.27)#39 | 11.3%(+3.27)#10,224 |
| 40. | Brandon | 14.3% | 9.3%(+5.00)#40 | 11.3%(+3.00)#10,445 |
| 41. | Jeffersonville | 14.3% | 9.3%(+4.98)#41 | 11.3%(+2.98)#10,462 |
| 42. | Bradford | 14.0% | 9.3%(+4.66)#42 | 11.3%(+2.66)#10,773 |
| 43. | Hartford | 14.0% | 9.3%(+4.64)#43 | 11.3%(+2.64)#10,794 |
| 44. | Newfane | 13.6% | 9.3%(+4.30)#44 | 11.3%(+2.29)#11,069 |
| 45. | Fairlee | 13.6% | 9.3%(+4.30)#45 | 11.3%(+2.29)#11,073 |
| 46. | Middlebury | 13.4% | 9.3%(+4.07)#46 | 11.3%(+2.07)#11,298 |
| 47. | Chelsea | 13.4% | 9.3%(+4.05)#47 | 11.3%(+2.05)#11,319 |
| 48. | Castleton | 12.9% | 9.3%(+3.61)#48 | 11.3%(+1.61)#11,760 |
| 49. | Algiers | 12.9% | 9.3%(+3.60)#49 | 11.3%(+1.60)#11,767 |
| 50. | Rochester | 12.9% | 9.3%(+3.59)#50 | 11.3%(+1.59)#11,777 |
| 51. | North Bennington | 12.9% | 9.3%(+3.54)#51 | 11.3%(+1.54)#11,832 |
| 52. | Bennington | 12.8% | 9.3%(+3.51)#52 | 11.3%(+1.51)#11,874 |
| 53. | West Brattleboro | 12.7% | 9.3%(+3.38)#53 | 11.3%(+1.38)#11,981 |
| 54. | White River Junction | 12.4% | 9.3%(+3.05)#54 | 11.3%(+1.05)#12,318 |
| 55. | Morrisville | 12.2% | 9.3%(+2.87)#55 | 11.3%(+0.873)#12,489 |
| 56. | Island Pond | 12.1% | 9.3%(+2.72)#56 | 11.3%(+0.717)#12,648 |
| 57. | Beecher Falls | 12.0% | 9.3%(+2.66)#57 | 11.3%(+0.658)#12,739 |
| 58. | Newport | 11.5% | 9.3%(+2.19)#58 | 11.3%(+0.187)#13,255 |
| 59. | Ludlow | 11.1% | 9.3%(+1.81)#59 | 11.3%(-0.194)#13,687 |
| 60. | Readsboro | 10.7% | 9.3%(+1.37)#60 | 11.3%(-0.627)#14,189 |
| 61. | Chittenden | 10.7% | 9.3%(+1.37)#61 | 11.3%(-0.627)#14,195 |
| 62. | Benson | 10.5% | 9.3%(+1.14)#62 | 11.3%(-0.865)#14,441 |
| 63. | Stamford | 10.4% | 9.3%(+1.11)#63 | 11.3%(-0.894)#14,475 |
| 64. | North Troy | 10.4% | 9.3%(+1.08)#64 | 11.3%(-0.925)#14,511 |
| 65. | Groton | 10.4% | 9.3%(+1.04)#65 | 11.3%(-0.957)#14,554 |
| 66. | Wells | 10.4% | 9.3%(+1.02)#66 | 11.3%(-0.976)#14,575 |
| 67. | Putney | 10.3% | 9.3%(+0.962)#67 | 11.3%(-1.04)#14,654 |
| 68. | Milton | 10.3% | 9.3%(+0.960)#68 | 11.3%(-1.04)#14,656 |
| 69. | Lyndon Center | 10.2% | 9.3%(+0.819)#69 | 11.3%(-1.18)#14,810 |
| 70. | Fair Haven | 10.2% | 9.3%(+0.819)#70 | 11.3%(-1.18)#14,811 |
| 71. | Pittsford | 10.0% | 9.3%(+0.619)#71 | 11.3%(-1.38)#15,053 |
| 72. | Hardwick | 9.9% | 9.3%(+0.555)#72 | 11.3%(-1.45)#15,120 |
| 73. | East Middlebury | 9.3% | 9.3%(-0.031)#73 | 11.3%(-2.03)#15,821 |
| 74. | Swanton | 9.3% | 9.3%(-0.031)#74 | 11.3%(-2.03)#15,822 |
| 75. | Vergennes | 9.3% | 9.3%(-0.035)#75 | 11.3%(-2.04)#15,829 |
| 76. | Gilman | 9.2% | 9.3%(-0.097)#76 | 11.3%(-2.10)#15,913 |
| 77. | Arlington | 9.2% | 9.3%(-0.134)#77 | 11.3%(-2.13)#15,965 |
| 78. | Windsor | 9.0% | 9.3%(-0.343)#78 | 11.3%(-2.34)#16,242 |
| 79. | Alburgh | 9.0% | 9.3%(-0.346)#79 | 11.3%(-2.35)#16,245 |
| 80. | Lowell | 8.5% | 9.3%(-0.879)#80 | 11.3%(-2.88)#16,901 |
| 81. | Bristol | 8.0% | 9.3%(-1.30)#81 | 11.3%(-3.30)#17,423 |
| 82. | South Londonderry | 8.0% | 9.3%(-1.39)#82 | 11.3%(-3.39)#17,538 |
| 83. | Huntington Center | 8.0% | 9.3%(-1.39)#83 | 11.3%(-3.39)#17,540 |
| 84. | Norwich | 7.8% | 9.3%(-1.54)#84 | 11.3%(-3.54)#17,742 |
| 85. | Ascutney | 7.8% | 9.3%(-1.55)#85 | 11.3%(-3.55)#17,757 |
| 86. | Poultney | 7.6% | 9.3%(-1.73)#86 | 11.3%(-3.73)#18,009 |
| 87. | Essex Junction | 7.3% | 9.3%(-2.06)#87 | 11.3%(-4.06)#18,446 |
| 88. | Waitsfield | 7.2% | 9.3%(-2.13)#88 | 11.3%(-4.13)#18,558 |
| 89. | Jacksonville | 7.1% | 9.3%(-2.20)#89 | 11.3%(-4.20)#18,665 |
| 90. | Orleans | 7.1% | 9.3%(-2.23)#90 | 11.3%(-4.23)#18,716 |
| 91. | Greensboro Bend | 7.1% | 9.3%(-2.25)#91 | 11.3%(-4.25)#18,751 |
| 92. | Sheffield | 6.6% | 9.3%(-2.78)#92 | 11.3%(-4.78)#19,548 |
| 93. | South Burlington | 6.4% | 9.3%(-2.92)#93 | 11.3%(-4.92)#19,730 |
| 94. | East Poultney | 6.0% | 9.3%(-3.38)#94 | 11.3%(-5.38)#20,383 |
| 95. | Randolph | 5.7% | 9.3%(-3.65)#95 | 11.3%(-5.65)#20,763 |
| 96. | Montpelier | 5.6% | 9.3%(-3.74)#96 | 11.3%(-5.74)#20,892 |
| 97. | Stowe | 5.6% | 9.3%(-3.75)#97 | 11.3%(-5.75)#20,920 |
| 98. | Wilder | 5.4% | 9.3%(-3.97)#98 | 11.3%(-5.97)#21,269 |
| 99. | St. George | 5.4% | 9.3%(-3.98)#99 | 11.3%(-5.98)#21,273 |
| 100. | Pownal Center | 5.2% | 9.3%(-4.16)#100 | 11.3%(-6.16)#21,537 |
1
2Common Questions
What are the Top 10 Cities with the Highest Male Poverty Level in Vermont?
Top 10 Cities with the Highest Male Poverty Level in Vermont are:
#1
46.8%
#2
36.3%
#3
31.0%
#4
30.4%
#5
29.2%
#6
28.4%
#7
28.3%
#8
26.3%
#9
26.3%
#10
26.2%
What city has the Highest Male Poverty Level in Vermont?
Newport Center has the Highest Male Poverty Level in Vermont with 46.8%.
What is the Poverty Level Among Males in the State of Vermont?
Poverty Level Among Males in Vermont is 9.3%.
What is the Poverty Level Among Males in the United States?
Poverty Level Among Males in the United States is 11.3%.