Cities with the Highest Male Poverty Level in Indiana
RELATED REPORTS & OPTIONS
Highest Poverty | Male
Indiana
Compare Cities
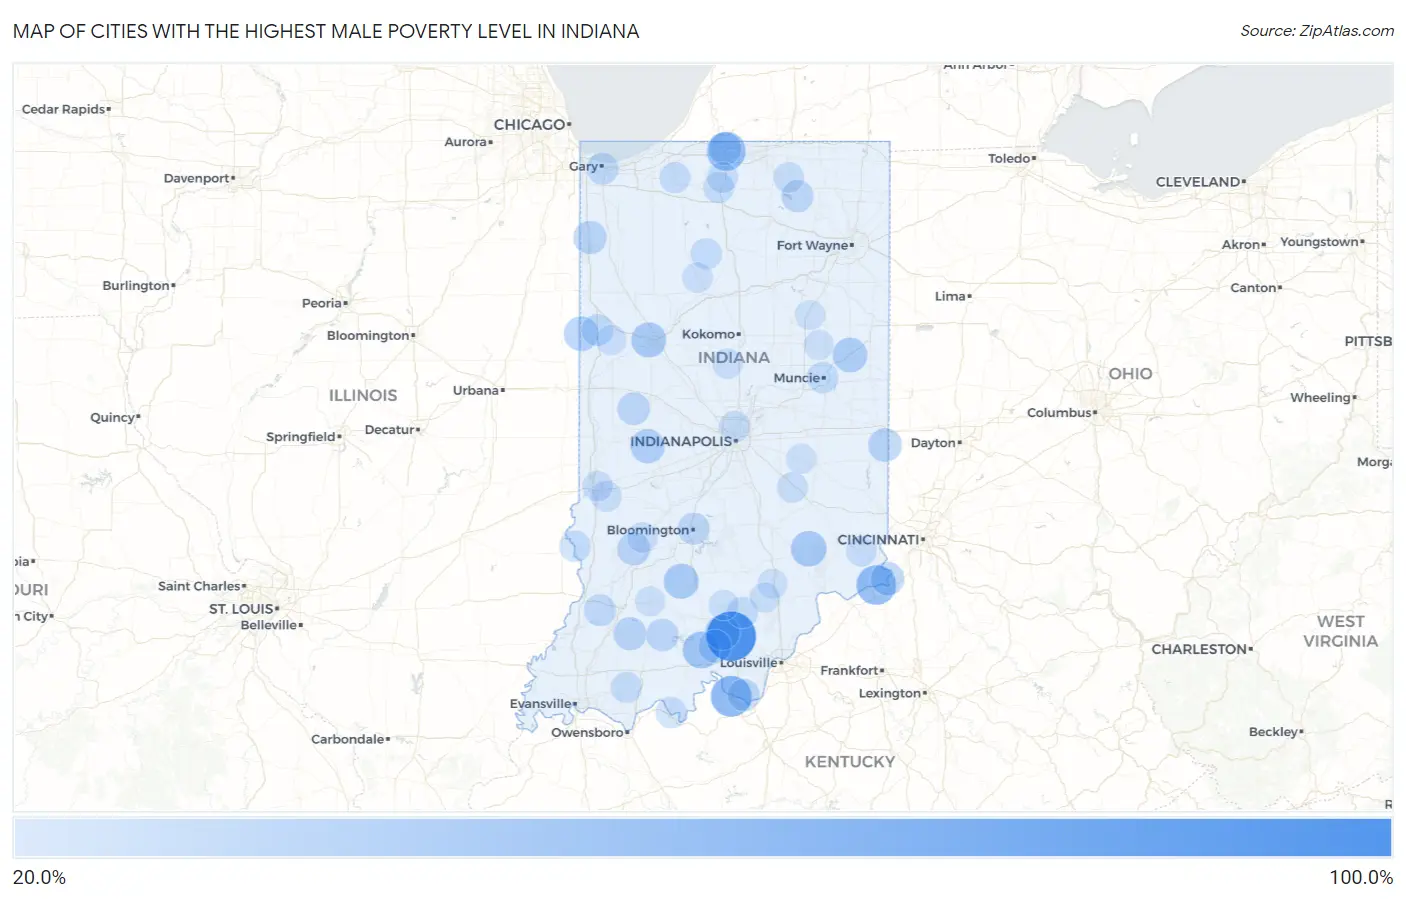
Map of Cities with the Highest Male Poverty Level in Indiana
0.0%
100.0%
Cities with the Highest Male Poverty Level in Indiana
| City | Male Poverty | vs State | vs National | |
| 1. | Millville | 100.0% | 11.1%(+88.9)#1 | 11.3%(+88.7)#18 |
| 2. | Pence | 100.0% | 11.1%(+88.9)#2 | 11.3%(+88.7)#22 |
| 3. | Linn Grove | 100.0% | 11.1%(+88.9)#3 | 11.3%(+88.7)#31 |
| 4. | Penntown | 100.0% | 11.1%(+88.9)#4 | 11.3%(+88.7)#45 |
| 5. | Lake View | 100.0% | 11.1%(+88.9)#5 | 11.3%(+88.7)#48 |
| 6. | Fredericksburg | 100.0% | 11.1%(+88.9)#6 | 11.3%(+88.7)#72 |
| 7. | Burney | 100.0% | 11.1%(+88.9)#7 | 11.3%(+88.7)#82 |
| 8. | Lawrenceport | 100.0% | 11.1%(+88.9)#8 | 11.3%(+88.7)#89 |
| 9. | Cates | 91.4% | 11.1%(+80.3)#9 | 11.3%(+80.1)#137 |
| 10. | Grayford | 80.0% | 11.1%(+68.9)#10 | 11.3%(+68.7)#200 |
| 11. | Arthur | 74.2% | 11.1%(+63.2)#11 | 11.3%(+62.9)#254 |
| 12. | Centerton | 70.5% | 11.1%(+59.5)#12 | 11.3%(+59.2)#304 |
| 13. | Mauckport | 65.0% | 11.1%(+53.9)#13 | 11.3%(+53.7)#391 |
| 14. | Burnett | 64.7% | 11.1%(+53.7)#14 | 11.3%(+53.4)#393 |
| 15. | Florence | 60.0% | 11.1%(+48.9)#15 | 11.3%(+48.7)#502 |
| 16. | Otisco | 59.1% | 11.1%(+48.0)#16 | 11.3%(+47.7)#538 |
| 17. | Azalia | 58.2% | 11.1%(+47.2)#17 | 11.3%(+46.9)#562 |
| 18. | Notre Dame | 56.7% | 11.1%(+45.7)#18 | 11.3%(+45.4)#601 |
| 19. | Eckerty | 53.1% | 11.1%(+42.1)#19 | 11.3%(+41.8)#732 |
| 20. | Letts | 52.2% | 11.1%(+41.1)#20 | 11.3%(+40.8)#764 |
| 21. | Hartz Lake | 51.1% | 11.1%(+40.1)#21 | 11.3%(+39.8)#812 |
| 22. | Adams | 50.6% | 11.1%(+39.5)#22 | 11.3%(+39.2)#842 |
| 23. | Leiters Ford | 50.5% | 11.1%(+39.4)#23 | 11.3%(+39.1)#847 |
| 24. | English | 49.8% | 11.1%(+38.8)#24 | 11.3%(+38.5)#894 |
| 25. | Cross Plains | 47.5% | 11.1%(+36.4)#25 | 11.3%(+36.2)#1,010 |
| 26. | Groverton | 47.3% | 11.1%(+36.3)#26 | 11.3%(+36.0)#1,023 |
| 27. | St. Omer | 45.7% | 11.1%(+34.6)#27 | 11.3%(+34.3)#1,125 |
| 28. | Eugene | 45.5% | 11.1%(+34.4)#28 | 11.3%(+34.1)#1,132 |
| 29. | Butlerville | 44.3% | 11.1%(+33.3)#29 | 11.3%(+33.0)#1,204 |
| 30. | Prairie Creek | 43.2% | 11.1%(+32.2)#30 | 11.3%(+31.9)#1,274 |
| 31. | Brimfield | 43.0% | 11.1%(+31.9)#31 | 11.3%(+31.6)#1,295 |
| 32. | Paris Crossing | 42.9% | 11.1%(+31.8)#32 | 11.3%(+31.5)#1,312 |
| 33. | West Lafayette | 42.4% | 11.1%(+31.3)#33 | 11.3%(+31.0)#1,351 |
| 34. | Williams | 42.4% | 11.1%(+31.3)#34 | 11.3%(+31.0)#1,354 |
| 35. | Hardinsburg | 41.7% | 11.1%(+30.6)#35 | 11.3%(+30.3)#1,404 |
| 36. | Redkey | 41.2% | 11.1%(+30.1)#36 | 11.3%(+29.8)#1,453 |
| 37. | Ambia | 40.7% | 11.1%(+29.6)#37 | 11.3%(+29.3)#1,518 |
| 38. | Van Bibber Lake | 39.5% | 11.1%(+28.4)#38 | 11.3%(+28.2)#1,623 |
| 39. | Lewis | 38.6% | 11.1%(+27.5)#39 | 11.3%(+27.2)#1,729 |
| 40. | Deer Creek | 37.5% | 11.1%(+26.4)#40 | 11.3%(+26.2)#1,842 |
| 41. | Anoka | 37.4% | 11.1%(+26.4)#41 | 11.3%(+26.1)#1,860 |
| 42. | Boston | 36.5% | 11.1%(+25.4)#42 | 11.3%(+25.1)#1,966 |
| 43. | Patriot | 36.1% | 11.1%(+25.1)#43 | 11.3%(+24.8)#2,014 |
| 44. | Lake Bruce | 35.8% | 11.1%(+24.8)#44 | 11.3%(+24.5)#2,049 |
| 45. | Lake Village | 35.6% | 11.1%(+24.5)#45 | 11.3%(+24.2)#2,077 |
| 46. | Rockfield | 35.5% | 11.1%(+24.4)#46 | 11.3%(+24.1)#2,083 |
| 47. | Cass | 35.0% | 11.1%(+23.9)#47 | 11.3%(+23.7)#2,157 |
| 48. | Otwell | 34.8% | 11.1%(+23.7)#48 | 11.3%(+23.4)#2,180 |
| 49. | Switz City | 34.5% | 11.1%(+23.5)#49 | 11.3%(+23.2)#2,213 |
| 50. | Marengo | 34.5% | 11.1%(+23.4)#50 | 11.3%(+23.1)#2,227 |
| 51. | Pleasantville | 34.4% | 11.1%(+23.3)#51 | 11.3%(+23.0)#2,245 |
| 52. | Roseland | 33.5% | 11.1%(+22.4)#52 | 11.3%(+22.2)#2,355 |
| 53. | Royerton | 33.3% | 11.1%(+22.3)#53 | 11.3%(+22.0)#2,379 |
| 54. | Alamo | 33.3% | 11.1%(+22.3)#54 | 11.3%(+22.0)#2,392 |
| 55. | Dubois | 32.7% | 11.1%(+21.7)#55 | 11.3%(+21.4)#2,491 |
| 56. | Scott | 32.2% | 11.1%(+21.2)#56 | 11.3%(+20.9)#2,568 |
| 57. | North Grove | 31.8% | 11.1%(+20.8)#57 | 11.3%(+20.5)#2,645 |
| 58. | Cromwell | 31.7% | 11.1%(+20.6)#58 | 11.3%(+20.3)#2,672 |
| 59. | Laconia | 31.2% | 11.1%(+20.2)#59 | 11.3%(+19.9)#2,732 |
| 60. | Pulaski | 31.2% | 11.1%(+20.2)#60 | 11.3%(+19.9)#2,734 |
| 61. | Bloomington | 31.0% | 11.1%(+20.0)#61 | 11.3%(+19.7)#2,780 |
| 62. | Alford | 31.0% | 11.1%(+19.9)#62 | 11.3%(+19.6)#2,797 |
| 63. | Grantsburg | 30.8% | 11.1%(+19.7)#63 | 11.3%(+19.4)#2,833 |
| 64. | Coal | 30.8% | 11.1%(+19.7)#64 | 11.3%(+19.4)#2,835 |
| 65. | Monroe City | 30.7% | 11.1%(+19.7)#65 | 11.3%(+19.4)#2,840 |
| 66. | Bear Lake | 30.4% | 11.1%(+19.3)#66 | 11.3%(+19.0)#2,897 |
| 67. | Boswell | 30.2% | 11.1%(+19.2)#67 | 11.3%(+18.9)#2,935 |
| 68. | Gary | 30.0% | 11.1%(+18.9)#68 | 11.3%(+18.6)#2,990 |
| 69. | Billtown | 29.3% | 11.1%(+18.3)#69 | 11.3%(+18.0)#3,130 |
| 70. | Fountaintown | 29.0% | 11.1%(+17.9)#70 | 11.3%(+17.6)#3,206 |
| 71. | Muncie | 28.9% | 11.1%(+17.8)#71 | 11.3%(+17.5)#3,234 |
| 72. | Merom | 28.4% | 11.1%(+17.4)#72 | 11.3%(+17.1)#3,343 |
| 73. | Salem | 28.2% | 11.1%(+17.1)#73 | 11.3%(+16.8)#3,402 |
| 74. | Tennyson | 28.0% | 11.1%(+17.0)#74 | 11.3%(+16.7)#3,434 |
| 75. | Kewanna | 28.0% | 11.1%(+16.9)#75 | 11.3%(+16.6)#3,444 |
| 76. | Kingsbury | 27.9% | 11.1%(+16.8)#76 | 11.3%(+16.5)#3,475 |
| 77. | La Paz | 27.8% | 11.1%(+16.7)#77 | 11.3%(+16.4)#3,492 |
| 78. | Cannelton | 27.5% | 11.1%(+16.4)#78 | 11.3%(+16.2)#3,566 |
| 79. | North Crows Nest | 27.3% | 11.1%(+16.2)#79 | 11.3%(+15.9)#3,634 |
| 80. | Pittsburg | 27.0% | 11.1%(+15.9)#80 | 11.3%(+15.6)#3,712 |
| 81. | Riley | 27.0% | 11.1%(+15.9)#81 | 11.3%(+15.6)#3,717 |
| 82. | Waldron | 26.6% | 11.1%(+15.6)#82 | 11.3%(+15.3)#3,803 |
| 83. | Lakeville | 26.6% | 11.1%(+15.6)#83 | 11.3%(+15.3)#3,804 |
| 84. | Millersburg | 26.1% | 11.1%(+15.0)#84 | 11.3%(+14.7)#3,977 |
| 85. | Worthington | 25.9% | 11.1%(+14.8)#85 | 11.3%(+14.6)#4,026 |
| 86. | Dillsboro | 25.9% | 11.1%(+14.8)#86 | 11.3%(+14.5)#4,033 |
| 87. | Royal Center | 25.6% | 11.1%(+14.5)#87 | 11.3%(+14.2)#4,125 |
| 88. | Terre Haute | 25.1% | 11.1%(+14.0)#88 | 11.3%(+13.7)#4,289 |
| 89. | Kempton | 25.0% | 11.1%(+13.9)#89 | 11.3%(+13.7)#4,321 |
| 90. | Pine Village | 25.0% | 11.1%(+13.9)#90 | 11.3%(+13.7)#4,322 |
| 91. | Nyona Lake | 25.0% | 11.1%(+13.9)#91 | 11.3%(+13.7)#4,330 |
| 92. | Campbellsburg | 24.6% | 11.1%(+13.6)#92 | 11.3%(+13.3)#4,479 |
| 93. | Crothersville | 24.4% | 11.1%(+13.3)#93 | 11.3%(+13.0)#4,554 |
| 94. | Shamrock Lakes | 24.3% | 11.1%(+13.2)#94 | 11.3%(+12.9)#4,593 |
| 95. | Miami | 24.3% | 11.1%(+13.2)#95 | 11.3%(+12.9)#4,595 |
| 96. | Wawaka | 24.2% | 11.1%(+13.2)#96 | 11.3%(+12.9)#4,598 |
| 97. | Arlington | 24.2% | 11.1%(+13.2)#97 | 11.3%(+12.9)#4,603 |
| 98. | Little York | 24.1% | 11.1%(+13.0)#98 | 11.3%(+12.7)#4,670 |
| 99. | Van Buren | 24.0% | 11.1%(+12.9)#99 | 11.3%(+12.6)#4,712 |
| 100. | Loogootee | 23.9% | 11.1%(+12.9)#100 | 11.3%(+12.6)#4,729 |
Common Questions
What are the Top 10 Cities with the Highest Male Poverty Level in Indiana?
Top 10 Cities with the Highest Male Poverty Level in Indiana are:
#1
100.0%
#2
65.0%
#3
60.0%
#4
56.7%
#5
49.8%
#6
44.3%
#7
42.4%
#8
42.4%
#9
41.7%
#10
41.2%
What city has the Highest Male Poverty Level in Indiana?
Fredericksburg has the Highest Male Poverty Level in Indiana with 100.0%.
What is the Poverty Level Among Males in the State of Indiana?
Poverty Level Among Males in Indiana is 11.1%.
What is the Poverty Level Among Males in the United States?
Poverty Level Among Males in the United States is 11.3%.