Cities with the Highest Male Poverty Level in Ohio
RELATED REPORTS & OPTIONS
Highest Poverty | Male
Ohio
Compare Cities
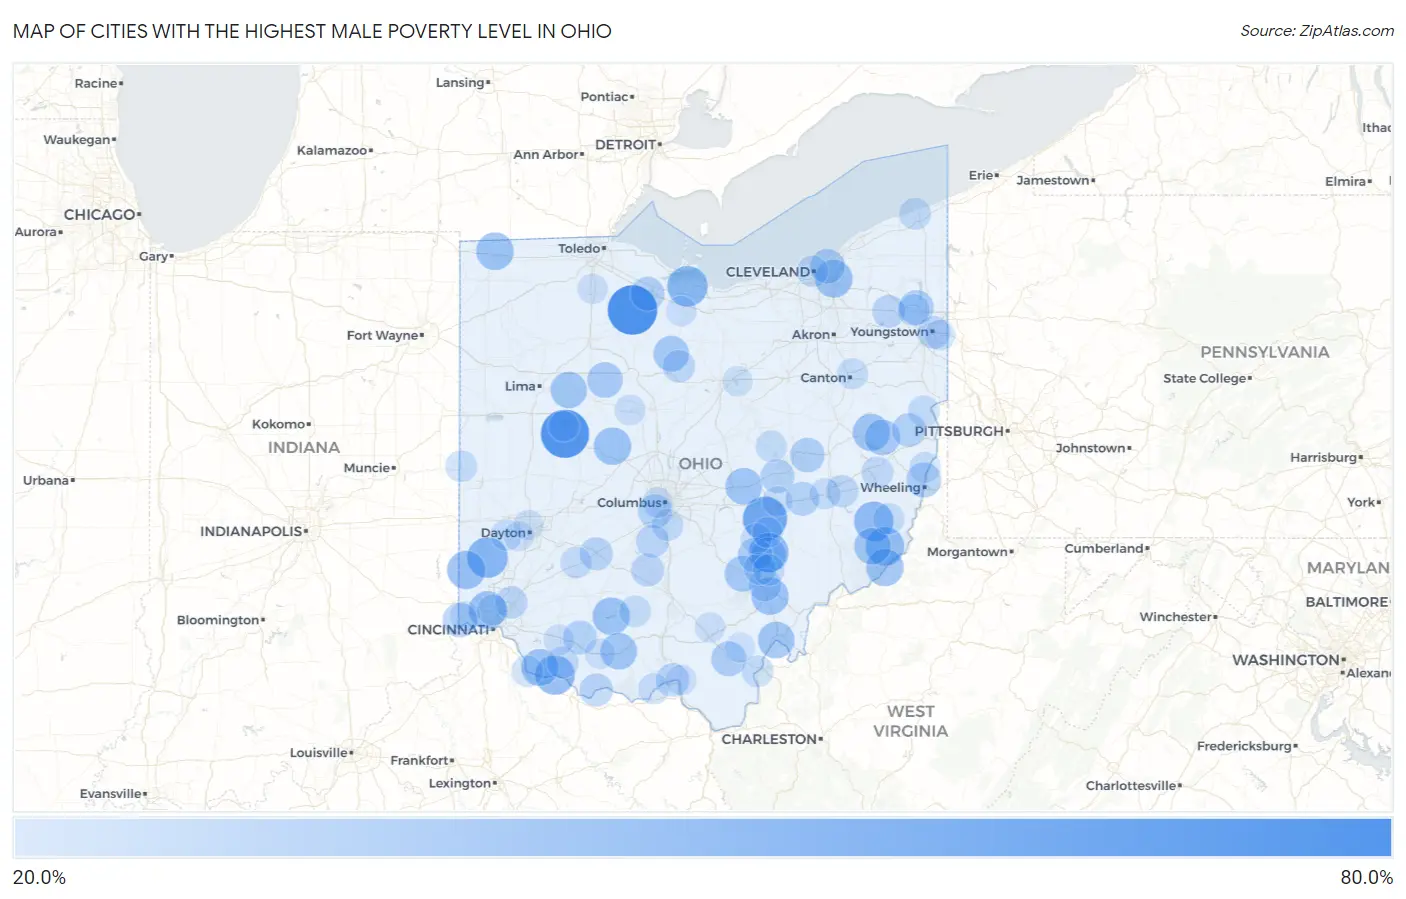
Map of Cities with the Highest Male Poverty Level in Ohio
0.0%
80.0%
Cities with the Highest Male Poverty Level in Ohio
| City | Male Poverty | vs State | vs National | |
| 1. | Kansas | 72.9% | 12.0%(+60.9)#1 | 11.3%(+61.6)#269 |
| 2. | Lewistown | 69.8% | 12.0%(+57.8)#2 | 11.3%(+58.4)#322 |
| 3. | East Fultonham | 60.0% | 12.0%(+48.0)#3 | 11.3%(+48.7)#498 |
| 4. | Madison Place | 53.8% | 12.0%(+41.8)#4 | 11.3%(+42.5)#708 |
| 5. | West Elkton | 51.1% | 12.0%(+39.1)#5 | 11.3%(+39.8)#813 |
| 6. | East Alliance | 50.9% | 12.0%(+38.9)#6 | 11.3%(+39.5)#827 |
| 7. | Castalia | 50.7% | 12.0%(+38.7)#7 | 11.3%(+39.3)#838 |
| 8. | Rendville | 48.6% | 12.0%(+36.6)#8 | 11.3%(+37.3)#944 |
| 9. | Higginsport | 48.5% | 12.0%(+36.5)#9 | 11.3%(+37.1)#952 |
| 10. | Miltonsburg | 48.5% | 12.0%(+36.5)#10 | 11.3%(+37.1)#954 |
| 11. | Antioch | 46.4% | 12.0%(+34.4)#11 | 11.3%(+35.1)#1,076 |
| 12. | Oxford | 45.4% | 12.0%(+33.4)#12 | 11.3%(+34.1)#1,134 |
| 13. | Highland Hills | 44.1% | 12.0%(+32.1)#13 | 11.3%(+32.7)#1,217 |
| 14. | Skyline Acres | 43.9% | 12.0%(+31.9)#14 | 11.3%(+32.6)#1,225 |
| 15. | Highland Holiday | 43.8% | 12.0%(+31.8)#15 | 11.3%(+32.4)#1,235 |
| 16. | Raymond | 43.7% | 12.0%(+31.7)#16 | 11.3%(+32.3)#1,241 |
| 17. | Kunkle | 43.6% | 12.0%(+31.6)#17 | 11.3%(+32.3)#1,244 |
| 18. | Matamoras | 43.5% | 12.0%(+31.5)#18 | 11.3%(+32.1)#1,258 |
| 19. | Athens | 43.2% | 12.0%(+31.2)#19 | 11.3%(+31.9)#1,279 |
| 20. | Bowerston | 42.9% | 12.0%(+30.9)#20 | 11.3%(+31.6)#1,299 |
| 21. | Felicity | 42.5% | 12.0%(+30.5)#21 | 11.3%(+31.1)#1,339 |
| 22. | Pomeroy | 41.7% | 12.0%(+29.7)#22 | 11.3%(+30.4)#1,394 |
| 23. | Marne | 41.7% | 12.0%(+29.7)#23 | 11.3%(+30.3)#1,399 |
| 24. | Peebles | 41.5% | 12.0%(+29.5)#24 | 11.3%(+30.2)#1,423 |
| 25. | Graysville | 41.4% | 12.0%(+29.4)#25 | 11.3%(+30.0)#1,437 |
| 26. | Alger | 41.3% | 12.0%(+29.2)#26 | 11.3%(+29.9)#1,445 |
| 27. | Haydenville | 39.9% | 12.0%(+27.8)#27 | 11.3%(+28.5)#1,591 |
| 28. | Chatfield | 39.5% | 12.0%(+27.5)#28 | 11.3%(+28.1)#1,624 |
| 29. | South Mount Vernon | 39.4% | 12.0%(+27.4)#29 | 11.3%(+28.1)#1,628 |
| 30. | Patterson | 39.0% | 12.0%(+27.0)#30 | 11.3%(+27.7)#1,667 |
| 31. | Scio | 39.0% | 12.0%(+27.0)#31 | 11.3%(+27.6)#1,674 |
| 32. | Bidwell | 38.3% | 12.0%(+26.3)#32 | 11.3%(+27.0)#1,753 |
| 33. | Corning | 37.9% | 12.0%(+25.9)#33 | 11.3%(+26.5)#1,796 |
| 34. | Centerville Thurman | 37.5% | 12.0%(+25.5)#34 | 11.3%(+26.2)#1,846 |
| 35. | Martins Ferry | 37.3% | 12.0%(+25.3)#35 | 11.3%(+26.0)#1,872 |
| 36. | East Cleveland | 37.0% | 12.0%(+25.0)#36 | 11.3%(+25.7)#1,908 |
| 37. | Morgandale | 37.0% | 12.0%(+25.0)#37 | 11.3%(+25.7)#1,910 |
| 38. | West Lafayette | 36.6% | 12.0%(+24.6)#38 | 11.3%(+25.2)#1,955 |
| 39. | Elizabethtown | 36.6% | 12.0%(+24.6)#39 | 11.3%(+25.2)#1,956 |
| 40. | Shawnee | 36.5% | 12.0%(+24.5)#40 | 11.3%(+25.1)#1,965 |
| 41. | Stony Prairie | 35.5% | 12.0%(+23.5)#41 | 11.3%(+24.2)#2,080 |
| 42. | Urbancrest | 35.3% | 12.0%(+23.3)#42 | 11.3%(+24.0)#2,105 |
| 43. | Mowrystown | 35.2% | 12.0%(+23.2)#43 | 11.3%(+23.8)#2,130 |
| 44. | Trinway | 35.1% | 12.0%(+23.1)#44 | 11.3%(+23.7)#2,139 |
| 45. | New Haven Cdp Huron County | 35.0% | 12.0%(+23.0)#45 | 11.3%(+23.7)#2,149 |
| 46. | Norwich | 35.0% | 12.0%(+23.0)#46 | 11.3%(+23.7)#2,155 |
| 47. | East Springfield | 34.8% | 12.0%(+22.8)#47 | 11.3%(+23.4)#2,181 |
| 48. | Bolton | 34.5% | 12.0%(+22.5)#48 | 11.3%(+23.2)#2,210 |
| 49. | Portsmouth | 33.8% | 12.0%(+21.8)#49 | 11.3%(+22.5)#2,306 |
| 50. | Manchester | 33.6% | 12.0%(+21.6)#50 | 11.3%(+22.3)#2,339 |
| 51. | Octa | 33.3% | 12.0%(+21.3)#51 | 11.3%(+22.0)#2,394 |
| 52. | Clarksburg | 32.9% | 12.0%(+20.9)#52 | 11.3%(+21.6)#2,462 |
| 53. | Darbyville | 32.8% | 12.0%(+20.8)#53 | 11.3%(+21.5)#2,476 |
| 54. | Youngstown | 32.8% | 12.0%(+20.7)#54 | 11.3%(+21.4)#2,486 |
| 55. | Windham | 32.7% | 12.0%(+20.7)#55 | 11.3%(+21.4)#2,490 |
| 56. | Chauncey | 32.4% | 12.0%(+20.4)#56 | 11.3%(+21.1)#2,531 |
| 57. | Sulphur Springs | 32.0% | 12.0%(+20.0)#57 | 11.3%(+20.7)#2,601 |
| 58. | Brecon | 31.7% | 12.0%(+19.7)#58 | 11.3%(+20.4)#2,658 |
| 59. | Murray City | 31.5% | 12.0%(+19.5)#59 | 11.3%(+20.2)#2,698 |
| 60. | Old Washington | 31.1% | 12.0%(+19.1)#60 | 11.3%(+19.7)#2,776 |
| 61. | Ashtabula | 30.5% | 12.0%(+18.5)#61 | 11.3%(+19.1)#2,876 |
| 62. | Georgetown | 30.3% | 12.0%(+18.3)#62 | 11.3%(+18.9)#2,920 |
| 63. | Holloway | 30.3% | 12.0%(+18.3)#63 | 11.3%(+18.9)#2,926 |
| 64. | Lockbourne | 30.2% | 12.0%(+18.2)#64 | 11.3%(+18.9)#2,928 |
| 65. | Warren | 30.1% | 12.0%(+18.0)#65 | 11.3%(+18.7)#2,966 |
| 66. | Irondale | 30.0% | 12.0%(+18.0)#66 | 11.3%(+18.7)#2,975 |
| 67. | Port William | 30.0% | 12.0%(+18.0)#67 | 11.3%(+18.7)#2,976 |
| 68. | Neville | 30.0% | 12.0%(+18.0)#68 | 11.3%(+18.7)#2,987 |
| 69. | Bainbridge | 29.8% | 12.0%(+17.8)#69 | 11.3%(+18.5)#3,022 |
| 70. | Gallipolis | 29.7% | 12.0%(+17.7)#70 | 11.3%(+18.4)#3,041 |
| 71. | Cleveland | 29.7% | 12.0%(+17.7)#71 | 11.3%(+18.3)#3,044 |
| 72. | Glouster | 29.7% | 12.0%(+17.7)#72 | 11.3%(+18.3)#3,049 |
| 73. | West Logan | 29.6% | 12.0%(+17.6)#73 | 11.3%(+18.2)#3,065 |
| 74. | Union City | 29.5% | 12.0%(+17.5)#74 | 11.3%(+18.1)#3,094 |
| 75. | Beallsville | 29.4% | 12.0%(+17.3)#75 | 11.3%(+18.0)#3,126 |
| 76. | Nellie | 29.2% | 12.0%(+17.2)#76 | 11.3%(+17.9)#3,161 |
| 77. | New Lebanon | 29.1% | 12.0%(+17.1)#77 | 11.3%(+17.7)#3,181 |
| 78. | Cambridge | 28.9% | 12.0%(+16.9)#78 | 11.3%(+17.6)#3,230 |
| 79. | Connorville | 28.8% | 12.0%(+16.8)#79 | 11.3%(+17.5)#3,244 |
| 80. | Friendship | 28.8% | 12.0%(+16.8)#80 | 11.3%(+17.4)#3,251 |
| 81. | Canton | 28.5% | 12.0%(+16.5)#81 | 11.3%(+17.2)#3,330 |
| 82. | Pleasant Hills | 28.4% | 12.0%(+16.4)#82 | 11.3%(+17.0)#3,358 |
| 83. | New Lexington | 28.1% | 12.0%(+16.1)#83 | 11.3%(+16.8)#3,420 |
| 84. | Mount Orab | 28.0% | 12.0%(+16.0)#84 | 11.3%(+16.6)#3,443 |
| 85. | Campbell | 27.9% | 12.0%(+15.9)#85 | 11.3%(+16.5)#3,470 |
| 86. | New Bloomington | 27.7% | 12.0%(+15.7)#86 | 11.3%(+16.4)#3,505 |
| 87. | Valleyview | 27.7% | 12.0%(+15.7)#87 | 11.3%(+16.4)#3,515 |
| 88. | Crooksville | 27.6% | 12.0%(+15.6)#88 | 11.3%(+16.3)#3,535 |
| 89. | Flat Rock | 27.5% | 12.0%(+15.5)#89 | 11.3%(+16.2)#3,563 |
| 90. | Bowling Green | 27.4% | 12.0%(+15.4)#90 | 11.3%(+16.1)#3,593 |
| 91. | Coalton | 27.3% | 12.0%(+15.3)#91 | 11.3%(+16.0)#3,613 |
| 92. | Russells Point | 27.3% | 12.0%(+15.3)#92 | 11.3%(+16.0)#3,620 |
| 93. | Sciotodale | 27.3% | 12.0%(+15.3)#93 | 11.3%(+16.0)#3,621 |
| 94. | Seaman | 27.1% | 12.0%(+15.1)#94 | 11.3%(+15.7)#3,681 |
| 95. | Mifflin | 27.0% | 12.0%(+15.0)#95 | 11.3%(+15.7)#3,698 |
| 96. | Zanesville | 27.0% | 12.0%(+15.0)#96 | 11.3%(+15.6)#3,716 |
| 97. | Dayton | 26.8% | 12.0%(+14.8)#97 | 11.3%(+15.5)#3,748 |
| 98. | Hooven | 26.8% | 12.0%(+14.8)#98 | 11.3%(+15.5)#3,757 |
| 99. | Vinton | 26.7% | 12.0%(+14.7)#99 | 11.3%(+15.3)#3,788 |
| 100. | Drexel | 26.5% | 12.0%(+14.5)#100 | 11.3%(+15.2)#3,825 |
Common Questions
What are the Top 10 Cities with the Highest Male Poverty Level in Ohio?
Top 10 Cities with the Highest Male Poverty Level in Ohio are:
#1
72.9%
#2
69.8%
#3
60.0%
#4
51.1%
#5
50.7%
#6
48.6%
#7
48.5%
#8
48.5%
#9
46.4%
#10
45.4%
What city has the Highest Male Poverty Level in Ohio?
Kansas has the Highest Male Poverty Level in Ohio with 72.9%.
What is the Poverty Level Among Males in the State of Ohio?
Poverty Level Among Males in Ohio is 12.0%.
What is the Poverty Level Among Males in the United States?
Poverty Level Among Males in the United States is 11.3%.