Cities with the Highest Male Poverty Level in Oregon
RELATED REPORTS & OPTIONS
Highest Poverty | Male
Oregon
Compare Cities
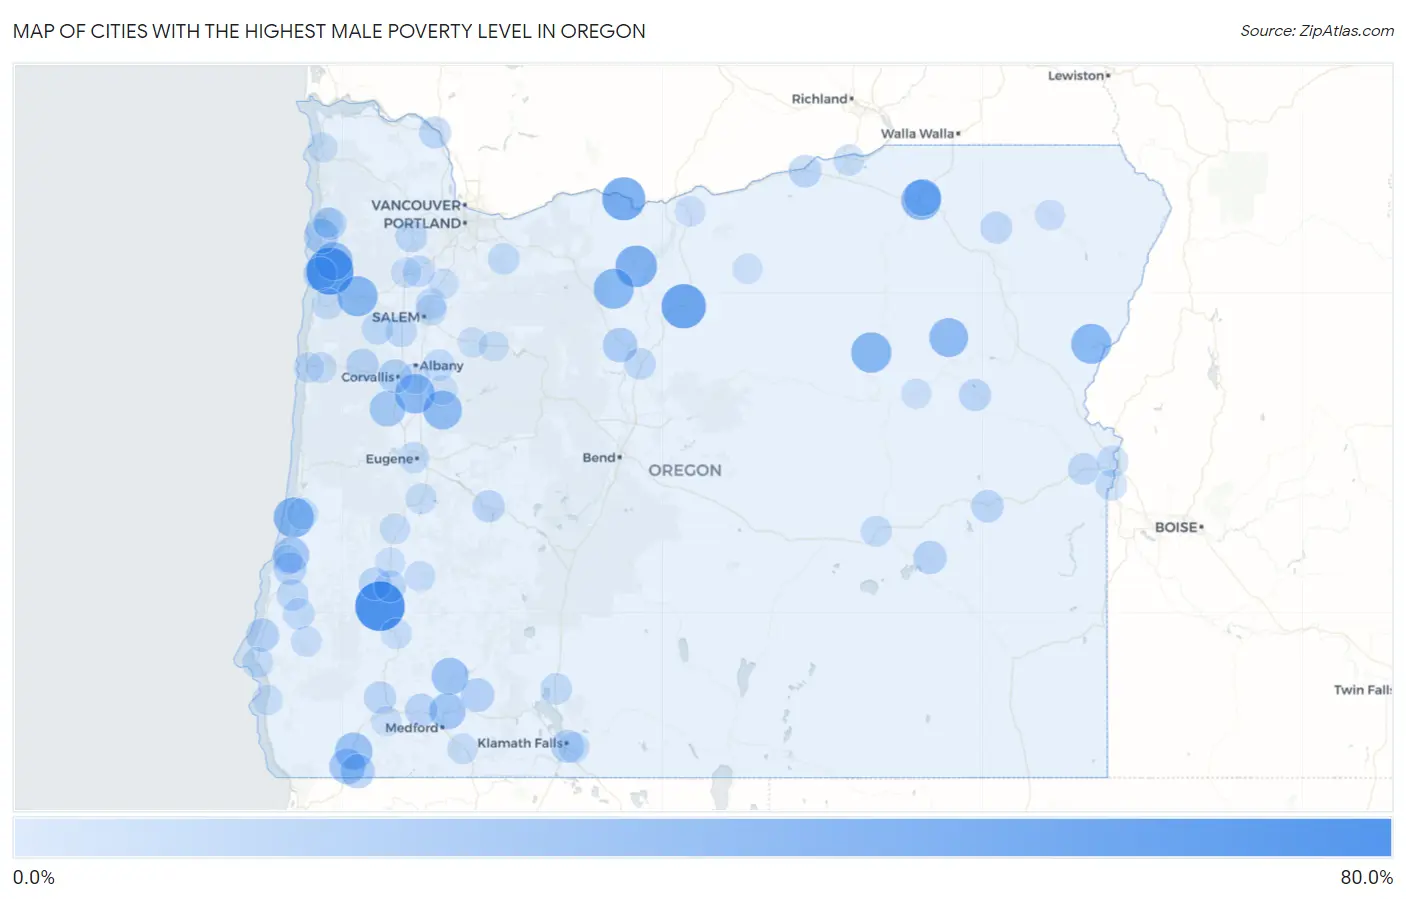
Map of Cities with the Highest Male Poverty Level in Oregon
0.0%
80.0%
Cities with the Highest Male Poverty Level in Oregon
| City | Male Poverty | vs State | vs National | |
| 1. | Dillard | 70.4% | 11.1%(+59.3)#1 | 11.3%(+59.0)#308 |
| 2. | Hebo | 62.7% | 11.1%(+51.6)#2 | 11.3%(+51.4)#426 |
| 3. | Shaniko | 55.6% | 11.1%(+44.5)#3 | 11.3%(+44.2)#645 |
| 4. | Beaver Marsh | 53.4% | 11.1%(+42.3)#4 | 11.3%(+42.1)#717 |
| 5. | Rowena | 51.8% | 11.1%(+40.7)#5 | 11.3%(+40.4)#783 |
| 6. | Meacham | 50.0% | 11.1%(+38.9)#6 | 11.3%(+38.7)#866 |
| 7. | Tygh Valley | 47.6% | 11.1%(+36.5)#7 | 11.3%(+36.3)#1,003 |
| 8. | Trent | 46.9% | 11.1%(+35.8)#8 | 11.3%(+35.6)#1,044 |
| 9. | Long Creek | 43.9% | 11.1%(+32.8)#9 | 11.3%(+32.6)#1,226 |
| 10. | Winchester Bay | 43.6% | 11.1%(+32.5)#10 | 11.3%(+32.2)#1,246 |
| 11. | Grand Ronde | 43.3% | 11.1%(+32.2)#11 | 11.3%(+32.0)#1,267 |
| 12. | Mission | 43.1% | 11.1%(+32.1)#12 | 11.3%(+31.8)#1,284 |
| 13. | Pine Grove | 43.1% | 11.1%(+32.1)#13 | 11.3%(+31.8)#1,286 |
| 14. | Richland | 42.9% | 11.1%(+31.8)#14 | 11.3%(+31.5)#1,305 |
| 15. | Shedd | 41.7% | 11.1%(+30.6)#15 | 11.3%(+30.3)#1,405 |
| 16. | Granite | 40.0% | 11.1%(+28.9)#16 | 11.3%(+28.7)#1,579 |
| 17. | Crawfordsville | 39.7% | 11.1%(+28.6)#17 | 11.3%(+28.3)#1,605 |
| 18. | Beaver | 37.4% | 11.1%(+26.3)#18 | 11.3%(+26.1)#1,862 |
| 19. | Cave Junction | 35.6% | 11.1%(+24.5)#19 | 11.3%(+24.3)#2,073 |
| 20. | Kirkpatrick | 34.5% | 11.1%(+23.4)#20 | 11.3%(+23.2)#2,211 |
| 21. | Trail | 34.4% | 11.1%(+23.3)#21 | 11.3%(+23.1)#2,237 |
| 22. | Marcola | 33.5% | 11.1%(+22.4)#22 | 11.3%(+22.1)#2,358 |
| 23. | White City | 32.4% | 11.1%(+21.3)#23 | 11.3%(+21.1)#2,529 |
| 24. | O Brien | 31.4% | 11.1%(+20.3)#24 | 11.3%(+20.1)#2,715 |
| 25. | Dexter | 31.1% | 11.1%(+20.0)#25 | 11.3%(+19.7)#2,777 |
| 26. | Glasgow | 31.0% | 11.1%(+19.9)#26 | 11.3%(+19.7)#2,781 |
| 27. | Bellfountain | 30.8% | 11.1%(+19.7)#27 | 11.3%(+19.4)#2,836 |
| 28. | Netarts | 27.9% | 11.1%(+16.8)#28 | 11.3%(+16.5)#3,468 |
| 29. | Warm Springs | 27.8% | 11.1%(+16.7)#29 | 11.3%(+16.4)#3,490 |
| 30. | Takilma | 26.9% | 11.1%(+15.9)#30 | 11.3%(+15.6)#3,725 |
| 31. | Corvallis | 26.2% | 11.1%(+15.1)#31 | 11.3%(+14.8)#3,947 |
| 32. | Fort Klamath | 26.1% | 11.1%(+15.0)#32 | 11.3%(+14.7)#3,973 |
| 33. | Rocky Point | 25.6% | 11.1%(+14.5)#33 | 11.3%(+14.2)#4,122 |
| 34. | Mapleton | 25.2% | 11.1%(+14.2)#34 | 11.3%(+13.9)#4,230 |
| 35. | Pacific City | 25.0% | 11.1%(+13.9)#35 | 11.3%(+13.7)#4,308 |
| 36. | Butte Falls | 25.0% | 11.1%(+13.9)#36 | 11.3%(+13.7)#4,318 |
| 37. | Langlois | 24.3% | 11.1%(+13.2)#37 | 11.3%(+13.0)#4,585 |
| 38. | Crane | 24.1% | 11.1%(+13.0)#38 | 11.3%(+12.7)#4,674 |
| 39. | Klamath Falls | 23.6% | 11.1%(+12.5)#39 | 11.3%(+12.2)#4,868 |
| 40. | Bunker Hill | 23.0% | 11.1%(+12.0)#40 | 11.3%(+11.7)#5,060 |
| 41. | Gold Hill | 22.7% | 11.1%(+11.7)#41 | 11.3%(+11.4)#5,200 |
| 42. | Summit | 22.6% | 11.1%(+11.5)#42 | 11.3%(+11.2)#5,279 |
| 43. | Bly | 22.5% | 11.1%(+11.4)#43 | 11.3%(+11.2)#5,312 |
| 44. | Boardman | 22.4% | 11.1%(+11.3)#44 | 11.3%(+11.0)#5,376 |
| 45. | Juntura | 22.2% | 11.1%(+11.1)#45 | 11.3%(+10.9)#5,452 |
| 46. | Melrose | 22.2% | 11.1%(+11.1)#46 | 11.3%(+10.8)#5,467 |
| 47. | Idaville | 22.0% | 11.1%(+10.9)#47 | 11.3%(+10.6)#5,573 |
| 48. | Unity | 21.7% | 11.1%(+10.7)#48 | 11.3%(+10.4)#5,687 |
| 49. | Oakridge | 21.6% | 11.1%(+10.5)#49 | 11.3%(+10.2)#5,759 |
| 50. | Merlin | 21.6% | 11.1%(+10.5)#50 | 11.3%(+10.2)#5,772 |
| 51. | Gaston | 20.9% | 11.1%(+9.78)#51 | 11.3%(+9.53)#6,091 |
| 52. | Rainier | 20.8% | 11.1%(+9.69)#52 | 11.3%(+9.43)#6,141 |
| 53. | Roseburg | 20.7% | 11.1%(+9.62)#53 | 11.3%(+9.37)#6,165 |
| 54. | Summerville | 20.6% | 11.1%(+9.50)#54 | 11.3%(+9.25)#6,229 |
| 55. | Monmouth | 20.3% | 11.1%(+9.24)#55 | 11.3%(+8.98)#6,362 |
| 56. | Dayton | 20.0% | 11.1%(+8.90)#56 | 11.3%(+8.64)#6,547 |
| 57. | Madras | 19.9% | 11.1%(+8.83)#57 | 11.3%(+8.58)#6,567 |
| 58. | Coquille | 19.9% | 11.1%(+8.78)#58 | 11.3%(+8.52)#6,589 |
| 59. | Vale | 19.8% | 11.1%(+8.70)#59 | 11.3%(+8.44)#6,636 |
| 60. | Myrtle Point | 19.8% | 11.1%(+8.70)#60 | 11.3%(+8.44)#6,638 |
| 61. | Chiloquin | 19.7% | 11.1%(+8.59)#61 | 11.3%(+8.33)#6,692 |
| 62. | Falls City | 19.6% | 11.1%(+8.48)#62 | 11.3%(+8.22)#6,766 |
| 63. | Estacada | 19.3% | 11.1%(+8.26)#63 | 11.3%(+8.00)#6,892 |
| 64. | Crabtree | 19.3% | 11.1%(+8.18)#64 | 11.3%(+7.93)#6,925 |
| 65. | Ontario | 19.2% | 11.1%(+8.11)#65 | 11.3%(+7.86)#6,978 |
| 66. | Reedsport | 19.0% | 11.1%(+7.95)#66 | 11.3%(+7.69)#7,053 |
| 67. | Nyssa | 18.9% | 11.1%(+7.85)#67 | 11.3%(+7.60)#7,118 |
| 68. | Rose Lodge | 18.8% | 11.1%(+7.67)#68 | 11.3%(+7.42)#7,231 |
| 69. | Labish Village | 18.8% | 11.1%(+7.67)#69 | 11.3%(+7.41)#7,241 |
| 70. | Burns | 18.6% | 11.1%(+7.51)#70 | 11.3%(+7.25)#7,363 |
| 71. | Eugene | 18.6% | 11.1%(+7.49)#71 | 11.3%(+7.23)#7,372 |
| 72. | Umatilla | 18.5% | 11.1%(+7.46)#72 | 11.3%(+7.20)#7,389 |
| 73. | Hayesville | 18.5% | 11.1%(+7.42)#73 | 11.3%(+7.17)#7,409 |
| 74. | Altamont | 18.4% | 11.1%(+7.32)#74 | 11.3%(+7.06)#7,455 |
| 75. | Port Orford | 18.0% | 11.1%(+6.89)#75 | 11.3%(+6.63)#7,757 |
| 76. | Cottage Grove | 17.6% | 11.1%(+6.51)#76 | 11.3%(+6.25)#8,022 |
| 77. | Toledo | 17.5% | 11.1%(+6.44)#77 | 11.3%(+6.18)#8,068 |
| 78. | Glide | 17.5% | 11.1%(+6.39)#78 | 11.3%(+6.14)#8,099 |
| 79. | Canyonville | 17.5% | 11.1%(+6.38)#79 | 11.3%(+6.12)#8,111 |
| 80. | Powers | 17.3% | 11.1%(+6.25)#80 | 11.3%(+6.00)#8,199 |
| 81. | Ashland | 17.3% | 11.1%(+6.21)#81 | 11.3%(+5.95)#8,230 |
| 82. | Yoncalla | 17.2% | 11.1%(+6.07)#82 | 11.3%(+5.81)#8,323 |
| 83. | Mcminnville | 16.8% | 11.1%(+5.68)#83 | 11.3%(+5.43)#8,571 |
| 84. | Tangent | 16.8% | 11.1%(+5.68)#84 | 11.3%(+5.42)#8,574 |
| 85. | Nesika Beach | 16.7% | 11.1%(+5.66)#85 | 11.3%(+5.41)#8,582 |
| 86. | Wasco | 16.5% | 11.1%(+5.45)#86 | 11.3%(+5.19)#8,744 |
| 87. | Newport | 16.5% | 11.1%(+5.40)#87 | 11.3%(+5.15)#8,770 |
| 88. | New Hope | 16.5% | 11.1%(+5.38)#88 | 11.3%(+5.12)#8,790 |
| 89. | Gilchrist | 16.4% | 11.1%(+5.35)#89 | 11.3%(+5.10)#8,804 |
| 90. | Wallowa | 16.4% | 11.1%(+5.33)#90 | 11.3%(+5.08)#8,818 |
| 91. | Sutherlin | 16.1% | 11.1%(+5.02)#91 | 11.3%(+4.77)#9,041 |
| 92. | Bay City | 16.1% | 11.1%(+4.97)#92 | 11.3%(+4.71)#9,091 |
| 93. | Sodaville | 16.0% | 11.1%(+4.89)#93 | 11.3%(+4.63)#9,145 |
| 94. | Seaside | 16.0% | 11.1%(+4.89)#94 | 11.3%(+4.63)#9,150 |
| 95. | Woodburn | 15.9% | 11.1%(+4.77)#95 | 11.3%(+4.51)#9,230 |
| 96. | North Bend | 15.8% | 11.1%(+4.73)#96 | 11.3%(+4.47)#9,251 |
| 97. | Prairie City | 15.8% | 11.1%(+4.69)#97 | 11.3%(+4.43)#9,288 |
| 98. | Lyons | 15.7% | 11.1%(+4.65)#98 | 11.3%(+4.39)#9,318 |
| 99. | Gates | 15.7% | 11.1%(+4.63)#99 | 11.3%(+4.37)#9,333 |
| 100. | Condon | 15.7% | 11.1%(+4.59)#100 | 11.3%(+4.33)#9,376 |
Common Questions
What are the Top 10 Cities with the Highest Male Poverty Level in Oregon?
Top 10 Cities with the Highest Male Poverty Level in Oregon are:
#1
70.4%
#2
62.7%
#3
55.6%
#4
51.8%
#5
47.6%
#6
43.9%
#7
43.6%
#8
43.3%
#9
43.1%
#10
43.1%
What city has the Highest Male Poverty Level in Oregon?
Dillard has the Highest Male Poverty Level in Oregon with 70.4%.
What is the Poverty Level Among Males in the State of Oregon?
Poverty Level Among Males in Oregon is 11.1%.
What is the Poverty Level Among Males in the United States?
Poverty Level Among Males in the United States is 11.3%.