Cities with the Highest Male Poverty Level in Kansas
RELATED REPORTS & OPTIONS
Highest Poverty | Male
Kansas
Compare Cities
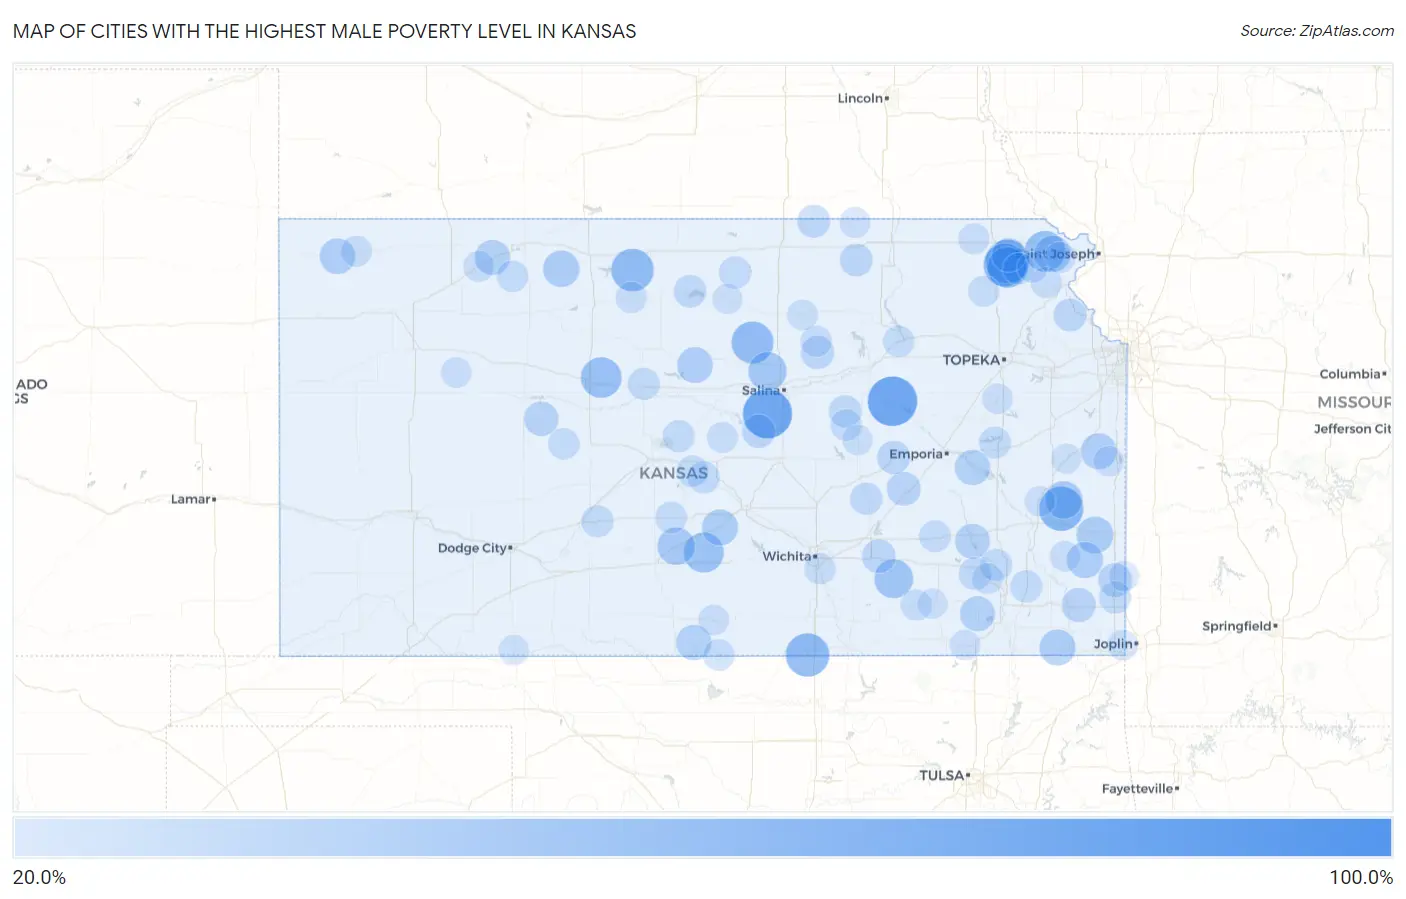
Map of Cities with the Highest Male Poverty Level in Kansas
0.0%
100.0%
Cities with the Highest Male Poverty Level in Kansas
| City | Male Poverty | vs State | vs National | |
| 1. | Silverdale | 100.0% | 10.4%(+89.6)#1 | 11.3%(+88.7)#76 |
| 2. | Beaver | 100.0% | 10.4%(+89.6)#2 | 11.3%(+88.7)#98 |
| 3. | Parkerville | 78.1% | 10.4%(+67.7)#3 | 11.3%(+66.8)#210 |
| 4. | Falun | 77.2% | 10.4%(+66.8)#4 | 11.3%(+65.9)#221 |
| 5. | Murdock | 71.4% | 10.4%(+61.0)#5 | 11.3%(+60.1)#289 |
| 6. | Neal | 66.7% | 10.4%(+56.3)#6 | 11.3%(+55.3)#365 |
| 7. | Mildred | 62.5% | 10.4%(+52.1)#7 | 11.3%(+51.2)#437 |
| 8. | Hunnewell | 60.0% | 10.4%(+49.6)#8 | 11.3%(+48.7)#501 |
| 9. | Kickapoo Site 1 | 59.6% | 10.4%(+49.2)#9 | 11.3%(+48.2)#517 |
| 10. | Kickapoo Site 7 | 58.6% | 10.4%(+48.2)#10 | 11.3%(+47.3)#549 |
| 11. | Cedar | 57.1% | 10.4%(+46.8)#11 | 11.3%(+45.8)#584 |
| 12. | Ada | 55.6% | 10.4%(+45.2)#12 | 11.3%(+44.2)#642 |
| 13. | Centropolis | 53.3% | 10.4%(+42.9)#13 | 11.3%(+42.0)#721 |
| 14. | Kickapoo Tribal Center | 51.9% | 10.4%(+41.5)#14 | 11.3%(+40.6)#774 |
| 15. | Leona | 51.9% | 10.4%(+41.5)#15 | 11.3%(+40.5)#777 |
| 16. | Catharine | 51.7% | 10.4%(+41.3)#16 | 11.3%(+40.4)#788 |
| 17. | Penalosa | 50.0% | 10.4%(+39.6)#17 | 11.3%(+38.7)#889 |
| 18. | Latham | 46.4% | 10.4%(+36.0)#18 | 11.3%(+35.0)#1,081 |
| 19. | Culver | 44.7% | 10.4%(+34.3)#19 | 11.3%(+33.4)#1,169 |
| 20. | Preston | 42.5% | 10.4%(+32.1)#20 | 11.3%(+31.2)#1,337 |
| 21. | Kincaid | 42.1% | 10.4%(+31.7)#21 | 11.3%(+30.8)#1,369 |
| 22. | Redfield | 40.0% | 10.4%(+29.6)#22 | 11.3%(+28.7)#1,573 |
| 23. | Logan | 39.4% | 10.4%(+29.0)#23 | 11.3%(+28.0)#1,633 |
| 24. | Severance | 39.3% | 10.4%(+28.9)#24 | 11.3%(+27.9)#1,641 |
| 25. | Hepler | 38.5% | 10.4%(+28.1)#25 | 11.3%(+27.1)#1,742 |
| 26. | Arlington | 38.1% | 10.4%(+27.7)#26 | 11.3%(+26.8)#1,777 |
| 27. | Bartlett | 37.8% | 10.4%(+27.4)#27 | 11.3%(+26.4)#1,810 |
| 28. | Fontana | 37.5% | 10.4%(+27.1)#28 | 11.3%(+26.2)#1,839 |
| 29. | Sylvan Grove | 37.4% | 10.4%(+27.0)#29 | 11.3%(+26.1)#1,861 |
| 30. | Bird City | 37.0% | 10.4%(+26.6)#30 | 11.3%(+25.6)#1,911 |
| 31. | Hazelton | 36.2% | 10.4%(+25.8)#31 | 11.3%(+24.9)#2,002 |
| 32. | Hartford | 36.2% | 10.4%(+25.8)#32 | 11.3%(+24.9)#2,004 |
| 33. | Clayton | 35.7% | 10.4%(+25.3)#33 | 11.3%(+24.4)#2,062 |
| 34. | Elk City | 35.4% | 10.4%(+25.0)#34 | 11.3%(+24.1)#2,093 |
| 35. | Toronto | 34.9% | 10.4%(+24.5)#35 | 11.3%(+23.6)#2,159 |
| 36. | Brownell | 33.3% | 10.4%(+22.9)#36 | 11.3%(+22.0)#2,402 |
| 37. | Mccune | 32.3% | 10.4%(+21.9)#37 | 11.3%(+20.9)#2,556 |
| 38. | Powhattan | 31.9% | 10.4%(+21.5)#38 | 11.3%(+20.6)#2,620 |
| 39. | Franklin | 31.8% | 10.4%(+21.4)#39 | 11.3%(+20.5)#2,635 |
| 40. | Matfield Green | 31.8% | 10.4%(+21.4)#40 | 11.3%(+20.5)#2,643 |
| 41. | Leon | 30.9% | 10.4%(+20.5)#41 | 11.3%(+19.5)#2,814 |
| 42. | Marquette | 30.4% | 10.4%(+20.0)#42 | 11.3%(+19.0)#2,895 |
| 43. | Manchester | 30.3% | 10.4%(+19.9)#43 | 11.3%(+19.0)#2,913 |
| 44. | Elmdale | 30.0% | 10.4%(+19.6)#44 | 11.3%(+18.7)#2,989 |
| 45. | Easton | 29.0% | 10.4%(+18.6)#45 | 11.3%(+17.7)#3,193 |
| 46. | Greenleaf | 28.8% | 10.4%(+18.4)#46 | 11.3%(+17.4)#3,255 |
| 47. | Mahaska | 28.6% | 10.4%(+18.2)#47 | 11.3%(+17.2)#3,317 |
| 48. | New Albany | 28.1% | 10.4%(+17.7)#48 | 11.3%(+16.8)#3,412 |
| 49. | Cawker City | 28.1% | 10.4%(+17.7)#49 | 11.3%(+16.8)#3,417 |
| 50. | Burns | 27.7% | 10.4%(+17.4)#50 | 11.3%(+16.4)#3,504 |
| 51. | Hope | 27.5% | 10.4%(+17.1)#51 | 11.3%(+16.1)#3,576 |
| 52. | Thayer | 27.1% | 10.4%(+16.8)#52 | 11.3%(+15.8)#3,665 |
| 53. | Randall | 27.1% | 10.4%(+16.8)#53 | 11.3%(+15.8)#3,667 |
| 54. | Pittsburg | 27.0% | 10.4%(+16.7)#54 | 11.3%(+15.7)#3,683 |
| 55. | Lewis | 27.0% | 10.4%(+16.6)#55 | 11.3%(+15.7)#3,692 |
| 56. | Claflin | 26.9% | 10.4%(+16.5)#56 | 11.3%(+15.5)#3,735 |
| 57. | Russell | 26.9% | 10.4%(+16.5)#57 | 11.3%(+15.5)#3,738 |
| 58. | Navarre | 26.7% | 10.4%(+16.4)#58 | 11.3%(+15.4)#3,774 |
| 59. | Benedict | 26.7% | 10.4%(+16.3)#59 | 11.3%(+15.3)#3,793 |
| 60. | Alden | 26.3% | 10.4%(+15.9)#60 | 11.3%(+15.0)#3,890 |
| 61. | Olivet | 26.2% | 10.4%(+15.8)#61 | 11.3%(+14.8)#3,939 |
| 62. | Stafford | 25.9% | 10.4%(+15.5)#62 | 11.3%(+14.5)#4,037 |
| 63. | Raymond | 25.8% | 10.4%(+15.4)#63 | 11.3%(+14.5)#4,052 |
| 64. | Eureka | 25.8% | 10.4%(+15.4)#64 | 11.3%(+14.4)#4,062 |
| 65. | Horton | 25.3% | 10.4%(+14.9)#65 | 11.3%(+13.9)#4,222 |
| 66. | Lenora | 25.2% | 10.4%(+14.8)#66 | 11.3%(+13.9)#4,234 |
| 67. | Manhattan | 25.0% | 10.4%(+14.6)#67 | 11.3%(+13.7)#4,300 |
| 68. | Ramona | 25.0% | 10.4%(+14.6)#68 | 11.3%(+13.7)#4,340 |
| 69. | Hallowell | 25.0% | 10.4%(+14.6)#69 | 11.3%(+13.7)#4,347 |
| 70. | Alexander | 25.0% | 10.4%(+14.6)#70 | 11.3%(+13.7)#4,352 |
| 71. | Waldron | 25.0% | 10.4%(+14.6)#71 | 11.3%(+13.7)#4,362 |
| 72. | Oaklawn Sunview | 24.6% | 10.4%(+14.2)#72 | 11.3%(+13.2)#4,494 |
| 73. | Circleville | 24.3% | 10.4%(+13.9)#73 | 11.3%(+13.0)#4,576 |
| 74. | Lancaster | 24.3% | 10.4%(+13.9)#74 | 11.3%(+12.9)#4,594 |
| 75. | Alton | 24.1% | 10.4%(+13.7)#75 | 11.3%(+12.8)#4,641 |
| 76. | Longford | 24.1% | 10.4%(+13.7)#76 | 11.3%(+12.8)#4,644 |
| 77. | Mcdonald | 24.1% | 10.4%(+13.7)#77 | 11.3%(+12.8)#4,652 |
| 78. | Grenola | 23.9% | 10.4%(+13.6)#78 | 11.3%(+12.6)#4,717 |
| 79. | Oneida | 23.8% | 10.4%(+13.4)#79 | 11.3%(+12.5)#4,768 |
| 80. | Fredonia | 23.7% | 10.4%(+13.3)#80 | 11.3%(+12.4)#4,805 |
| 81. | Jennings | 23.4% | 10.4%(+13.0)#81 | 11.3%(+12.1)#4,930 |
| 82. | Geneseo | 23.4% | 10.4%(+13.0)#82 | 11.3%(+12.0)#4,945 |
| 83. | Bendena | 23.3% | 10.4%(+12.9)#83 | 11.3%(+11.9)#4,982 |
| 84. | Hollenberg | 23.1% | 10.4%(+12.7)#84 | 11.3%(+11.7)#5,050 |
| 85. | Miltonvale | 22.9% | 10.4%(+12.5)#85 | 11.3%(+11.5)#5,136 |
| 86. | Gove City | 22.8% | 10.4%(+12.4)#86 | 11.3%(+11.5)#5,172 |
| 87. | Scranton | 22.7% | 10.4%(+12.3)#87 | 11.3%(+11.4)#5,197 |
| 88. | Attica | 22.7% | 10.4%(+12.3)#88 | 11.3%(+11.3)#5,231 |
| 89. | La Cygne | 22.2% | 10.4%(+11.8)#89 | 11.3%(+10.9)#5,420 |
| 90. | Stark | 22.2% | 10.4%(+11.8)#90 | 11.3%(+10.9)#5,444 |
| 91. | Everest | 22.1% | 10.4%(+11.8)#91 | 11.3%(+10.8)#5,481 |
| 92. | Lincolnville | 22.1% | 10.4%(+11.7)#92 | 11.3%(+10.8)#5,495 |
| 93. | Niotaze | 22.1% | 10.4%(+11.7)#93 | 11.3%(+10.8)#5,504 |
| 94. | Galena | 22.1% | 10.4%(+11.7)#94 | 11.3%(+10.8)#5,505 |
| 95. | Colony | 22.1% | 10.4%(+11.7)#95 | 11.3%(+10.7)#5,527 |
| 96. | Greeley | 21.9% | 10.4%(+11.5)#96 | 11.3%(+10.5)#5,620 |
| 97. | Englewood | 21.7% | 10.4%(+11.3)#97 | 11.3%(+10.4)#5,685 |
| 98. | Mulberry | 21.5% | 10.4%(+11.1)#98 | 11.3%(+10.1)#5,802 |
| 99. | Beloit | 21.4% | 10.4%(+11.0)#99 | 11.3%(+10.0)#5,844 |
| 100. | Moline | 21.4% | 10.4%(+11.0)#100 | 11.3%(+10.0)#5,864 |
Common Questions
What are the Top 10 Cities with the Highest Male Poverty Level in Kansas?
Top 10 Cities with the Highest Male Poverty Level in Kansas are:
#1
78.1%
#2
77.2%
#3
62.5%
#4
60.0%
#5
59.6%
#6
58.6%
#7
57.1%
#8
55.6%
#9
51.9%
#10
51.9%
What city has the Highest Male Poverty Level in Kansas?
Parkerville has the Highest Male Poverty Level in Kansas with 78.1%.
What is the Poverty Level Among Males in the State of Kansas?
Poverty Level Among Males in Kansas is 10.4%.
What is the Poverty Level Among Males in the United States?
Poverty Level Among Males in the United States is 11.3%.