Cities with the Highest Male Poverty Level in South Dakota
RELATED REPORTS & OPTIONS
Highest Poverty | Male
South Dakota
Compare Cities
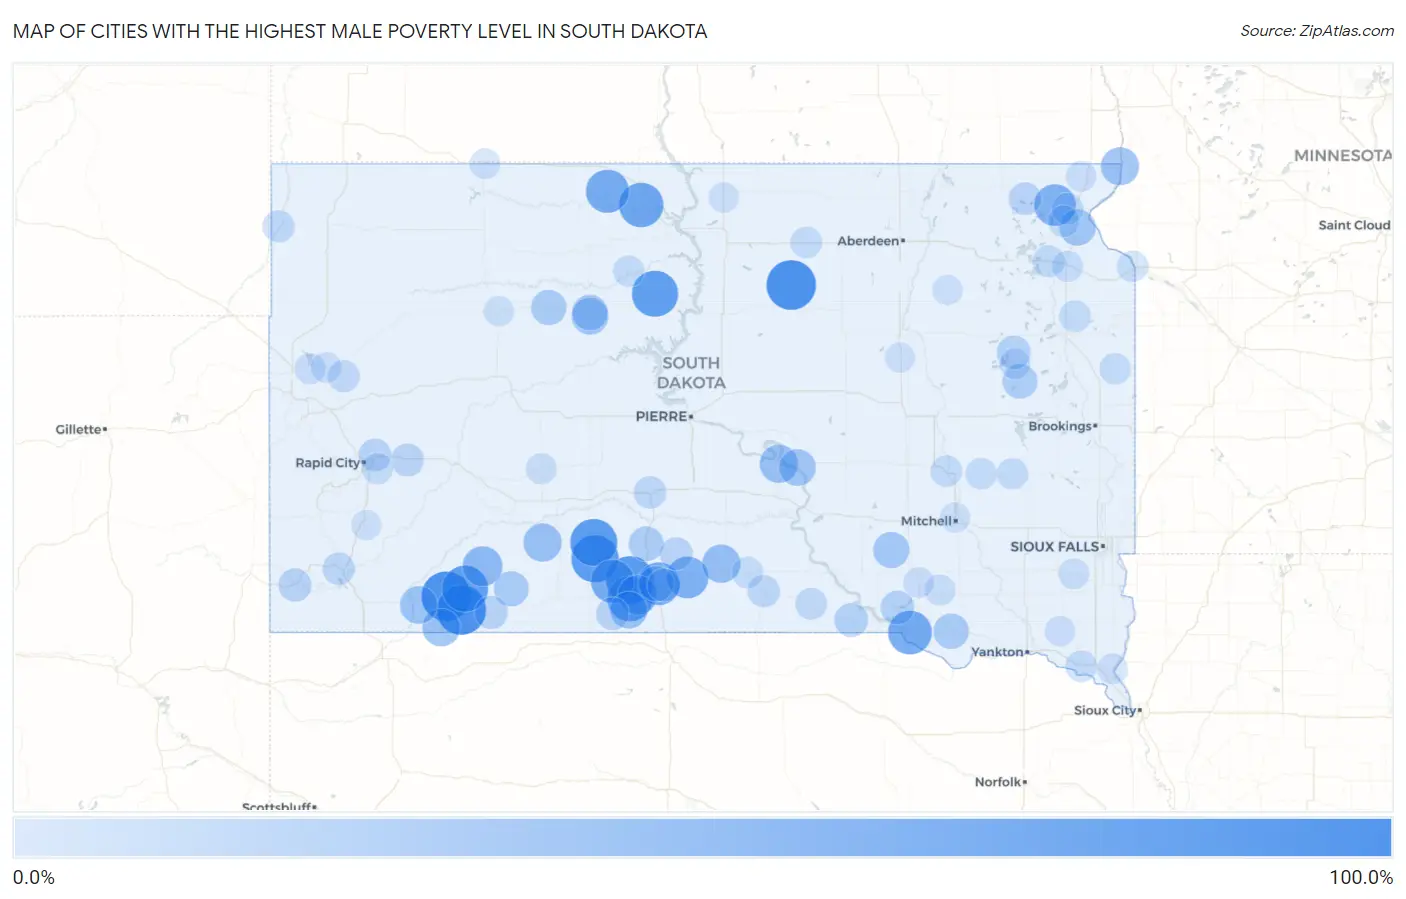
Map of Cities with the Highest Male Poverty Level in South Dakota
0.0%
100.0%
Cities with the Highest Male Poverty Level in South Dakota
| City | Male Poverty | vs State | vs National | |
| 1. | Manderson White Horse Creek | 100.0% | 11.0%(+89.0)#1 | 11.3%(+88.7)#5 |
| 2. | Wounded Knee | 100.0% | 11.0%(+89.0)#2 | 11.3%(+88.7)#9 |
| 3. | Swift Bird | 100.0% | 11.0%(+89.0)#3 | 11.3%(+88.7)#19 |
| 4. | Brentwood Colony | 100.0% | 11.0%(+89.0)#4 | 11.3%(+88.7)#50 |
| 5. | Mayfield Colony | 100.0% | 11.0%(+89.0)#5 | 11.3%(+88.7)#58 |
| 6. | Ideal | 100.0% | 11.0%(+89.0)#6 | 11.3%(+88.7)#60 |
| 7. | Onaka | 100.0% | 11.0%(+89.0)#7 | 11.3%(+88.7)#92 |
| 8. | Soldier Creek | 92.2% | 11.0%(+81.2)#8 | 11.3%(+80.9)#134 |
| 9. | Bridger | 90.3% | 11.0%(+79.3)#9 | 11.3%(+79.0)#142 |
| 10. | Norris | 90.1% | 11.0%(+79.1)#10 | 11.3%(+78.8)#143 |
| 11. | Corn Creek | 89.1% | 11.0%(+78.2)#11 | 11.3%(+77.8)#150 |
| 12. | Horse Creek | 86.8% | 11.0%(+75.8)#12 | 11.3%(+75.5)#161 |
| 13. | Porcupine | 85.9% | 11.0%(+74.9)#13 | 11.3%(+74.6)#165 |
| 14. | La Plant | 85.6% | 11.0%(+74.7)#14 | 11.3%(+74.3)#168 |
| 15. | Two Strike | 81.2% | 11.0%(+70.2)#15 | 11.3%(+69.8)#193 |
| 16. | Wakpala | 78.1% | 11.0%(+67.2)#16 | 11.3%(+66.8)#209 |
| 17. | Little Eagle | 77.7% | 11.0%(+66.7)#17 | 11.3%(+66.4)#214 |
| 18. | Enemy Swim | 75.0% | 11.0%(+64.0)#18 | 11.3%(+63.7)#243 |
| 19. | Marty | 74.7% | 11.0%(+63.7)#19 | 11.3%(+63.3)#252 |
| 20. | Parmelee | 72.7% | 11.0%(+61.7)#20 | 11.3%(+61.4)#278 |
| 21. | Bullhead | 72.4% | 11.0%(+61.4)#21 | 11.3%(+61.0)#280 |
| 22. | Antelope | 70.9% | 11.0%(+59.9)#22 | 11.3%(+59.6)#296 |
| 23. | Peever Flats | 69.4% | 11.0%(+58.4)#23 | 11.3%(+58.0)#328 |
| 24. | Okreek | 66.7% | 11.0%(+55.7)#24 | 11.3%(+55.3)#360 |
| 25. | Long Hollow | 65.6% | 11.0%(+54.7)#25 | 11.3%(+54.3)#380 |
| 26. | Clark Colony | 60.0% | 11.0%(+49.0)#26 | 11.3%(+48.7)#503 |
| 27. | Kyle | 58.1% | 11.0%(+47.1)#27 | 11.3%(+46.8)#565 |
| 28. | Rosebud | 57.0% | 11.0%(+46.0)#28 | 11.3%(+45.6)#587 |
| 29. | Sicangu | 55.4% | 11.0%(+44.4)#29 | 11.3%(+44.1)#649 |
| 30. | New Witten | 51.4% | 11.0%(+40.4)#30 | 11.3%(+40.0)#799 |
| 31. | West Brule | 50.9% | 11.0%(+39.9)#31 | 11.3%(+39.6)#826 |
| 32. | Lower Brule | 50.7% | 11.0%(+39.7)#32 | 11.3%(+39.3)#837 |
| 33. | Wanblee | 50.6% | 11.0%(+39.7)#33 | 11.3%(+39.3)#840 |
| 34. | White Rock | 50.0% | 11.0%(+39.0)#34 | 11.3%(+38.7)#888 |
| 35. | Pine Ridge | 49.1% | 11.0%(+38.1)#35 | 11.3%(+37.8)#922 |
| 36. | Oglala | 48.5% | 11.0%(+37.5)#36 | 11.3%(+37.2)#951 |
| 37. | St Francis | 46.1% | 11.0%(+35.1)#37 | 11.3%(+34.7)#1,100 |
| 38. | Eagle Butte | 44.6% | 11.0%(+33.6)#38 | 11.3%(+33.3)#1,179 |
| 39. | Fort Thompson | 44.6% | 11.0%(+33.6)#39 | 11.3%(+33.3)#1,180 |
| 40. | Peever | 43.5% | 11.0%(+32.6)#40 | 11.3%(+32.2)#1,251 |
| 41. | Aurora Center | 42.1% | 11.0%(+31.1)#41 | 11.3%(+30.8)#1,370 |
| 42. | North Eagle Butte | 40.0% | 11.0%(+29.0)#42 | 11.3%(+28.6)#1,581 |
| 43. | Mission | 39.2% | 11.0%(+28.2)#43 | 11.3%(+27.8)#1,650 |
| 44. | Avon | 38.9% | 11.0%(+27.9)#44 | 11.3%(+27.6)#1,681 |
| 45. | Dupree | 38.6% | 11.0%(+27.7)#45 | 11.3%(+27.3)#1,720 |
| 46. | Golden View Colony | 37.8% | 11.0%(+26.9)#46 | 11.3%(+26.5)#1,800 |
| 47. | Allen | 37.8% | 11.0%(+26.8)#47 | 11.3%(+26.4)#1,812 |
| 48. | Cherry Creek | 37.8% | 11.0%(+26.8)#48 | 11.3%(+26.4)#1,814 |
| 49. | White River | 36.9% | 11.0%(+25.9)#49 | 11.3%(+25.6)#1,919 |
| 50. | Bryant | 36.9% | 11.0%(+25.9)#50 | 11.3%(+25.5)#1,921 |
| 51. | Spring Creek Colony | 34.2% | 11.0%(+23.2)#51 | 11.3%(+22.9)#2,260 |
| 52. | Naples | 32.4% | 11.0%(+21.4)#52 | 11.3%(+21.0)#2,542 |
| 53. | Bonesteel | 32.3% | 11.0%(+21.3)#53 | 11.3%(+21.0)#2,550 |
| 54. | Lake Andes | 32.2% | 11.0%(+21.3)#54 | 11.3%(+20.9)#2,565 |
| 55. | Batesland | 30.2% | 11.0%(+19.2)#55 | 11.3%(+18.8)#2,938 |
| 56. | Edgemont | 29.6% | 11.0%(+18.6)#56 | 11.3%(+18.2)#3,071 |
| 57. | New Underwood | 28.9% | 11.0%(+18.0)#57 | 11.3%(+17.6)#3,214 |
| 58. | White Horse | 28.8% | 11.0%(+17.9)#58 | 11.3%(+17.5)#3,243 |
| 59. | Spring Creek | 28.7% | 11.0%(+17.7)#59 | 11.3%(+17.3)#3,280 |
| 60. | Wood | 28.6% | 11.0%(+17.6)#60 | 11.3%(+17.2)#3,316 |
| 61. | Ashland Heights | 28.2% | 11.0%(+17.2)#61 | 11.3%(+16.9)#3,394 |
| 62. | Lake City | 28.1% | 11.0%(+17.2)#62 | 11.3%(+16.8)#3,413 |
| 63. | Murdo | 27.0% | 11.0%(+16.0)#63 | 11.3%(+15.6)#3,718 |
| 64. | Hot Springs | 26.7% | 11.0%(+15.7)#64 | 11.3%(+15.3)#3,785 |
| 65. | Colome | 26.1% | 11.0%(+15.1)#65 | 11.3%(+14.8)#3,960 |
| 66. | Vale | 25.0% | 11.0%(+14.0)#66 | 11.3%(+13.7)#4,339 |
| 67. | Ortley | 25.0% | 11.0%(+14.0)#67 | 11.3%(+13.7)#4,350 |
| 68. | Camp Crook | 25.0% | 11.0%(+14.0)#68 | 11.3%(+13.7)#4,354 |
| 69. | Burke | 24.3% | 11.0%(+13.4)#69 | 11.3%(+13.0)#4,571 |
| 70. | Sisseton | 24.0% | 11.0%(+13.0)#70 | 11.3%(+12.6)#4,699 |
| 71. | Waverly | 23.8% | 11.0%(+12.8)#71 | 11.3%(+12.5)#4,777 |
| 72. | Forestburg | 23.3% | 11.0%(+12.4)#72 | 11.3%(+12.0)#4,962 |
| 73. | Vermillion | 23.2% | 11.0%(+12.2)#73 | 11.3%(+11.9)#5,018 |
| 74. | Agency Village | 23.2% | 11.0%(+12.2)#74 | 11.3%(+11.8)#5,021 |
| 75. | Roscoe | 22.7% | 11.0%(+11.7)#75 | 11.3%(+11.4)#5,226 |
| 76. | Brandt | 22.6% | 11.0%(+11.6)#76 | 11.3%(+11.2)#5,283 |
| 77. | Howard | 22.5% | 11.0%(+11.5)#77 | 11.3%(+11.2)#5,302 |
| 78. | Winner | 22.4% | 11.0%(+11.4)#78 | 11.3%(+11.1)#5,345 |
| 79. | Whitehorse | 22.4% | 11.0%(+11.4)#79 | 11.3%(+11.0)#5,369 |
| 80. | Fedora | 22.2% | 11.0%(+11.2)#80 | 11.3%(+10.9)#5,453 |
| 81. | Big Stone City | 22.0% | 11.0%(+11.1)#81 | 11.3%(+10.7)#5,532 |
| 82. | Green Valley | 21.6% | 11.0%(+10.6)#82 | 11.3%(+10.2)#5,763 |
| 83. | Summit | 21.4% | 11.0%(+10.4)#83 | 11.3%(+10.0)#5,841 |
| 84. | Fruitdale | 20.8% | 11.0%(+9.81)#84 | 11.3%(+9.44)#6,140 |
| 85. | Philip | 20.7% | 11.0%(+9.68)#85 | 11.3%(+9.31)#6,193 |
| 86. | Chancellor | 20.6% | 11.0%(+9.61)#86 | 11.3%(+9.25)#6,224 |
| 87. | Delmont | 20.6% | 11.0%(+9.61)#87 | 11.3%(+9.25)#6,226 |
| 88. | Vienna | 20.0% | 11.0%(+9.03)#88 | 11.3%(+8.66)#6,524 |
| 89. | Nisland | 19.6% | 11.0%(+8.65)#89 | 11.3%(+8.28)#6,723 |
| 90. | Armour | 19.6% | 11.0%(+8.64)#90 | 11.3%(+8.27)#6,731 |
| 91. | New Effington | 19.5% | 11.0%(+8.57)#91 | 11.3%(+8.20)#6,776 |
| 92. | Lemmon | 19.5% | 11.0%(+8.48)#92 | 11.3%(+8.11)#6,824 |
| 93. | Richland | 19.0% | 11.0%(+8.03)#93 | 11.3%(+7.66)#7,072 |
| 94. | Wakonda | 18.6% | 11.0%(+7.62)#94 | 11.3%(+7.25)#7,361 |
| 95. | Faith | 18.4% | 11.0%(+7.39)#95 | 11.3%(+7.03)#7,479 |
| 96. | Mitchell | 18.1% | 11.0%(+7.14)#96 | 11.3%(+6.77)#7,655 |
| 97. | Conde | 18.0% | 11.0%(+7.03)#97 | 11.3%(+6.66)#7,738 |
| 98. | Mound City | 18.0% | 11.0%(+7.03)#98 | 11.3%(+6.66)#7,740 |
| 99. | Tulare | 17.9% | 11.0%(+6.97)#99 | 11.3%(+6.61)#7,774 |
| 100. | Fairburn | 17.6% | 11.0%(+6.67)#100 | 11.3%(+6.31)#7,996 |
Common Questions
What are the Top 10 Cities with the Highest Male Poverty Level in South Dakota?
Top 10 Cities with the Highest Male Poverty Level in South Dakota are:
#1
100.0%
#2
100.0%
#3
100.0%
#4
92.2%
#5
90.1%
#6
89.1%
#7
85.9%
#8
85.6%
#9
81.2%
#10
77.7%
What city has the Highest Male Poverty Level in South Dakota?
Manderson White Horse Creek has the Highest Male Poverty Level in South Dakota with 100.0%.
What is the Poverty Level Among Males in the State of South Dakota?
Poverty Level Among Males in South Dakota is 11.0%.
What is the Poverty Level Among Males in the United States?
Poverty Level Among Males in the United States is 11.3%.