Cities with the Highest Male Poverty Level in Connecticut
RELATED REPORTS & OPTIONS
Highest Poverty | Male
Connecticut
Compare Cities
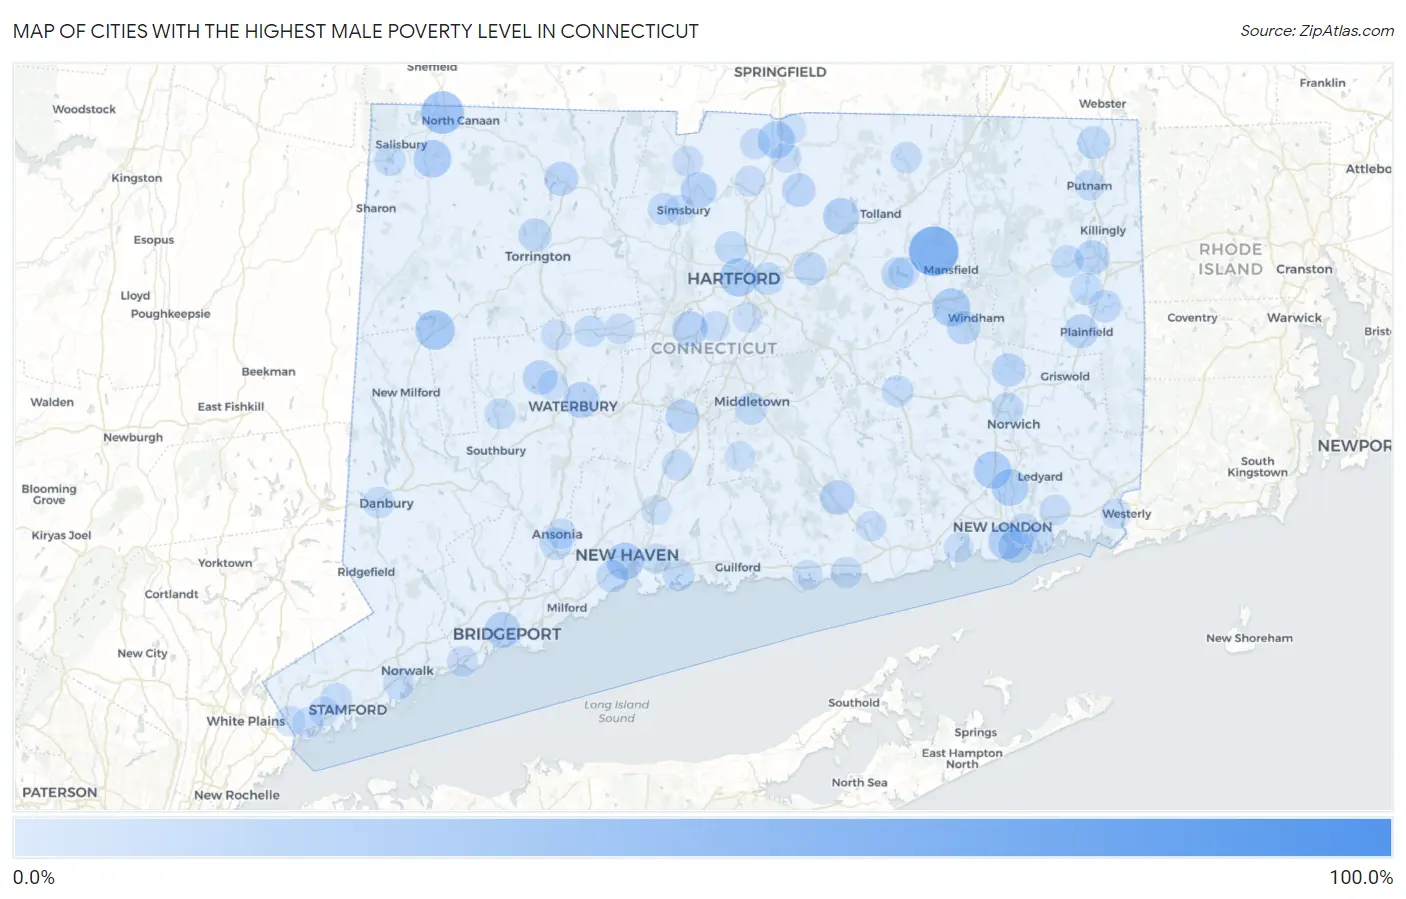
Map of Cities with the Highest Male Poverty Level in Connecticut
0.0%
100.0%
Cities with the Highest Male Poverty Level in Connecticut
| City | Male Poverty | vs State | vs National | |
| 1. | Fairfield University | 100.0% | 9.1%(+90.9)#1 | 11.3%(+88.7)#2 |
| 2. | Storrs | 55.5% | 9.1%(+46.4)#2 | 11.3%(+44.2)#647 |
| 3. | Taylor Corners | 38.7% | 9.1%(+29.6)#3 | 11.3%(+27.4)#1,710 |
| 4. | Canaan | 37.8% | 9.1%(+28.7)#4 | 11.3%(+26.5)#1,804 |
| 5. | Pleasant Valley | 36.0% | 9.1%(+26.9)#5 | 11.3%(+24.7)#2,022 |
| 6. | New Preston | 29.6% | 9.1%(+20.5)#6 | 11.3%(+18.3)#3,054 |
| 7. | Hartford | 26.3% | 9.1%(+17.2)#7 | 11.3%(+15.0)#3,895 |
| 8. | Willimantic | 25.8% | 9.1%(+16.6)#8 | 11.3%(+14.4)#4,064 |
| 9. | Falls Village | 24.6% | 9.1%(+15.4)#9 | 11.3%(+13.2)#4,489 |
| 10. | Oxoboxo River | 23.9% | 9.1%(+14.8)#10 | 11.3%(+12.6)#4,714 |
| 11. | New Haven | 23.8% | 9.1%(+14.7)#11 | 11.3%(+12.5)#4,763 |
| 12. | West Cornwall | 23.8% | 9.1%(+14.7)#12 | 11.3%(+12.5)#4,776 |
| 13. | Thompsonville | 23.6% | 9.1%(+14.5)#13 | 11.3%(+12.3)#4,856 |
| 14. | Gales Ferry | 22.6% | 9.1%(+13.5)#14 | 11.3%(+11.3)#5,256 |
| 15. | Rockville | 21.6% | 9.1%(+12.5)#15 | 11.3%(+10.3)#5,737 |
| 16. | New London | 21.4% | 9.1%(+12.3)#16 | 11.3%(+10.1)#5,832 |
| 17. | Tariffville | 20.4% | 9.1%(+11.3)#17 | 11.3%(+9.10)#6,304 |
| 18. | Bridgeport | 20.4% | 9.1%(+11.3)#18 | 11.3%(+9.09)#6,305 |
| 19. | Waterbury | 20.4% | 9.1%(+11.3)#19 | 11.3%(+9.07)#6,315 |
| 20. | New Britain | 18.9% | 9.1%(+9.80)#20 | 11.3%(+7.60)#7,113 |
| 21. | Topstone | 18.8% | 9.1%(+9.68)#21 | 11.3%(+7.48)#7,194 |
| 22. | Danielson Borough | 18.6% | 9.1%(+9.46)#22 | 11.3%(+7.26)#7,356 |
| 23. | Chester Center | 17.7% | 9.1%(+8.57)#23 | 11.3%(+6.37)#7,947 |
| 24. | Watertown | 17.0% | 9.1%(+7.90)#24 | 11.3%(+5.70)#8,398 |
| 25. | East Brooklyn | 16.8% | 9.1%(+7.67)#25 | 11.3%(+5.47)#8,539 |
| 26. | Jewett City Borough | 16.5% | 9.1%(+7.39)#26 | 11.3%(+5.19)#8,746 |
| 27. | Plainfield Village | 15.9% | 9.1%(+6.75)#27 | 11.3%(+4.55)#9,207 |
| 28. | Winsted | 15.8% | 9.1%(+6.65)#28 | 11.3%(+4.45)#9,262 |
| 29. | Groton | 15.3% | 9.1%(+6.15)#29 | 11.3%(+3.95)#9,691 |
| 30. | Baltic | 15.0% | 9.1%(+5.84)#30 | 11.3%(+3.64)#9,911 |
| 31. | South Windham | 14.5% | 9.1%(+5.40)#31 | 11.3%(+3.20)#10,284 |
| 32. | Meriden | 14.5% | 9.1%(+5.35)#32 | 11.3%(+3.15)#10,322 |
| 33. | Broad Brook | 14.4% | 9.1%(+5.31)#33 | 11.3%(+3.11)#10,355 |
| 34. | Torrington | 13.9% | 9.1%(+4.72)#34 | 11.3%(+2.52)#10,880 |
| 35. | Groton Long Point Borough | 13.7% | 9.1%(+4.58)#35 | 11.3%(+2.38)#10,995 |
| 36. | Manchester | 13.4% | 9.1%(+4.31)#36 | 11.3%(+2.11)#11,257 |
| 37. | Redding Center | 13.2% | 9.1%(+4.07)#37 | 11.3%(+1.87)#11,494 |
| 38. | North Grosvenor Dale | 13.0% | 9.1%(+3.81)#38 | 11.3%(+1.61)#11,755 |
| 39. | Moosup | 12.2% | 9.1%(+3.06)#39 | 11.3%(+0.858)#12,500 |
| 40. | Blue Hills | 12.1% | 9.1%(+2.91)#40 | 11.3%(+0.710)#12,663 |
| 41. | East Hartford | 12.0% | 9.1%(+2.88)#41 | 11.3%(+0.677)#12,705 |
| 42. | Derby | 12.0% | 9.1%(+2.83)#42 | 11.3%(+0.632)#12,764 |
| 43. | Norwich | 11.5% | 9.1%(+2.37)#43 | 11.3%(+0.174)#13,269 |
| 44. | Brooklyn | 11.5% | 9.1%(+2.33)#44 | 11.3%(+0.128)#13,328 |
| 45. | Coventry Lake | 11.4% | 9.1%(+2.30)#45 | 11.3%(+0.098)#13,363 |
| 46. | West Haven | 11.4% | 9.1%(+2.27)#46 | 11.3%(+0.071)#13,399 |
| 47. | West Mountain | 11.2% | 9.1%(+2.02)#47 | 11.3%(-0.181)#13,662 |
| 48. | Candlewood Shores | 11.1% | 9.1%(+1.97)#48 | 11.3%(-0.230)#13,723 |
| 49. | Middletown | 10.8% | 9.1%(+1.67)#49 | 11.3%(-0.529)#14,086 |
| 50. | Branford Center | 10.5% | 9.1%(+1.40)#50 | 11.3%(-0.801)#14,370 |
| 51. | Stonington Borough | 10.5% | 9.1%(+1.33)#51 | 11.3%(-0.874)#14,451 |
| 52. | Lakeville | 10.4% | 9.1%(+1.24)#52 | 11.3%(-0.962)#14,558 |
| 53. | Wauregan | 10.3% | 9.1%(+1.14)#53 | 11.3%(-1.06)#14,676 |
| 54. | Noroton Heights | 10.3% | 9.1%(+1.14)#54 | 11.3%(-1.06)#14,685 |
| 55. | West Simsbury | 10.1% | 9.1%(+0.941)#55 | 11.3%(-1.26)#14,895 |
| 56. | Colchester | 9.9% | 9.1%(+0.798)#56 | 11.3%(-1.40)#15,073 |
| 57. | Terryville | 9.7% | 9.1%(+0.543)#57 | 11.3%(-1.66)#15,356 |
| 58. | Stamford | 9.6% | 9.1%(+0.441)#58 | 11.3%(-1.76)#15,473 |
| 59. | Norwalk | 9.4% | 9.1%(+0.287)#59 | 11.3%(-1.91)#15,672 |
| 60. | Lordship | 9.4% | 9.1%(+0.281)#60 | 11.3%(-1.92)#15,680 |
| 61. | Danbury | 9.4% | 9.1%(+0.257)#61 | 11.3%(-1.94)#15,712 |
| 62. | Cornwall Bridge | 9.4% | 9.1%(+0.234)#62 | 11.3%(-1.97)#15,739 |
| 63. | Stafford Springs | 8.9% | 9.1%(-0.212)#63 | 11.3%(-2.41)#16,328 |
| 64. | Wallingford Center | 8.8% | 9.1%(-0.343)#64 | 11.3%(-2.54)#16,498 |
| 65. | Westbrook Center | 8.4% | 9.1%(-0.755)#65 | 11.3%(-2.96)#16,979 |
| 66. | Woodbury Center | 8.2% | 9.1%(-0.967)#66 | 11.3%(-3.17)#17,247 |
| 67. | South Coventry | 8.1% | 9.1%(-1.01)#67 | 11.3%(-3.21)#17,301 |
| 68. | Putnam | 8.1% | 9.1%(-1.01)#68 | 11.3%(-3.21)#17,310 |
| 69. | Old Mystic | 8.1% | 9.1%(-1.07)#69 | 11.3%(-3.27)#17,389 |
| 70. | Long Hill | 8.0% | 9.1%(-1.10)#70 | 11.3%(-3.30)#17,425 |
| 71. | Windsor Locks | 8.0% | 9.1%(-1.11)#71 | 11.3%(-3.31)#17,443 |
| 72. | Bristol | 8.0% | 9.1%(-1.16)#72 | 11.3%(-3.36)#17,501 |
| 73. | Salmon Brook | 7.9% | 9.1%(-1.26)#73 | 11.3%(-3.46)#17,639 |
| 74. | Southport | 7.8% | 9.1%(-1.30)#74 | 11.3%(-3.50)#17,694 |
| 75. | Simsbury Center | 7.8% | 9.1%(-1.37)#75 | 11.3%(-3.57)#17,784 |
| 76. | Glenville | 7.5% | 9.1%(-1.60)#76 | 11.3%(-3.80)#18,100 |
| 77. | Thomaston | 7.4% | 9.1%(-1.70)#77 | 11.3%(-3.90)#18,228 |
| 78. | Ansonia | 7.3% | 9.1%(-1.87)#78 | 11.3%(-4.07)#18,452 |
| 79. | Stratford Downtown | 7.1% | 9.1%(-2.03)#79 | 11.3%(-4.23)#18,711 |
| 80. | Poquonock Bridge | 7.1% | 9.1%(-2.03)#80 | 11.3%(-4.23)#18,714 |
| 81. | Clinton | 7.1% | 9.1%(-2.04)#81 | 11.3%(-4.24)#18,732 |
| 82. | Suffield Depot | 7.0% | 9.1%(-2.16)#82 | 11.3%(-4.36)#18,880 |
| 83. | Daniels Farm | 7.0% | 9.1%(-2.19)#83 | 11.3%(-4.39)#18,933 |
| 84. | Tokeneke | 6.8% | 9.1%(-2.34)#84 | 11.3%(-4.55)#19,165 |
| 85. | Hawleyville | 6.8% | 9.1%(-2.38)#85 | 11.3%(-4.58)#19,228 |
| 86. | Greenwich | 6.7% | 9.1%(-2.49)#86 | 11.3%(-4.69)#19,415 |
| 87. | Essex Village | 6.6% | 9.1%(-2.51)#87 | 11.3%(-4.71)#19,446 |
| 88. | Newington | 6.6% | 9.1%(-2.52)#88 | 11.3%(-4.72)#19,468 |
| 89. | Pawcatuck | 6.6% | 9.1%(-2.55)#89 | 11.3%(-4.75)#19,503 |
| 90. | Southwood Acres | 6.5% | 9.1%(-2.67)#90 | 11.3%(-4.87)#19,666 |
| 91. | East Haven | 6.5% | 9.1%(-2.69)#91 | 11.3%(-4.89)#19,683 |
| 92. | Durham | 6.2% | 9.1%(-2.98)#92 | 11.3%(-5.18)#20,111 |
| 93. | Cos Cob | 6.0% | 9.1%(-3.09)#93 | 11.3%(-5.29)#20,266 |
| 94. | North Haven | 6.0% | 9.1%(-3.12)#94 | 11.3%(-5.32)#20,305 |
| 95. | Sherwood Manor | 6.0% | 9.1%(-3.19)#95 | 11.3%(-5.39)#20,391 |
| 96. | Oakville | 5.9% | 9.1%(-3.20)#96 | 11.3%(-5.40)#20,410 |
| 97. | Wethersfield | 5.9% | 9.1%(-3.23)#97 | 11.3%(-5.43)#20,435 |
| 98. | Staples | 5.9% | 9.1%(-3.29)#98 | 11.3%(-5.49)#20,514 |
| 99. | Compo | 5.8% | 9.1%(-3.35)#99 | 11.3%(-5.55)#20,612 |
| 100. | Niantic | 5.7% | 9.1%(-3.46)#100 | 11.3%(-5.66)#20,789 |
1
2Common Questions
What are the Top 10 Cities with the Highest Male Poverty Level in Connecticut?
Top 10 Cities with the Highest Male Poverty Level in Connecticut are:
#1
55.5%
#2
37.8%
#3
29.6%
#4
26.3%
#5
25.8%
#6
24.6%
#7
23.9%
#8
23.8%
#9
23.6%
#10
22.6%
What city has the Highest Male Poverty Level in Connecticut?
Storrs has the Highest Male Poverty Level in Connecticut with 55.5%.
What is the Poverty Level Among Males in the State of Connecticut?
Poverty Level Among Males in Connecticut is 9.1%.
What is the Poverty Level Among Males in the United States?
Poverty Level Among Males in the United States is 11.3%.