Zip Codes with the Highest Percentage of Population Employed in Sales & Related in Washington
RELATED REPORTS & OPTIONS
Sales & Related
Washington
Compare Zip Codes
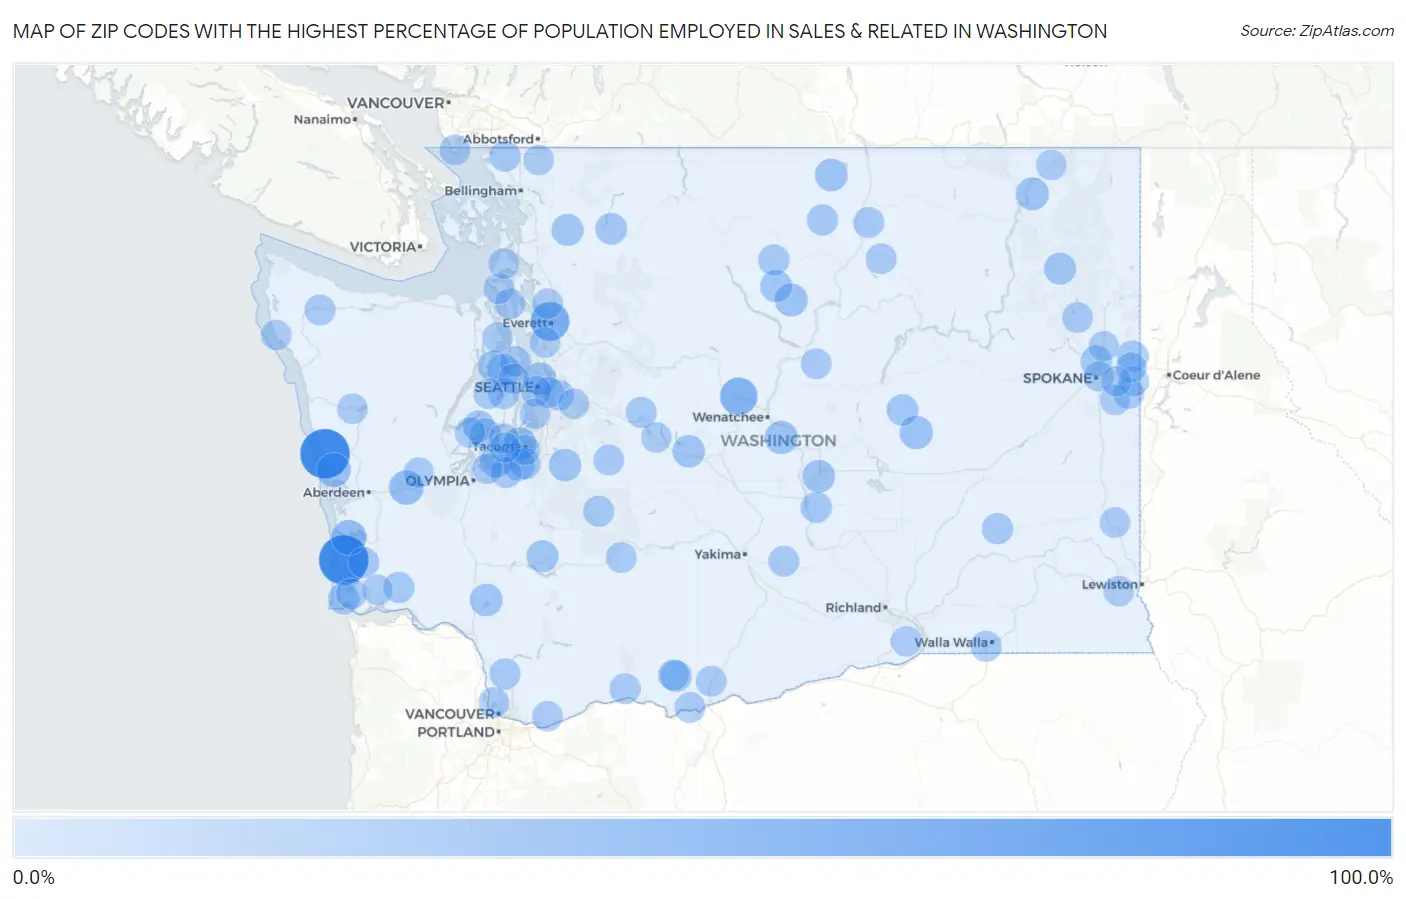
Map of Zip Codes with the Highest Percentage of Population Employed in Sales & Related in Washington
0.0%
100.0%
Zip Codes with the Highest Percentage of Population Employed in Sales & Related in Washington
| Zip Code | % Employed | vs State | vs National | |
| 1. | 98571 | 100.0% | 8.8%(+91.2)#1 | 9.6%(+90.4)#20 |
| 2. | 98641 | 100.0% | 8.8%(+91.2)#2 | 9.6%(+90.4)#25 |
| 3. | 98207 | 50.0% | 8.8%(+41.2)#3 | 9.6%(+40.4)#102 |
| 4. | 98821 | 43.2% | 8.8%(+34.4)#4 | 9.6%(+33.6)#171 |
| 5. | 98590 | 32.5% | 8.8%(+23.7)#5 | 9.6%(+22.9)#331 |
| 6. | 98583 | 29.8% | 8.8%(+21.0)#6 | 9.6%(+20.2)#409 |
| 7. | 98535 | 27.8% | 8.8%(+19.0)#7 | 9.6%(+18.2)#487 |
| 8. | 98832 | 24.5% | 8.8%(+15.7)#8 | 9.6%(+14.9)#683 |
| 9. | 98828 | 23.8% | 8.8%(+15.1)#9 | 9.6%(+14.2)#731 |
| 10. | 98416 | 23.1% | 8.8%(+14.3)#10 | 9.6%(+13.5)#779 |
| 11. | 99126 | 22.9% | 8.8%(+14.2)#11 | 9.6%(+13.3)#803 |
| 12. | 98834 | 22.7% | 8.8%(+13.9)#12 | 9.6%(+13.1)#831 |
| 13. | 98195 | 22.0% | 8.8%(+13.2)#13 | 9.6%(+12.4)#898 |
| 14. | 98824 | 21.5% | 8.8%(+12.7)#14 | 9.6%(+11.9)#961 |
| 15. | 98827 | 21.2% | 8.8%(+12.4)#15 | 9.6%(+11.6)#991 |
| 16. | 98645 | 21.2% | 8.8%(+12.4)#16 | 9.6%(+11.6)#1,001 |
| 17. | 98941 | 21.1% | 8.8%(+12.3)#17 | 9.6%(+11.5)#1,006 |
| 18. | 98385 | 20.7% | 8.8%(+11.9)#18 | 9.6%(+11.1)#1,061 |
| 19. | 98303 | 19.7% | 8.8%(+10.9)#19 | 9.6%(+10.1)#1,208 |
| 20. | 98345 | 19.0% | 8.8%(+10.2)#20 | 9.6%(+9.38)#1,346 |
| 21. | 98814 | 19.0% | 8.8%(+10.2)#21 | 9.6%(+9.36)#1,350 |
| 22. | 98263 | 18.6% | 8.8%(+9.76)#22 | 9.6%(+8.96)#1,426 |
| 23. | 99109 | 18.3% | 8.8%(+9.55)#23 | 9.6%(+8.74)#1,476 |
| 24. | 98356 | 18.3% | 8.8%(+9.54)#24 | 9.6%(+8.74)#1,478 |
| 25. | 98237 | 17.5% | 8.8%(+8.73)#25 | 9.6%(+7.93)#1,686 |
| 26. | 98438 | 17.3% | 8.8%(+8.54)#26 | 9.6%(+7.74)#1,734 |
| 27. | 98860 | 17.2% | 8.8%(+8.40)#27 | 9.6%(+7.59)#1,779 |
| 28. | 98644 | 16.8% | 8.8%(+7.97)#28 | 9.6%(+7.17)#1,910 |
| 29. | 98315 | 16.6% | 8.8%(+7.84)#29 | 9.6%(+7.04)#1,970 |
| 30. | 98524 | 16.6% | 8.8%(+7.83)#30 | 9.6%(+7.03)#1,973 |
| 31. | 98628 | 16.2% | 8.8%(+7.42)#31 | 9.6%(+6.62)#2,140 |
| 32. | 99025 | 16.1% | 8.8%(+7.32)#32 | 9.6%(+6.52)#2,179 |
| 33. | 99251 | 16.1% | 8.8%(+7.31)#33 | 9.6%(+6.50)#2,186 |
| 34. | 98394 | 15.3% | 8.8%(+6.50)#34 | 9.6%(+5.70)#2,572 |
| 35. | 98856 | 15.2% | 8.8%(+6.42)#35 | 9.6%(+5.62)#2,620 |
| 36. | 98819 | 14.9% | 8.8%(+6.13)#36 | 9.6%(+5.33)#2,789 |
| 37. | 99321 | 14.9% | 8.8%(+6.12)#37 | 9.6%(+5.32)#2,797 |
| 38. | 98447 | 14.9% | 8.8%(+6.07)#38 | 9.6%(+5.27)#2,824 |
| 39. | 98621 | 14.9% | 8.8%(+6.07)#39 | 9.6%(+5.26)#2,833 |
| 40. | 98304 | 14.6% | 8.8%(+5.81)#40 | 9.6%(+5.00)#3,019 |
| 41. | 99371 | 14.6% | 8.8%(+5.79)#41 | 9.6%(+4.99)#3,027 |
| 42. | 98068 | 14.6% | 8.8%(+5.77)#42 | 9.6%(+4.96)#3,043 |
| 43. | 98670 | 14.3% | 8.8%(+5.49)#43 | 9.6%(+4.69)#3,273 |
| 44. | 98240 | 14.1% | 8.8%(+5.33)#44 | 9.6%(+4.53)#3,375 |
| 45. | 98936 | 14.1% | 8.8%(+5.29)#45 | 9.6%(+4.49)#3,402 |
| 46. | 98849 | 14.0% | 8.8%(+5.19)#46 | 9.6%(+4.39)#3,492 |
| 47. | 99324 | 13.8% | 8.8%(+5.01)#47 | 9.6%(+4.21)#3,641 |
| 48. | 98605 | 13.8% | 8.8%(+4.99)#48 | 9.6%(+4.18)#3,668 |
| 49. | 98337 | 13.7% | 8.8%(+4.94)#49 | 9.6%(+4.14)#3,716 |
| 50. | 98433 | 13.7% | 8.8%(+4.90)#50 | 9.6%(+4.09)#3,760 |
| 51. | 98586 | 13.6% | 8.8%(+4.81)#51 | 9.6%(+4.01)#3,833 |
| 52. | 98629 | 13.5% | 8.8%(+4.73)#52 | 9.6%(+3.92)#3,919 |
| 53. | 98673 | 13.3% | 8.8%(+4.49)#53 | 9.6%(+3.69)#4,184 |
| 54. | 98305 | 13.3% | 8.8%(+4.46)#54 | 9.6%(+3.66)#4,218 |
| 55. | 98006 | 13.2% | 8.8%(+4.44)#55 | 9.6%(+3.64)#4,240 |
| 56. | 98040 | 13.2% | 8.8%(+4.43)#56 | 9.6%(+3.63)#4,254 |
| 57. | 98620 | 13.2% | 8.8%(+4.38)#57 | 9.6%(+3.58)#4,309 |
| 58. | 98858 | 13.1% | 8.8%(+4.31)#58 | 9.6%(+3.51)#4,380 |
| 59. | 99110 | 13.0% | 8.8%(+4.20)#59 | 9.6%(+3.40)#4,491 |
| 60. | 98361 | 13.0% | 8.8%(+4.19)#60 | 9.6%(+3.39)#4,506 |
| 61. | 98134 | 12.9% | 8.8%(+4.12)#61 | 9.6%(+3.32)#4,585 |
| 62. | 98841 | 12.8% | 8.8%(+4.05)#62 | 9.6%(+3.24)#4,688 |
| 63. | 98281 | 12.8% | 8.8%(+4.00)#63 | 9.6%(+3.20)#4,756 |
| 64. | 98022 | 12.7% | 8.8%(+3.89)#64 | 9.6%(+3.08)#4,909 |
| 65. | 98624 | 12.6% | 8.8%(+3.77)#65 | 9.6%(+2.97)#5,069 |
| 66. | 98342 | 12.5% | 8.8%(+3.75)#66 | 9.6%(+2.95)#5,107 |
| 67. | 98660 | 12.5% | 8.8%(+3.74)#67 | 9.6%(+2.94)#5,118 |
| 68. | 98253 | 12.3% | 8.8%(+3.56)#68 | 9.6%(+2.75)#5,410 |
| 69. | 98087 | 12.3% | 8.8%(+3.54)#69 | 9.6%(+2.74)#5,425 |
| 70. | 98239 | 12.3% | 8.8%(+3.53)#70 | 9.6%(+2.72)#5,453 |
| 71. | 98027 | 12.3% | 8.8%(+3.51)#71 | 9.6%(+2.71)#5,481 |
| 72. | 99157 | 12.2% | 8.8%(+3.44)#72 | 9.6%(+2.64)#5,616 |
| 73. | 99023 | 12.2% | 8.8%(+3.41)#73 | 9.6%(+2.61)#5,662 |
| 74. | 98671 | 12.1% | 8.8%(+3.35)#74 | 9.6%(+2.55)#5,776 |
| 75. | 98350 | 12.1% | 8.8%(+3.33)#75 | 9.6%(+2.53)#5,825 |
| 76. | 98638 | 12.1% | 8.8%(+3.32)#76 | 9.6%(+2.52)#5,841 |
| 77. | 99036 | 12.0% | 8.8%(+3.24)#77 | 9.6%(+2.44)#5,984 |
| 78. | 98312 | 12.0% | 8.8%(+3.23)#78 | 9.6%(+2.43)#6,003 |
| 79. | 98335 | 12.0% | 8.8%(+3.23)#79 | 9.6%(+2.43)#6,007 |
| 80. | 99403 | 12.0% | 8.8%(+3.21)#80 | 9.6%(+2.41)#6,038 |
| 81. | 98526 | 12.0% | 8.8%(+3.21)#81 | 9.6%(+2.40)#6,048 |
| 82. | 98365 | 12.0% | 8.8%(+3.21)#82 | 9.6%(+2.40)#6,054 |
| 83. | 98271 | 11.9% | 8.8%(+3.13)#83 | 9.6%(+2.32)#6,189 |
| 84. | 98925 | 11.9% | 8.8%(+3.11)#84 | 9.6%(+2.31)#6,214 |
| 85. | 98110 | 11.9% | 8.8%(+3.10)#85 | 9.6%(+2.29)#6,250 |
| 86. | 99337 | 11.8% | 8.8%(+3.03)#86 | 9.6%(+2.23)#6,375 |
| 87. | 98277 | 11.8% | 8.8%(+3.00)#87 | 9.6%(+2.20)#6,422 |
| 88. | 98418 | 11.8% | 8.8%(+3.00)#88 | 9.6%(+2.20)#6,423 |
| 89. | 98516 | 11.8% | 8.8%(+2.97)#89 | 9.6%(+2.17)#6,465 |
| 90. | 99005 | 11.7% | 8.8%(+2.92)#90 | 9.6%(+2.12)#6,573 |
| 91. | 98541 | 11.7% | 8.8%(+2.92)#91 | 9.6%(+2.11)#6,588 |
| 92. | 99102 | 11.7% | 8.8%(+2.89)#92 | 9.6%(+2.08)#6,647 |
| 93. | 99258 | 11.7% | 8.8%(+2.87)#93 | 9.6%(+2.07)#6,677 |
| 94. | 99019 | 11.7% | 8.8%(+2.87)#94 | 9.6%(+2.06)#6,689 |
| 95. | 98276 | 11.6% | 8.8%(+2.83)#95 | 9.6%(+2.02)#6,764 |
| 96. | 99027 | 11.5% | 8.8%(+2.74)#96 | 9.6%(+1.93)#6,950 |
| 97. | 98166 | 11.5% | 8.8%(+2.71)#97 | 9.6%(+1.90)#7,010 |
| 98. | 99206 | 11.5% | 8.8%(+2.70)#98 | 9.6%(+1.90)#7,031 |
| 99. | 98333 | 11.5% | 8.8%(+2.67)#99 | 9.6%(+1.87)#7,112 |
| 100. | 98546 | 11.4% | 8.8%(+2.66)#100 | 9.6%(+1.85)#7,137 |
Common Questions
What are the Top 10 Zip Codes with the Highest Percentage of Population Employed in Sales & Related in Washington?
Top 10 Zip Codes with the Highest Percentage of Population Employed in Sales & Related in Washington are:
What zip code has the Highest Percentage of Population Employed in Sales & Related in Washington?
98571 has the Highest Percentage of Population Employed in Sales & Related in Washington with 100.0%.
What is the Percentage of Population Employed in Sales & Related in the State of Washington?
Percentage of Population Employed in Sales & Related in Washington is 8.8%.
What is the Percentage of Population Employed in Sales & Related in the United States?
Percentage of Population Employed in Sales & Related in the United States is 9.6%.