Cities with the Highest Percentage of Population Employed in Sales & Related in Maryland
RELATED REPORTS & OPTIONS
Sales & Related
Maryland
Compare Cities
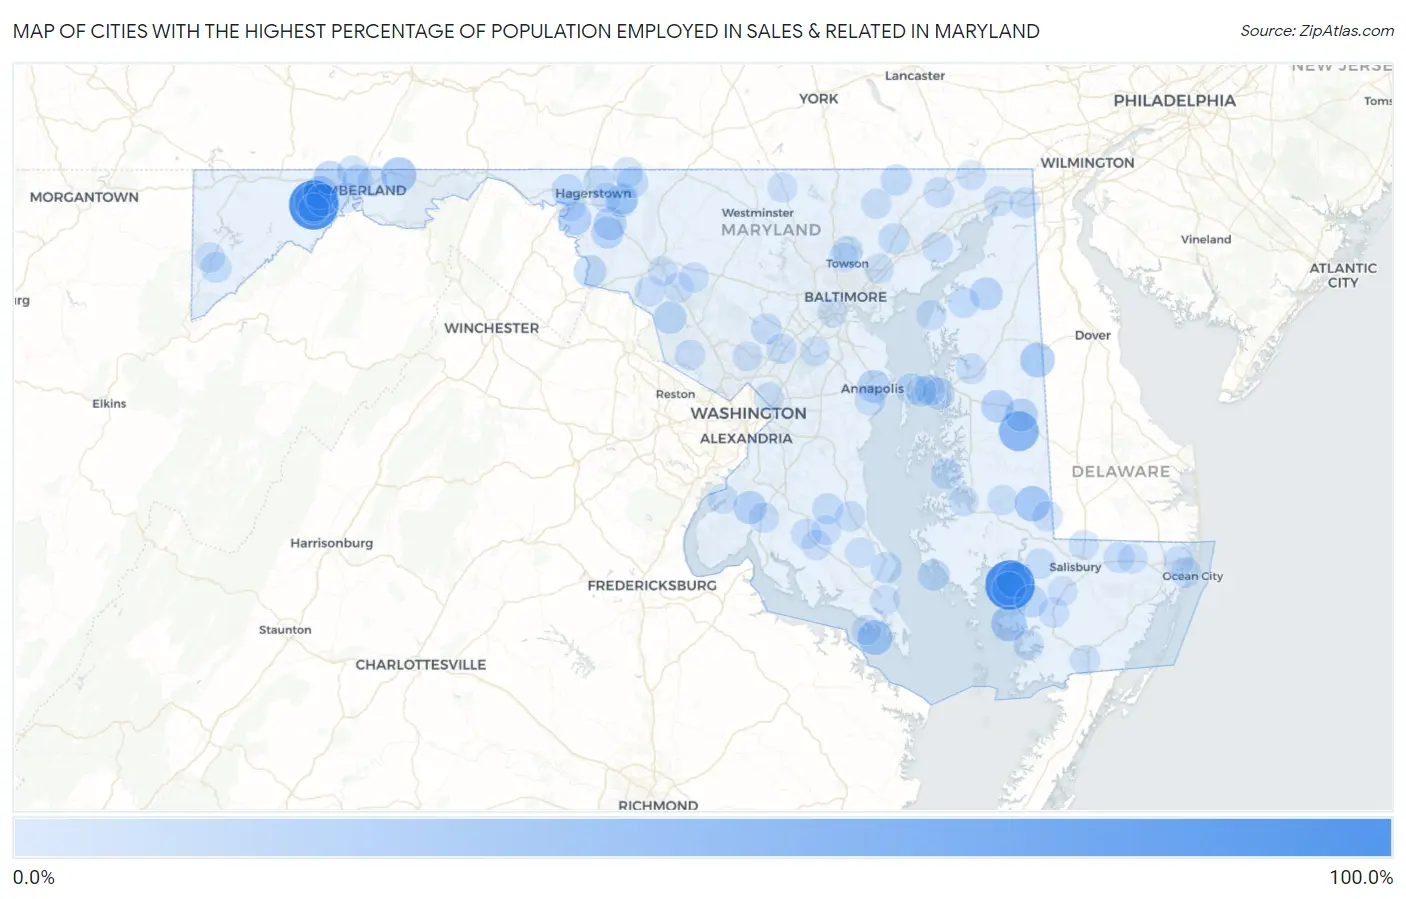
Map of Cities with the Highest Percentage of Population Employed in Sales & Related in Maryland
0.0%
100.0%
Cities with the Highest Percentage of Population Employed in Sales & Related in Maryland
| City | % Employed | vs State | vs National | |
| 1. | Bivalve | 100.0% | 8.0%(+92.0)#1 | 9.6%(+90.4)#11 |
| 2. | Ocean | 100.0% | 8.0%(+92.0)#2 | 9.6%(+90.4)#36 |
| 3. | Williston | 55.0% | 8.0%(+47.0)#3 | 9.6%(+45.4)#139 |
| 4. | Woodland | 48.3% | 8.0%(+40.3)#4 | 9.6%(+38.7)#201 |
| 5. | Flintstone | 35.0% | 8.0%(+27.0)#5 | 9.6%(+25.4)#422 |
| 6. | Eldorado | 34.8% | 8.0%(+26.8)#6 | 9.6%(+25.2)#434 |
| 7. | Dames Quarter | 34.0% | 8.0%(+26.0)#7 | 9.6%(+24.4)#458 |
| 8. | Tyaskin | 33.3% | 8.0%(+25.3)#8 | 9.6%(+23.7)#479 |
| 9. | St George Island | 33.0% | 8.0%(+25.0)#9 | 9.6%(+23.4)#494 |
| 10. | Still Pond | 32.7% | 8.0%(+24.7)#10 | 9.6%(+23.1)#502 |
| 11. | Henderson | 31.4% | 8.0%(+23.4)#11 | 9.6%(+21.8)#560 |
| 12. | Jesterville | 27.8% | 8.0%(+19.8)#12 | 9.6%(+18.2)#785 |
| 13. | Grahamtown | 25.6% | 8.0%(+17.6)#13 | 9.6%(+16.0)#945 |
| 14. | Pomfret | 25.1% | 8.0%(+17.2)#14 | 9.6%(+15.5)#984 |
| 15. | West Denton | 24.5% | 8.0%(+16.5)#15 | 9.6%(+14.9)#1,058 |
| 16. | Mount Savage | 24.4% | 8.0%(+16.4)#16 | 9.6%(+14.8)#1,068 |
| 17. | Downsville | 24.3% | 8.0%(+16.3)#17 | 9.6%(+14.7)#1,087 |
| 18. | Mapleville | 23.2% | 8.0%(+15.2)#18 | 9.6%(+13.6)#1,197 |
| 19. | Naval Academy | 23.0% | 8.0%(+15.0)#19 | 9.6%(+13.4)#1,231 |
| 20. | Hillsboro | 22.6% | 8.0%(+14.6)#20 | 9.6%(+13.0)#1,299 |
| 21. | Kennedyville | 22.3% | 8.0%(+14.3)#21 | 9.6%(+12.7)#1,336 |
| 22. | Mount Vernon | 22.0% | 8.0%(+14.0)#22 | 9.6%(+12.4)#1,390 |
| 23. | Barnesville | 21.6% | 8.0%(+13.6)#23 | 9.6%(+12.0)#1,462 |
| 24. | Boonsboro | 20.8% | 8.0%(+12.8)#24 | 9.6%(+11.2)#1,603 |
| 25. | Dargan | 20.8% | 8.0%(+12.8)#25 | 9.6%(+11.2)#1,619 |
| 26. | Vale Summit | 20.2% | 8.0%(+12.2)#26 | 9.6%(+10.6)#1,727 |
| 27. | Grasonville | 19.8% | 8.0%(+11.8)#27 | 9.6%(+10.2)#1,847 |
| 28. | Jugtown | 19.5% | 8.0%(+11.5)#28 | 9.6%(+9.89)#1,918 |
| 29. | Wilson Conococheague | 18.9% | 8.0%(+10.9)#29 | 9.6%(+9.34)#2,081 |
| 30. | Fishing Creek | 18.1% | 8.0%(+10.1)#30 | 9.6%(+8.49)#2,336 |
| 31. | Pondsville | 17.5% | 8.0%(+9.47)#31 | 9.6%(+7.87)#2,521 |
| 32. | Lusby | 16.9% | 8.0%(+8.93)#32 | 9.6%(+7.33)#2,761 |
| 33. | Paramount Long Meadow | 16.7% | 8.0%(+8.74)#33 | 9.6%(+7.14)#2,852 |
| 34. | Pylesville | 16.6% | 8.0%(+8.63)#34 | 9.6%(+7.02)#2,942 |
| 35. | Stevensville | 16.6% | 8.0%(+8.62)#35 | 9.6%(+7.01)#2,943 |
| 36. | Edgemont | 16.4% | 8.0%(+8.45)#36 | 9.6%(+6.84)#3,018 |
| 37. | Ellerslie | 16.3% | 8.0%(+8.30)#37 | 9.6%(+6.69)#3,099 |
| 38. | Kent Narrows | 16.3% | 8.0%(+8.27)#38 | 9.6%(+6.67)#3,120 |
| 39. | Pleasant Hills | 15.7% | 8.0%(+7.73)#39 | 9.6%(+6.13)#3,466 |
| 40. | Eagle Harbor | 15.6% | 8.0%(+7.64)#40 | 9.6%(+6.03)#3,531 |
| 41. | Oxford | 15.6% | 8.0%(+7.57)#41 | 9.6%(+5.96)#3,570 |
| 42. | Worton | 15.5% | 8.0%(+7.47)#42 | 9.6%(+5.87)#3,633 |
| 43. | Loch Lynn Heights | 15.2% | 8.0%(+7.17)#43 | 9.6%(+5.57)#3,813 |
| 44. | Pittsville | 15.0% | 8.0%(+7.06)#44 | 9.6%(+5.45)#3,901 |
| 45. | Timonium | 14.8% | 8.0%(+6.76)#45 | 9.6%(+5.16)#4,121 |
| 46. | Annapolis Neck | 14.7% | 8.0%(+6.73)#46 | 9.6%(+5.13)#4,136 |
| 47. | Perryman | 14.7% | 8.0%(+6.68)#47 | 9.6%(+5.08)#4,172 |
| 48. | Ringgold | 14.6% | 8.0%(+6.64)#48 | 9.6%(+5.04)#4,199 |
| 49. | Quantico | 14.5% | 8.0%(+6.56)#49 | 9.6%(+4.95)#4,272 |
| 50. | Chester | 14.3% | 8.0%(+6.34)#50 | 9.6%(+4.74)#4,438 |
| 51. | Highland | 14.3% | 8.0%(+6.30)#51 | 9.6%(+4.69)#4,473 |
| 52. | Elkton | 14.2% | 8.0%(+6.25)#52 | 9.6%(+4.65)#4,553 |
| 53. | Centreville | 13.9% | 8.0%(+5.92)#53 | 9.6%(+4.32)#4,848 |
| 54. | Darlington | 13.6% | 8.0%(+5.61)#54 | 9.6%(+4.00)#5,168 |
| 55. | Bowling Green | 13.5% | 8.0%(+5.52)#55 | 9.6%(+3.91)#5,251 |
| 56. | Indian Head | 13.5% | 8.0%(+5.49)#56 | 9.6%(+3.89)#5,276 |
| 57. | West Ocean City | 13.5% | 8.0%(+5.48)#57 | 9.6%(+3.88)#5,289 |
| 58. | Sharptown | 13.4% | 8.0%(+5.44)#58 | 9.6%(+3.83)#5,330 |
| 59. | Bowmans Addition | 13.4% | 8.0%(+5.43)#59 | 9.6%(+3.83)#5,343 |
| 60. | Prince Frederick | 13.4% | 8.0%(+5.38)#60 | 9.6%(+3.77)#5,406 |
| 61. | Oakland | 13.3% | 8.0%(+5.36)#61 | 9.6%(+3.75)#5,424 |
| 62. | West Laurel | 13.3% | 8.0%(+5.34)#62 | 9.6%(+3.73)#5,471 |
| 63. | Pleasant Grove | 13.2% | 8.0%(+5.25)#63 | 9.6%(+3.64)#5,574 |
| 64. | Fairmount | 13.2% | 8.0%(+5.24)#64 | 9.6%(+3.63)#5,585 |
| 65. | East New Market | 13.2% | 8.0%(+5.20)#65 | 9.6%(+3.59)#5,640 |
| 66. | Darnestown | 13.2% | 8.0%(+5.17)#66 | 9.6%(+3.56)#5,675 |
| 67. | Cedar Heights | 13.0% | 8.0%(+5.05)#67 | 9.6%(+3.45)#5,820 |
| 68. | Charlotte Hall | 13.0% | 8.0%(+5.05)#68 | 9.6%(+3.44)#5,843 |
| 69. | Ocean Pines | 12.9% | 8.0%(+4.94)#69 | 9.6%(+3.34)#5,981 |
| 70. | Mechanicsville | 12.9% | 8.0%(+4.91)#70 | 9.6%(+3.30)#6,043 |
| 71. | Jarrettsville | 12.8% | 8.0%(+4.84)#71 | 9.6%(+3.24)#6,124 |
| 72. | Princess Anne | 12.8% | 8.0%(+4.77)#72 | 9.6%(+3.17)#6,218 |
| 73. | Midland | 12.8% | 8.0%(+4.77)#73 | 9.6%(+3.16)#6,221 |
| 74. | La Plata | 12.8% | 8.0%(+4.76)#74 | 9.6%(+3.16)#6,230 |
| 75. | Tolchester | 12.6% | 8.0%(+4.65)#75 | 9.6%(+3.04)#6,382 |
| 76. | North Brentwood | 12.5% | 8.0%(+4.51)#76 | 9.6%(+2.90)#6,570 |
| 77. | Adamstown | 12.5% | 8.0%(+4.47)#77 | 9.6%(+2.86)#6,654 |
| 78. | Urbana | 12.4% | 8.0%(+4.41)#78 | 9.6%(+2.80)#6,705 |
| 79. | Algonquin | 12.4% | 8.0%(+4.38)#79 | 9.6%(+2.77)#6,740 |
| 80. | Monrovia | 12.2% | 8.0%(+4.18)#80 | 9.6%(+2.57)#7,022 |
| 81. | Lexington Park | 12.2% | 8.0%(+4.17)#81 | 9.6%(+2.57)#7,038 |
| 82. | Abingdon | 12.0% | 8.0%(+4.06)#82 | 9.6%(+2.45)#7,204 |
| 83. | Willards | 12.0% | 8.0%(+3.99)#83 | 9.6%(+2.38)#7,306 |
| 84. | Broomes Island | 12.0% | 8.0%(+3.98)#84 | 9.6%(+2.37)#7,320 |
| 85. | Delmar | 11.9% | 8.0%(+3.93)#85 | 9.6%(+2.33)#7,384 |
| 86. | Williamsport | 11.9% | 8.0%(+3.87)#86 | 9.6%(+2.27)#7,478 |
| 87. | Fort Meade | 11.8% | 8.0%(+3.84)#87 | 9.6%(+2.23)#7,541 |
| 88. | Piney Point | 11.8% | 8.0%(+3.82)#88 | 9.6%(+2.21)#7,575 |
| 89. | White Marsh | 11.8% | 8.0%(+3.77)#89 | 9.6%(+2.17)#7,673 |
| 90. | Layhill | 11.7% | 8.0%(+3.66)#90 | 9.6%(+2.06)#7,834 |
| 91. | Robinwood | 11.6% | 8.0%(+3.60)#91 | 9.6%(+1.99)#7,951 |
| 92. | Pocomoke City | 11.6% | 8.0%(+3.59)#92 | 9.6%(+1.99)#7,958 |
| 93. | Lutherville | 11.6% | 8.0%(+3.59)#93 | 9.6%(+1.98)#7,973 |
| 94. | Ballenger Creek | 11.6% | 8.0%(+3.58)#94 | 9.6%(+1.98)#7,981 |
| 95. | North East | 11.6% | 8.0%(+3.58)#95 | 9.6%(+1.97)#7,997 |
| 96. | Lansdowne | 11.6% | 8.0%(+3.57)#96 | 9.6%(+1.97)#8,001 |
| 97. | Golden Beach | 11.5% | 8.0%(+3.53)#97 | 9.6%(+1.93)#8,073 |
| 98. | Eden | 11.5% | 8.0%(+3.53)#98 | 9.6%(+1.92)#8,085 |
| 99. | Rising Sun | 11.5% | 8.0%(+3.48)#99 | 9.6%(+1.88)#8,171 |
| 100. | Manchester | 11.4% | 8.0%(+3.44)#100 | 9.6%(+1.83)#8,255 |
Common Questions
What are the Top 10 Cities with the Highest Percentage of Population Employed in Sales & Related in Maryland?
Top 10 Cities with the Highest Percentage of Population Employed in Sales & Related in Maryland are:
#1
100.0%
#2
100.0%
#3
55.0%
#4
48.3%
#5
35.0%
#6
34.8%
#7
34.0%
#8
33.3%
#9
33.0%
#10
31.4%
What city has the Highest Percentage of Population Employed in Sales & Related in Maryland?
Bivalve has the Highest Percentage of Population Employed in Sales & Related in Maryland with 100.0%.
What is the Percentage of Population Employed in Sales & Related in the State of Maryland?
Percentage of Population Employed in Sales & Related in Maryland is 8.0%.
What is the Percentage of Population Employed in Sales & Related in the United States?
Percentage of Population Employed in Sales & Related in the United States is 9.6%.