Cities with the Highest Percentage of Population Employed in Sales & Related in Alabama
RELATED REPORTS & OPTIONS
Sales & Related
Alabama
Compare Cities
Map of Cities with the Highest Percentage of Population Employed in Sales & Related in Alabama
0.0%
100.0%
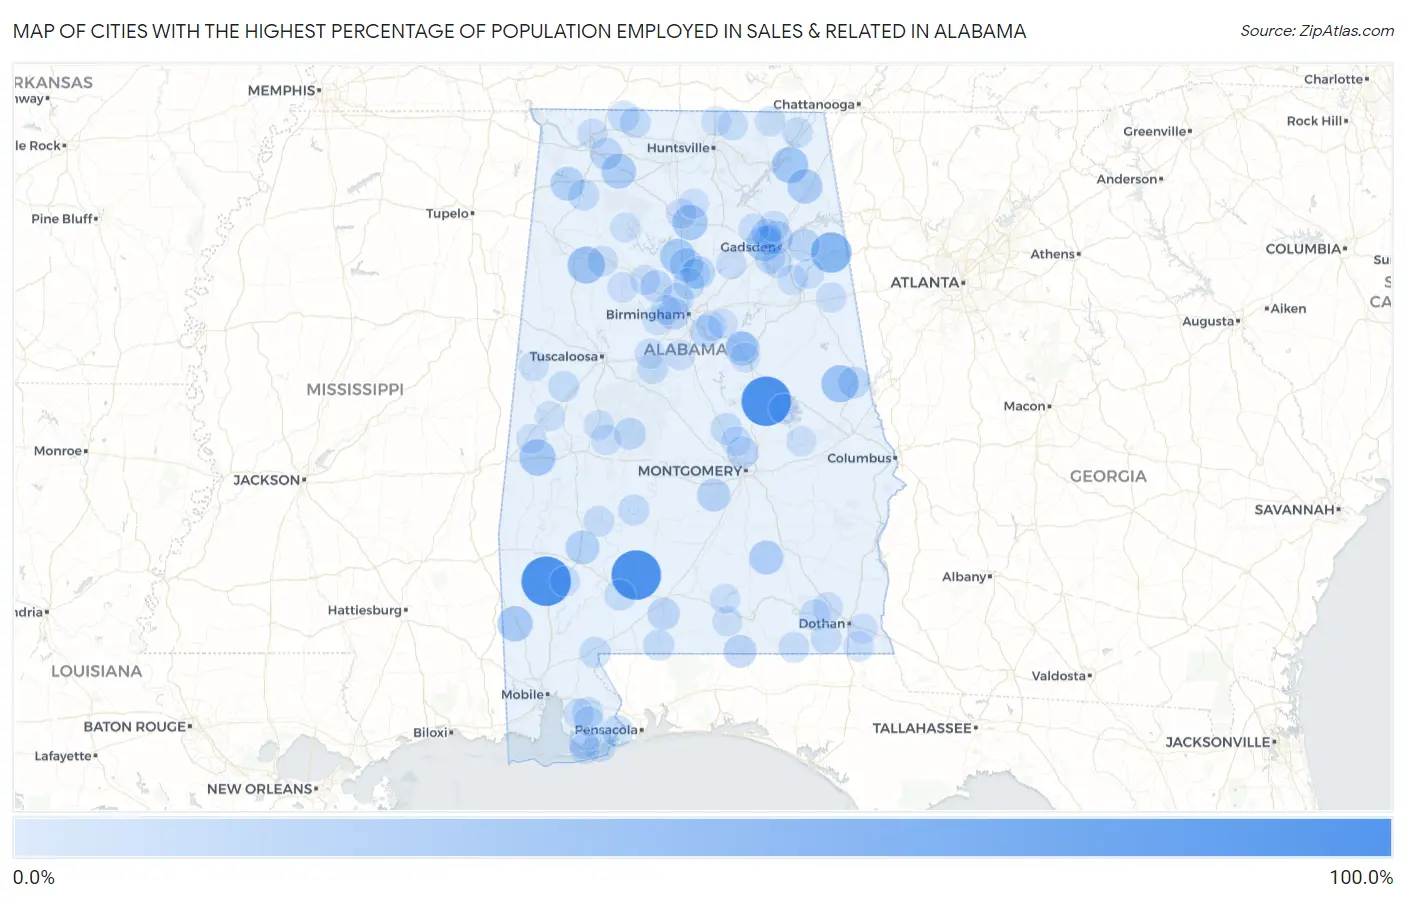
Cities with the Highest Percentage of Population Employed in Sales & Related in Alabama
| City | % Employed | vs State | vs National | |
| 1. | St Stephens | 100.0% | 10.0% (+90.0)#1 | 9.6% (+90.4)#1 |
| 2. | Hissop | 100.0% | 10.0% (+90.0)#2 | 9.6% (+90.4)#8 |
| 3. | Peterman | 100.0% | 10.0% (+90.0)#3 | 9.6% (+90.4)#27 |
| 4. | Spring Garden | 58.6% | 10.0% (+48.7)#4 | 9.6% (+49.0)#105 |
| 5. | Nixburg | 47.0% | 10.0% (+37.0)#5 | 9.6% (+37.4)#217 |
| 6. | Penton | 44.4% | 10.0% (+34.5)#6 | 9.6% (+34.8)#244 |
| 7. | Glen Allen | 44.3% | 10.0% (+34.3)#7 | 9.6% (+34.7)#245 |
| 8. | Bellamy | 40.7% | 10.0% (+30.8)#8 | 9.6% (+31.1)#301 |
| 9. | Dutton | 40.2% | 10.0% (+30.3)#9 | 9.6% (+30.6)#307 |
| 10. | East Point | 36.4% | 10.0% (+26.4)#10 | 9.6% (+26.8)#387 |
| 11. | Deer Park | 35.7% | 10.0% (+25.8)#11 | 9.6% (+26.1)#402 |
| 12. | Colony | 35.2% | 10.0% (+25.3)#12 | 9.6% (+25.7)#415 |
| 13. | Ivalee | 34.6% | 10.0% (+24.6)#13 | 9.6% (+25.0)#440 |
| 14. | Pine Ridge | 34.1% | 10.0% (+24.1)#14 | 9.6% (+24.5)#452 |
| 15. | Hatton | 33.8% | 10.0% (+23.8)#15 | 9.6% (+24.2)#464 |
| 16. | Goshen | 30.8% | 10.0% (+20.8)#16 | 9.6% (+21.2)#588 |
| 17. | Bon Air | 30.8% | 10.0% (+20.8)#17 | 9.6% (+21.2)#591 |
| 18. | Belgreen | 30.0% | 10.0% (+20.0)#18 | 9.6% (+20.4)#637 |
| 19. | Fulton | 29.7% | 10.0% (+19.8)#19 | 9.6% (+20.1)#653 |
| 20. | Smoke Rise | 29.2% | 10.0% (+19.3)#20 | 9.6% (+19.6)#682 |
| 21. | Reece City | 27.4% | 10.0% (+17.5)#21 | 9.6% (+17.8)#799 |
| 22. | Hayneville | 27.1% | 10.0% (+17.1)#22 | 9.6% (+17.5)#827 |
| 23. | Lockhart | 25.5% | 10.0% (+15.6)#23 | 9.6% (+15.9)#958 |
| 24. | County Line | 24.8% | 10.0% (+14.9)#24 | 9.6% (+15.2)#1,023 |
| 25. | Ballplay | 24.8% | 10.0% (+14.8)#25 | 9.6% (+15.2)#1,030 |
| 26. | Highland Lakes | 24.1% | 10.0% (+14.1)#26 | 9.6% (+14.5)#1,106 |
| 27. | Castleberry | 23.1% | 10.0% (+13.1)#27 | 9.6% (+13.5)#1,208 |
| 28. | Coosada | 23.0% | 10.0% (+13.0)#28 | 9.6% (+13.4)#1,223 |
| 29. | Mcdonald Chapel | 22.9% | 10.0% (+12.9)#29 | 9.6% (+13.3)#1,242 |
| 30. | Leighton | 22.7% | 10.0% (+12.8)#30 | 9.6% (+13.1)#1,279 |
| 31. | Dora | 22.5% | 10.0% (+12.5)#31 | 9.6% (+12.9)#1,313 |
| 32. | Five Points | 21.4% | 10.0% (+11.5)#32 | 9.6% (+11.8)#1,492 |
| 33. | Marion | 21.0% | 10.0% (+11.1)#33 | 9.6% (+11.4)#1,573 |
| 34. | Brookside | 20.8% | 10.0% (+10.9)#34 | 9.6% (+11.2)#1,604 |
| 35. | Orange Beach | 20.5% | 10.0% (+10.5)#35 | 9.6% (+10.9)#1,671 |
| 36. | Marbury | 20.2% | 10.0% (+10.2)#36 | 9.6% (+10.6)#1,742 |
| 37. | Lillian | 20.0% | 10.0% (+10.0)#37 | 9.6% (+10.4)#1,807 |
| 38. | Morris | 19.6% | 10.0% (+9.65)#38 | 9.6% (+10.0)#1,882 |
| 39. | Lexington | 19.2% | 10.0% (+9.22)#39 | 9.6% (+9.58)#2,012 |
| 40. | Frisco City | 18.9% | 10.0% (+8.99)#40 | 9.6% (+9.35)#2,075 |
| 41. | Perdido | 18.8% | 10.0% (+8.87)#41 | 9.6% (+9.23)#2,112 |
| 42. | Daleville | 18.8% | 10.0% (+8.84)#42 | 9.6% (+9.20)#2,120 |
| 43. | Spruce Pine | 18.8% | 10.0% (+8.79)#43 | 9.6% (+9.15)#2,138 |
| 44. | Boykin | 18.5% | 10.0% (+8.56)#44 | 9.6% (+8.92)#2,211 |
| 45. | Anderson | 18.5% | 10.0% (+8.52)#45 | 9.6% (+8.88)#2,226 |
| 46. | Riverview | 18.4% | 10.0% (+8.41)#46 | 9.6% (+8.77)#2,246 |
| 47. | Robertsdale | 18.0% | 10.0% (+8.02)#47 | 9.6% (+8.38)#2,360 |
| 48. | Union | 17.9% | 10.0% (+7.99)#48 | 9.6% (+8.35)#2,369 |
| 49. | New Market | 17.8% | 10.0% (+7.89)#49 | 9.6% (+8.25)#2,406 |
| 50. | Kansas | 17.4% | 10.0% (+7.44)#50 | 9.6% (+7.80)#2,558 |
| 51. | Geneva | 17.4% | 10.0% (+7.40)#51 | 9.6% (+7.76)#2,568 |
| 52. | Gulf Shores | 17.0% | 10.0% (+7.02)#52 | 9.6% (+7.38)#2,734 |
| 53. | Stevenson | 16.9% | 10.0% (+6.99)#53 | 9.6% (+7.35)#2,742 |
| 54. | Pine Hill | 16.9% | 10.0% (+6.98)#54 | 9.6% (+7.34)#2,752 |
| 55. | Whitesboro | 16.9% | 10.0% (+6.97)#55 | 9.6% (+7.33)#2,762 |
| 56. | Southside | 16.8% | 10.0% (+6.89)#56 | 9.6% (+7.25)#2,802 |
| 57. | Ridgeville | 16.7% | 10.0% (+6.71)#57 | 9.6% (+7.07)#2,894 |
| 58. | Slocomb | 16.5% | 10.0% (+6.57)#58 | 9.6% (+6.93)#2,982 |
| 59. | West Blocton | 16.5% | 10.0% (+6.54)#59 | 9.6% (+6.90)#2,997 |
| 60. | Newton | 16.4% | 10.0% (+6.47)#60 | 9.6% (+6.83)#3,027 |
| 61. | Childersburg | 16.3% | 10.0% (+6.37)#61 | 9.6% (+6.73)#3,081 |
| 62. | Highland Lake | 16.3% | 10.0% (+6.31)#62 | 9.6% (+6.67)#3,117 |
| 63. | Brantleyville | 16.2% | 10.0% (+6.29)#63 | 9.6% (+6.65)#3,129 |
| 64. | Newbern | 16.2% | 10.0% (+6.28)#64 | 9.6% (+6.64)#3,135 |
| 65. | Alexandria | 16.2% | 10.0% (+6.28)#65 | 9.6% (+6.64)#3,136 |
| 66. | Florence | 16.1% | 10.0% (+6.11)#66 | 9.6% (+6.47)#3,243 |
| 67. | Woodstock | 15.9% | 10.0% (+5.93)#67 | 9.6% (+6.29)#3,356 |
| 68. | New Union | 15.8% | 10.0% (+5.88)#68 | 9.6% (+6.24)#3,391 |
| 69. | South Vinemont | 15.8% | 10.0% (+5.80)#69 | 9.6% (+6.16)#3,445 |
| 70. | Silverhill | 15.6% | 10.0% (+5.69)#70 | 9.6% (+6.05)#3,517 |
| 71. | Carlisle Rockledge | 15.6% | 10.0% (+5.67)#71 | 9.6% (+6.04)#3,522 |
| 72. | Bon Secour | 15.6% | 10.0% (+5.65)#72 | 9.6% (+6.01)#3,539 |
| 73. | Oakman | 15.6% | 10.0% (+5.62)#73 | 9.6% (+5.98)#3,557 |
| 74. | Hytop | 15.6% | 10.0% (+5.60)#74 | 9.6% (+5.96)#3,571 |
| 75. | Cottonwood | 15.5% | 10.0% (+5.56)#75 | 9.6% (+5.93)#3,593 |
| 76. | Jacksonville | 15.5% | 10.0% (+5.56)#76 | 9.6% (+5.92)#3,595 |
| 77. | Rainbow City | 15.5% | 10.0% (+5.55)#77 | 9.6% (+5.91)#3,599 |
| 78. | Cordova | 15.4% | 10.0% (+5.48)#78 | 9.6% (+5.84)#3,649 |
| 79. | Heflin | 15.3% | 10.0% (+5.34)#79 | 9.6% (+5.70)#3,724 |
| 80. | Libertyville | 15.3% | 10.0% (+5.30)#80 | 9.6% (+5.66)#3,749 |
| 81. | Jackson | 15.2% | 10.0% (+5.22)#81 | 9.6% (+5.58)#3,797 |
| 82. | Rock Creek | 15.2% | 10.0% (+5.22)#82 | 9.6% (+5.58)#3,798 |
| 83. | Our Town | 15.1% | 10.0% (+5.12)#83 | 9.6% (+5.48)#3,883 |
| 84. | Double Springs | 15.0% | 10.0% (+5.05)#84 | 9.6% (+5.42)#3,928 |
| 85. | Eva | 15.0% | 10.0% (+5.03)#85 | 9.6% (+5.39)#3,943 |
| 86. | Shoal Creek | 15.0% | 10.0% (+5.02)#86 | 9.6% (+5.38)#3,950 |
| 87. | Avon | 14.9% | 10.0% (+4.97)#87 | 9.6% (+5.33)#3,989 |
| 88. | Summerdale | 14.9% | 10.0% (+4.95)#88 | 9.6% (+5.32)#3,999 |
| 89. | Oak Grove | 14.9% | 10.0% (+4.95)#89 | 9.6% (+5.31)#4,003 |
| 90. | Boligee | 14.9% | 10.0% (+4.94)#90 | 9.6% (+5.30)#4,009 |
| 91. | Reeltown | 14.9% | 10.0% (+4.91)#91 | 9.6% (+5.27)#4,031 |
| 92. | Deatsville | 14.7% | 10.0% (+4.73)#92 | 9.6% (+5.09)#4,165 |
| 93. | Gantt | 14.6% | 10.0% (+4.68)#93 | 9.6% (+5.04)#4,195 |
| 94. | Greensboro | 14.6% | 10.0% (+4.67)#94 | 9.6% (+5.03)#4,202 |
| 95. | Vandiver | 14.5% | 10.0% (+4.58)#95 | 9.6% (+4.94)#4,281 |
| 96. | Aliceville | 14.5% | 10.0% (+4.53)#96 | 9.6% (+4.89)#4,316 |
| 97. | Hazel Green | 14.5% | 10.0% (+4.52)#97 | 9.6% (+4.88)#4,324 |
| 98. | Maytown | 14.4% | 10.0% (+4.47)#98 | 9.6% (+4.83)#4,366 |
| 99. | Trafford | 14.4% | 10.0% (+4.45)#99 | 9.6% (+4.81)#4,379 |
| 100. | Livingston | 14.3% | 10.0% (+4.39)#100 | 9.6% (+4.75)#4,437 |
Common Questions
What are the Top 10 Cities with the Highest Percentage of Population Employed in Sales & Related in Alabama?
Top 10 Cities with the Highest Percentage of Population Employed in Sales & Related in Alabama are:
#1
100.0%
#2
100.0%
#3
100.0%
#4
58.6%
#5
44.4%
#6
44.3%
#7
40.7%
#8
40.2%
#9
36.4%
#10
35.7%
What city has the Highest Percentage of Population Employed in Sales & Related in Alabama?
St Stephens has the Highest Percentage of Population Employed in Sales & Related in Alabama with 100.0%.
What is the Percentage of Population Employed in Sales & Related in the State of Alabama?
Percentage of Population Employed in Sales & Related in Alabama is 10.0%.
What is the Percentage of Population Employed in Sales & Related in the United States?
Percentage of Population Employed in Sales & Related in the United States is 9.6%.