Cities with the Highest Percentage of Population Employed in Sales & Related in Montana
RELATED REPORTS & OPTIONS
Sales & Related
Montana
Compare Cities
Map of Cities with the Highest Percentage of Population Employed in Sales & Related in Montana
0.0%
100.0%
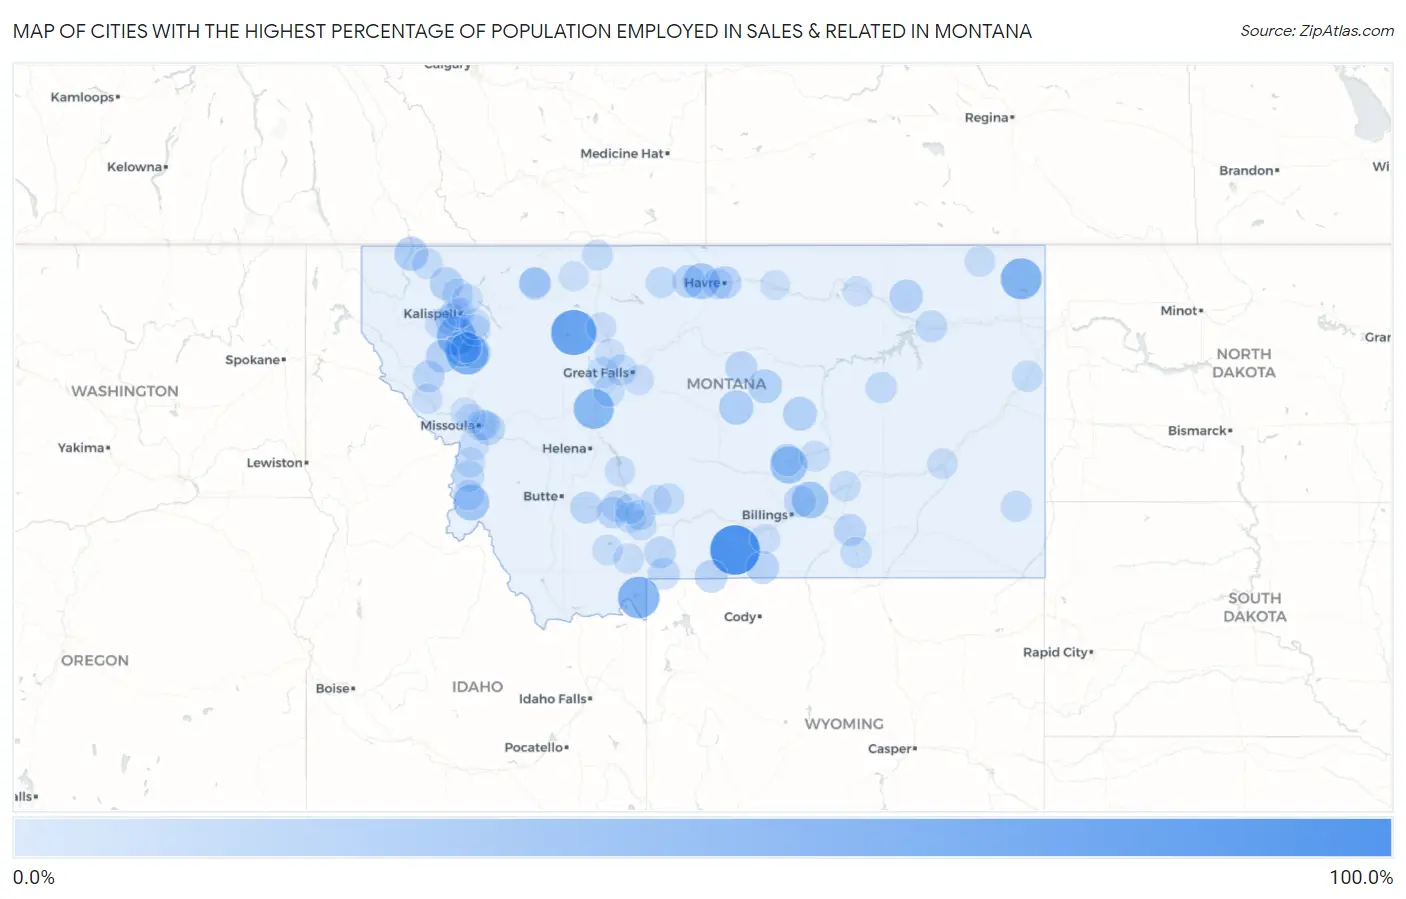
Cities with the Highest Percentage of Population Employed in Sales & Related in Montana
| City | % Employed | vs State | vs National | |
| 1. | Coffee Creek | 100.0% | 9.6% (+90.4)#1 | 9.6% (+90.4)#25 |
| 2. | Roscoe | 100.0% | 9.6% (+90.4)#2 | 9.6% (+90.4)#31 |
| 3. | Bynum | 80.0% | 9.6% (+70.4)#3 | 9.6% (+70.4)#50 |
| 4. | Rocky Point | 63.6% | 9.6% (+54.1)#4 | 9.6% (+54.0)#78 |
| 5. | Hebgen Lake Estates | 62.5% | 9.6% (+52.9)#5 | 9.6% (+52.9)#84 |
| 6. | Reserve | 60.0% | 9.6% (+50.4)#6 | 9.6% (+50.4)#99 |
| 7. | Craig | 56.5% | 9.6% (+46.9)#7 | 9.6% (+46.9)#118 |
| 8. | Lake Mary Ronan | 50.0% | 9.6% (+40.4)#8 | 9.6% (+40.4)#178 |
| 9. | Klein | 42.9% | 9.6% (+33.3)#9 | 9.6% (+33.3)#262 |
| 10. | Worden | 40.5% | 9.6% (+30.9)#10 | 9.6% (+30.9)#304 |
| 11. | Brandon | 40.0% | 9.6% (+30.4)#11 | 9.6% (+30.4)#315 |
| 12. | Big Arm | 38.6% | 9.6% (+29.0)#12 | 9.6% (+29.0)#339 |
| 13. | Kremlin | 38.5% | 9.6% (+28.9)#13 | 9.6% (+28.9)#345 |
| 14. | Conner | 38.1% | 9.6% (+28.5)#14 | 9.6% (+28.5)#357 |
| 15. | Gilman | 37.5% | 9.6% (+27.9)#15 | 9.6% (+27.9)#371 |
| 16. | Sapphire Ridge | 33.3% | 9.6% (+23.8)#16 | 9.6% (+23.7)#487 |
| 17. | Lewistown Heights | 30.7% | 9.6% (+21.1)#17 | 9.6% (+21.1)#596 |
| 18. | Rexford | 29.4% | 9.6% (+19.8)#18 | 9.6% (+19.8)#670 |
| 19. | Fox | 29.2% | 9.6% (+19.6)#19 | 9.6% (+19.6)#691 |
| 20. | Roy | 28.7% | 9.6% (+19.2)#20 | 9.6% (+19.1)#708 |
| 21. | Winnett | 28.6% | 9.6% (+19.0)#21 | 9.6% (+19.0)#726 |
| 22. | St Marie | 27.1% | 9.6% (+17.5)#22 | 9.6% (+17.5)#831 |
| 23. | Olney | 25.7% | 9.6% (+16.1)#23 | 9.6% (+16.1)#941 |
| 24. | Lonepine | 25.4% | 9.6% (+15.8)#24 | 9.6% (+15.8)#967 |
| 25. | Belfry | 24.4% | 9.6% (+14.8)#25 | 9.6% (+14.8)#1,075 |
| 26. | Cooke City | 23.9% | 9.6% (+14.3)#26 | 9.6% (+14.3)#1,119 |
| 27. | Gildford | 23.7% | 9.6% (+14.2)#27 | 9.6% (+14.1)#1,139 |
| 28. | Havre North | 23.5% | 9.6% (+13.9)#28 | 9.6% (+13.9)#1,160 |
| 29. | Homestead | 23.1% | 9.6% (+13.5)#29 | 9.6% (+13.5)#1,219 |
| 30. | Windham | 22.2% | 9.6% (+12.6)#30 | 9.6% (+12.6)#1,360 |
| 31. | Camp Three | 21.9% | 9.6% (+12.3)#31 | 9.6% (+12.3)#1,400 |
| 32. | Turah | 21.8% | 9.6% (+12.3)#32 | 9.6% (+12.2)#1,413 |
| 33. | Shepherd | 21.7% | 9.6% (+12.1)#33 | 9.6% (+12.1)#1,449 |
| 34. | Winifred | 21.6% | 9.6% (+12.0)#34 | 9.6% (+12.0)#1,471 |
| 35. | South Browning | 21.2% | 9.6% (+11.7)#35 | 9.6% (+11.6)#1,527 |
| 36. | Crow Agency | 21.1% | 9.6% (+11.5)#36 | 9.6% (+11.5)#1,557 |
| 37. | Finley Point | 20.9% | 9.6% (+11.3)#37 | 9.6% (+11.3)#1,589 |
| 38. | Whitehall | 20.9% | 9.6% (+11.3)#38 | 9.6% (+11.3)#1,601 |
| 39. | Plains | 20.7% | 9.6% (+11.1)#39 | 9.6% (+11.1)#1,634 |
| 40. | Kila | 20.6% | 9.6% (+11.0)#40 | 9.6% (+11.0)#1,655 |
| 41. | Gardiner | 20.3% | 9.6% (+10.7)#41 | 9.6% (+10.7)#1,721 |
| 42. | Batavia | 20.0% | 9.6% (+10.4)#42 | 9.6% (+10.4)#1,767 |
| 43. | South Glastonbury | 20.0% | 9.6% (+10.4)#43 | 9.6% (+10.4)#1,775 |
| 44. | Three Forks | 19.8% | 9.6% (+10.3)#44 | 9.6% (+10.3)#1,831 |
| 45. | Frazer | 19.8% | 9.6% (+10.2)#45 | 9.6% (+10.2)#1,837 |
| 46. | Willow Creek | 19.4% | 9.6% (+9.81)#46 | 9.6% (+9.79)#1,944 |
| 47. | Tracy | 18.8% | 9.6% (+9.17)#47 | 9.6% (+9.15)#2,139 |
| 48. | Jordan | 18.5% | 9.6% (+8.90)#48 | 9.6% (+8.88)#2,225 |
| 49. | Hamilton | 17.6% | 9.6% (+8.04)#49 | 9.6% (+8.02)#2,474 |
| 50. | Essex | 17.2% | 9.6% (+7.67)#50 | 9.6% (+7.65)#2,616 |
| 51. | Lodge Grass | 17.2% | 9.6% (+7.64)#51 | 9.6% (+7.62)#2,628 |
| 52. | Fort Shaw | 17.2% | 9.6% (+7.63)#52 | 9.6% (+7.61)#2,631 |
| 53. | Joplin | 17.1% | 9.6% (+7.53)#53 | 9.6% (+7.51)#2,676 |
| 54. | Savage | 16.8% | 9.6% (+7.18)#54 | 9.6% (+7.16)#2,845 |
| 55. | Browning | 16.7% | 9.6% (+7.09)#55 | 9.6% (+7.07)#2,877 |
| 56. | Wise River | 16.7% | 9.6% (+7.09)#56 | 9.6% (+7.07)#2,923 |
| 57. | Sun Prairie | 16.6% | 9.6% (+7.07)#57 | 9.6% (+7.05)#2,933 |
| 58. | Pine Creek | 16.3% | 9.6% (+6.67)#58 | 9.6% (+6.65)#3,125 |
| 59. | Amsterdam | 16.3% | 9.6% (+6.67)#59 | 9.6% (+6.65)#3,126 |
| 60. | Cascade | 16.2% | 9.6% (+6.65)#60 | 9.6% (+6.63)#3,140 |
| 61. | Ekalaka | 16.2% | 9.6% (+6.64)#61 | 9.6% (+6.62)#3,144 |
| 62. | Whitefish | 16.2% | 9.6% (+6.61)#62 | 9.6% (+6.59)#3,164 |
| 63. | Wilsall | 16.2% | 9.6% (+6.60)#63 | 9.6% (+6.58)#3,171 |
| 64. | Sunburst | 16.0% | 9.6% (+6.47)#64 | 9.6% (+6.45)#3,259 |
| 65. | Beaver Creek | 16.0% | 9.6% (+6.46)#65 | 9.6% (+6.44)#3,267 |
| 66. | Darby | 15.8% | 9.6% (+6.25)#66 | 9.6% (+6.23)#3,396 |
| 67. | Woods Bay | 15.8% | 9.6% (+6.18)#67 | 9.6% (+6.16)#3,447 |
| 68. | Fortine | 15.6% | 9.6% (+6.01)#68 | 9.6% (+5.99)#3,548 |
| 69. | Custer | 15.6% | 9.6% (+6.01)#69 | 9.6% (+5.99)#3,549 |
| 70. | Lindisfarne | 15.5% | 9.6% (+5.92)#70 | 9.6% (+5.90)#3,603 |
| 71. | Flaxville | 15.4% | 9.6% (+5.81)#71 | 9.6% (+5.79)#3,678 |
| 72. | Musselshell | 15.4% | 9.6% (+5.81)#72 | 9.6% (+5.79)#3,683 |
| 73. | King Arthur Park | 15.2% | 9.6% (+5.60)#73 | 9.6% (+5.58)#3,800 |
| 74. | Big Sky | 15.2% | 9.6% (+5.60)#74 | 9.6% (+5.58)#3,807 |
| 75. | Ennis | 15.0% | 9.6% (+5.46)#75 | 9.6% (+5.44)#3,908 |
| 76. | East Missoula | 14.9% | 9.6% (+5.36)#76 | 9.6% (+5.34)#3,979 |
| 77. | Belgrade | 14.9% | 9.6% (+5.32)#77 | 9.6% (+5.30)#4,006 |
| 78. | Miles City | 14.8% | 9.6% (+5.22)#78 | 9.6% (+5.20)#4,088 |
| 79. | Bonner West Riverside | 14.7% | 9.6% (+5.09)#79 | 9.6% (+5.07)#4,180 |
| 80. | Townsend | 14.6% | 9.6% (+5.05)#80 | 9.6% (+5.03)#4,205 |
| 81. | Manhattan | 14.6% | 9.6% (+5.01)#81 | 9.6% (+4.99)#4,236 |
| 82. | Florence | 14.4% | 9.6% (+4.85)#82 | 9.6% (+4.83)#4,364 |
| 83. | Superior | 14.3% | 9.6% (+4.71)#83 | 9.6% (+4.69)#4,475 |
| 84. | St. Mary | 14.3% | 9.6% (+4.71)#84 | 9.6% (+4.69)#4,492 |
| 85. | Rhodes | 14.2% | 9.6% (+4.58)#85 | 9.6% (+4.56)#4,639 |
| 86. | Marion | 14.0% | 9.6% (+4.43)#86 | 9.6% (+4.41)#4,769 |
| 87. | Victor | 14.0% | 9.6% (+4.42)#87 | 9.6% (+4.40)#4,772 |
| 88. | Brady | 14.0% | 9.6% (+4.38)#88 | 9.6% (+4.36)#4,810 |
| 89. | Sand Coulee | 13.8% | 9.6% (+4.25)#89 | 9.6% (+4.23)#4,934 |
| 90. | Kalispell | 13.7% | 9.6% (+4.11)#90 | 9.6% (+4.09)#5,064 |
| 91. | Bigfork | 13.3% | 9.6% (+3.73)#91 | 9.6% (+3.71)#5,501 |
| 92. | Joliet | 13.2% | 9.6% (+3.65)#92 | 9.6% (+3.63)#5,586 |
| 93. | Sedan | 13.2% | 9.6% (+3.58)#93 | 9.6% (+3.56)#5,687 |
| 94. | Columbia Falls | 13.0% | 9.6% (+3.40)#94 | 9.6% (+3.38)#5,916 |
| 95. | Cut Bank | 12.8% | 9.6% (+3.26)#95 | 9.6% (+3.24)#6,119 |
| 96. | Wye | 12.7% | 9.6% (+3.09)#96 | 9.6% (+3.07)#6,353 |
| 97. | Power | 12.5% | 9.6% (+2.92)#97 | 9.6% (+2.90)#6,587 |
| 98. | Saco | 12.5% | 9.6% (+2.92)#98 | 9.6% (+2.90)#6,590 |
| 99. | Frenchtown | 12.5% | 9.6% (+2.89)#99 | 9.6% (+2.87)#6,651 |
| 100. | Harlem | 12.4% | 9.6% (+2.78)#100 | 9.6% (+2.76)#6,760 |
Common Questions
What are the Top 10 Cities with the Highest Percentage of Population Employed in Sales & Related in Montana?
Top 10 Cities with the Highest Percentage of Population Employed in Sales & Related in Montana are:
#1
100.0%
#2
80.0%
#3
63.6%
#4
62.5%
#5
60.0%
#6
56.5%
#7
50.0%
#8
42.9%
#9
40.5%
#10
38.6%
What city has the Highest Percentage of Population Employed in Sales & Related in Montana?
Roscoe has the Highest Percentage of Population Employed in Sales & Related in Montana with 100.0%.
What is the Percentage of Population Employed in Sales & Related in the State of Montana?
Percentage of Population Employed in Sales & Related in Montana is 9.6%.
What is the Percentage of Population Employed in Sales & Related in the United States?
Percentage of Population Employed in Sales & Related in the United States is 9.6%.