Cities with the Highest Percentage of Population Employed in Sales & Related in Delaware
RELATED REPORTS & OPTIONS
Sales & Related
Delaware
Compare Cities
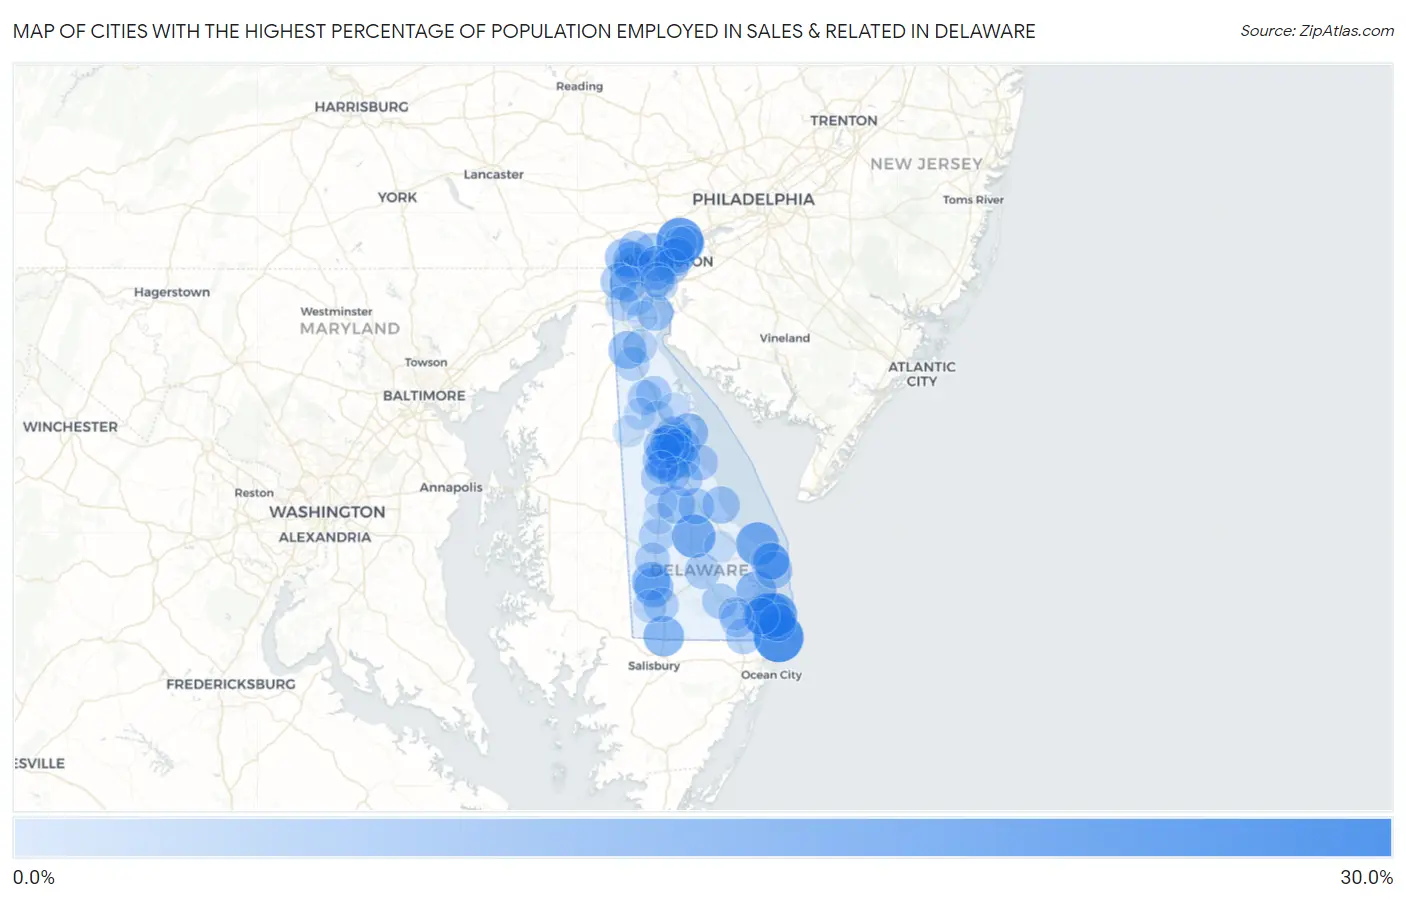
Map of Cities with the Highest Percentage of Population Employed in Sales & Related in Delaware
0.0%
30.0%
Cities with the Highest Percentage of Population Employed in Sales & Related in Delaware
| City | % Employed | vs State | vs National | |
| 1. | Fenwick Island | 29.9% | 9.1%(+20.8)#1 | 9.6%(+20.3)#642 |
| 2. | Arden | 25.4% | 9.1%(+16.4)#2 | 9.6%(+15.8)#961 |
| 3. | Ocean View | 24.6% | 9.1%(+15.6)#3 | 9.6%(+15.0)#1,046 |
| 4. | Bethany Beach | 21.7% | 9.1%(+12.7)#4 | 9.6%(+12.1)#1,436 |
| 5. | Ellendale | 20.2% | 9.1%(+11.1)#5 | 9.6%(+10.6)#1,730 |
| 6. | Lewes | 19.7% | 9.1%(+10.6)#6 | 9.6%(+10.1)#1,854 |
| 7. | Woodside East | 16.2% | 9.1%(+7.13)#7 | 9.6%(+6.60)#3,157 |
| 8. | Delmar | 16.0% | 9.1%(+6.89)#8 | 9.6%(+6.36)#3,318 |
| 9. | Long Neck | 15.7% | 9.1%(+6.64)#9 | 9.6%(+6.11)#3,477 |
| 10. | Kent Acres | 15.3% | 9.1%(+6.22)#10 | 9.6%(+5.70)#3,729 |
| 11. | Newport | 14.8% | 9.1%(+5.72)#11 | 9.6%(+5.19)#4,094 |
| 12. | Blades | 13.8% | 9.1%(+4.75)#12 | 9.6%(+4.22)#4,938 |
| 13. | Lincoln | 13.5% | 9.1%(+4.40)#13 | 9.6%(+3.87)#5,293 |
| 14. | Little Creek | 13.2% | 9.1%(+4.17)#14 | 9.6%(+3.64)#5,575 |
| 15. | Seaford | 13.0% | 9.1%(+3.88)#15 | 9.6%(+3.36)#5,950 |
| 16. | Rehoboth Beach | 12.5% | 9.1%(+3.41)#16 | 9.6%(+2.88)#6,628 |
| 17. | Dover Base Housing | 12.1% | 9.1%(+3.08)#17 | 9.6%(+2.55)#7,063 |
| 18. | Middletown | 11.9% | 9.1%(+2.79)#18 | 9.6%(+2.26)#7,493 |
| 19. | South Bethany | 11.8% | 9.1%(+2.74)#19 | 9.6%(+2.21)#7,577 |
| 20. | Edgemoor | 11.7% | 9.1%(+2.63)#20 | 9.6%(+2.10)#7,756 |
| 21. | North Star | 11.5% | 9.1%(+2.43)#21 | 9.6%(+1.90)#8,119 |
| 22. | Pike Creek Valley | 11.4% | 9.1%(+2.33)#22 | 9.6%(+1.81)#8,324 |
| 23. | Houston | 11.1% | 9.1%(+2.04)#23 | 9.6%(+1.52)#8,873 |
| 24. | Dewey Beach | 11.0% | 9.1%(+1.92)#24 | 9.6%(+1.39)#9,132 |
| 25. | Slaughter Beach | 10.9% | 9.1%(+1.85)#25 | 9.6%(+1.32)#9,260 |
| 26. | Woodside | 10.7% | 9.1%(+1.65)#26 | 9.6%(+1.12)#9,672 |
| 27. | Wyoming | 10.7% | 9.1%(+1.63)#27 | 9.6%(+1.10)#9,708 |
| 28. | Pike Creek | 10.7% | 9.1%(+1.59)#28 | 9.6%(+1.06)#9,809 |
| 29. | Dover | 10.3% | 9.1%(+1.27)#29 | 9.6%(+0.743)#10,490 |
| 30. | Rising Sun Lebanon | 10.2% | 9.1%(+1.18)#30 | 9.6%(+0.652)#10,689 |
| 31. | Delaware City | 10.0% | 9.1%(+0.944)#31 | 9.6%(+0.416)#11,255 |
| 32. | Millville | 9.9% | 9.1%(+0.858)#32 | 9.6%(+0.330)#11,500 |
| 33. | Greenville | 9.9% | 9.1%(+0.787)#33 | 9.6%(+0.259)#11,659 |
| 34. | Newark | 9.8% | 9.1%(+0.683)#34 | 9.6%(+0.155)#11,919 |
| 35. | Claymont | 9.7% | 9.1%(+0.611)#35 | 9.6%(+0.083)#12,072 |
| 36. | Henlopen Acres | 9.4% | 9.1%(+0.308)#36 | 9.6%(-0.220)#12,866 |
| 37. | Brookside | 9.4% | 9.1%(+0.308)#37 | 9.6%(-0.220)#12,874 |
| 38. | Milford | 9.1% | 9.1%(+0.070)#38 | 9.6%(-0.458)#13,450 |
| 39. | Bellefonte | 8.8% | 9.1%(-0.218)#39 | 9.6%(-0.747)#14,202 |
| 40. | Bowers | 8.8% | 9.1%(-0.243)#40 | 9.6%(-0.772)#14,259 |
| 41. | Hockessin | 8.8% | 9.1%(-0.285)#41 | 9.6%(-0.813)#14,372 |
| 42. | Felton | 8.7% | 9.1%(-0.324)#42 | 9.6%(-0.852)#14,468 |
| 43. | Elsmere | 8.6% | 9.1%(-0.514)#43 | 9.6%(-1.04)#14,942 |
| 44. | Selbyville | 8.6% | 9.1%(-0.515)#44 | 9.6%(-1.04)#14,945 |
| 45. | Millsboro | 8.3% | 9.1%(-0.718)#45 | 9.6%(-1.25)#15,459 |
| 46. | Georgetown | 8.1% | 9.1%(-0.948)#46 | 9.6%(-1.48)#16,058 |
| 47. | Magnolia | 8.0% | 9.1%(-1.02)#47 | 9.6%(-1.55)#16,240 |
| 48. | Smyrna | 8.0% | 9.1%(-1.06)#48 | 9.6%(-1.59)#16,336 |
| 49. | Frederica | 7.9% | 9.1%(-1.22)#49 | 9.6%(-1.74)#16,701 |
| 50. | Greenwood | 7.6% | 9.1%(-1.43)#50 | 9.6%(-1.96)#17,230 |
| 51. | Wilmington | 7.5% | 9.1%(-1.56)#51 | 9.6%(-2.09)#17,551 |
| 52. | Laurel | 7.4% | 9.1%(-1.66)#52 | 9.6%(-2.19)#17,803 |
| 53. | Highland Acres | 7.4% | 9.1%(-1.70)#53 | 9.6%(-2.23)#17,870 |
| 54. | Bridgeville | 7.3% | 9.1%(-1.75)#54 | 9.6%(-2.27)#17,983 |
| 55. | Clayton | 7.3% | 9.1%(-1.75)#55 | 9.6%(-2.28)#17,985 |
| 56. | Camden | 7.3% | 9.1%(-1.79)#56 | 9.6%(-2.32)#18,084 |
| 57. | Frankford | 7.2% | 9.1%(-1.88)#57 | 9.6%(-2.41)#18,276 |
| 58. | Wilmington Manor | 7.2% | 9.1%(-1.88)#58 | 9.6%(-2.41)#18,277 |
| 59. | Rodney Village | 6.9% | 9.1%(-2.12)#59 | 9.6%(-2.65)#18,808 |
| 60. | Townsend | 6.3% | 9.1%(-2.75)#60 | 9.6%(-3.28)#20,145 |
| 61. | Bear | 6.2% | 9.1%(-2.85)#61 | 9.6%(-3.37)#20,348 |
| 62. | Ardencroft | 6.1% | 9.1%(-2.93)#62 | 9.6%(-3.45)#20,509 |
| 63. | Glasgow | 6.1% | 9.1%(-2.94)#63 | 9.6%(-3.47)#20,534 |
| 64. | Odessa | 6.0% | 9.1%(-3.04)#64 | 9.6%(-3.57)#20,728 |
| 65. | New Castle | 5.8% | 9.1%(-3.32)#65 | 9.6%(-3.84)#21,240 |
| 66. | Dagsboro | 5.2% | 9.1%(-3.83)#66 | 9.6%(-4.36)#22,124 |
| 67. | Bethel | 5.0% | 9.1%(-4.02)#67 | 9.6%(-4.55)#22,465 |
| 68. | Cheswold | 5.0% | 9.1%(-4.09)#68 | 9.6%(-4.62)#22,570 |
| 69. | Riverview | 5.0% | 9.1%(-4.11)#69 | 9.6%(-4.64)#22,606 |
| 70. | Viola | 4.9% | 9.1%(-4.19)#70 | 9.6%(-4.72)#22,721 |
| 71. | Harrington | 4.0% | 9.1%(-5.03)#71 | 9.6%(-5.56)#23,980 |
| 72. | Kenton | 3.6% | 9.1%(-5.45)#72 | 9.6%(-5.98)#24,524 |
| 73. | Leipsic | 3.4% | 9.1%(-5.70)#73 | 9.6%(-6.22)#24,795 |
| 74. | Hartly | 2.9% | 9.1%(-6.17)#74 | 9.6%(-6.70)#25,301 |
| 75. | Milton | 2.8% | 9.1%(-6.24)#75 | 9.6%(-6.77)#25,375 |
| 76. | Farmington | 2.3% | 9.1%(-6.79)#76 | 9.6%(-7.32)#25,873 |
| 77. | St Georges | 1.2% | 9.1%(-7.85)#77 | 9.6%(-8.38)#26,548 |
1
Common Questions
What are the Top 10 Cities with the Highest Percentage of Population Employed in Sales & Related in Delaware?
Top 10 Cities with the Highest Percentage of Population Employed in Sales & Related in Delaware are:
#1
29.9%
#2
25.4%
#3
24.6%
#4
21.7%
#5
20.2%
#6
19.7%
#7
16.2%
#8
16.0%
#9
15.7%
#10
15.3%
What city has the Highest Percentage of Population Employed in Sales & Related in Delaware?
Fenwick Island has the Highest Percentage of Population Employed in Sales & Related in Delaware with 29.9%.
What is the Percentage of Population Employed in Sales & Related in the State of Delaware?
Percentage of Population Employed in Sales & Related in Delaware is 9.1%.
What is the Percentage of Population Employed in Sales & Related in the United States?
Percentage of Population Employed in Sales & Related in the United States is 9.6%.