Zip Codes with the Highest Percentage of Population Employed in Sales & Related in Richland, WA
RELATED REPORTS & OPTIONS
Sales & Related
Richland
Compare Zip Codes
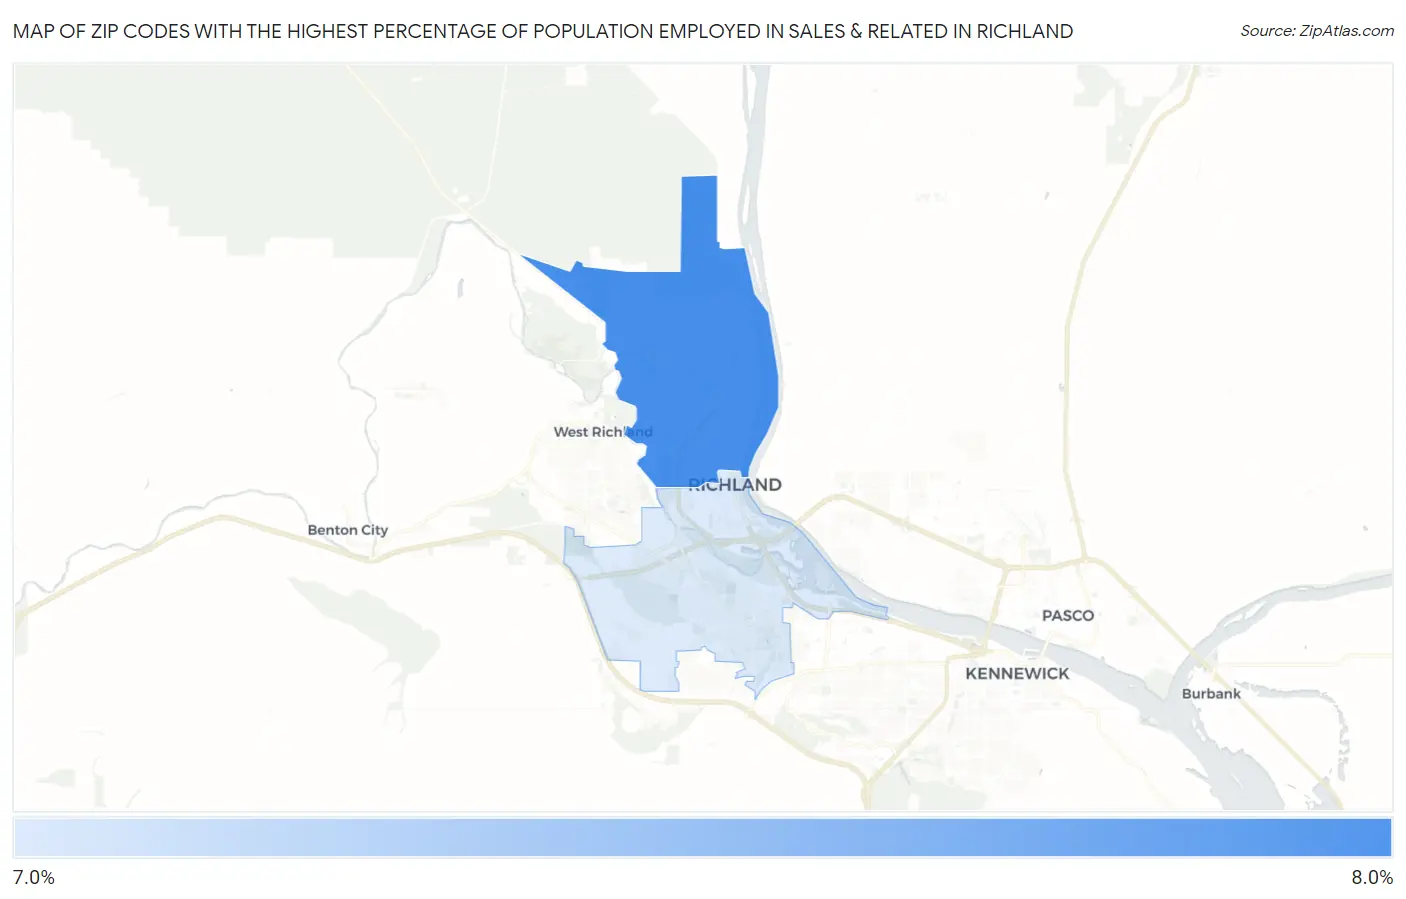
Map of Zip Codes with the Highest Percentage of Population Employed in Sales & Related in Richland
7.3%
7.7%
Zip Codes with the Highest Percentage of Population Employed in Sales & Related in Richland, WA
| Zip Code | % Employed | vs State | vs National | |
| 1. | 99354 | 7.7% | 8.8%(-1.10)#323 | 9.6%(-1.90)#18,995 |
| 2. | 99352 | 7.3% | 8.8%(-1.45)#347 | 9.6%(-2.25)#20,155 |
1
Common Questions
What are the Top Zip Codes with the Highest Percentage of Population Employed in Sales & Related in Richland, WA?
Top Zip Codes with the Highest Percentage of Population Employed in Sales & Related in Richland, WA are:
What zip code has the Highest Percentage of Population Employed in Sales & Related in Richland, WA?
99354 has the Highest Percentage of Population Employed in Sales & Related in Richland, WA with 7.7%.
What is the Percentage of Population Employed in Sales & Related in Richland, WA?
Percentage of Population Employed in Sales & Related in Richland is 7.5%.
What is the Percentage of Population Employed in Sales & Related in Washington?
Percentage of Population Employed in Sales & Related in Washington is 8.8%.
What is the Percentage of Population Employed in Sales & Related in the United States?
Percentage of Population Employed in Sales & Related in the United States is 9.6%.