States with the Highest Percentage of Population Employed in Sales & Related
RELATED REPORTS & OPTIONS
Sales & Related
United States
Compare States
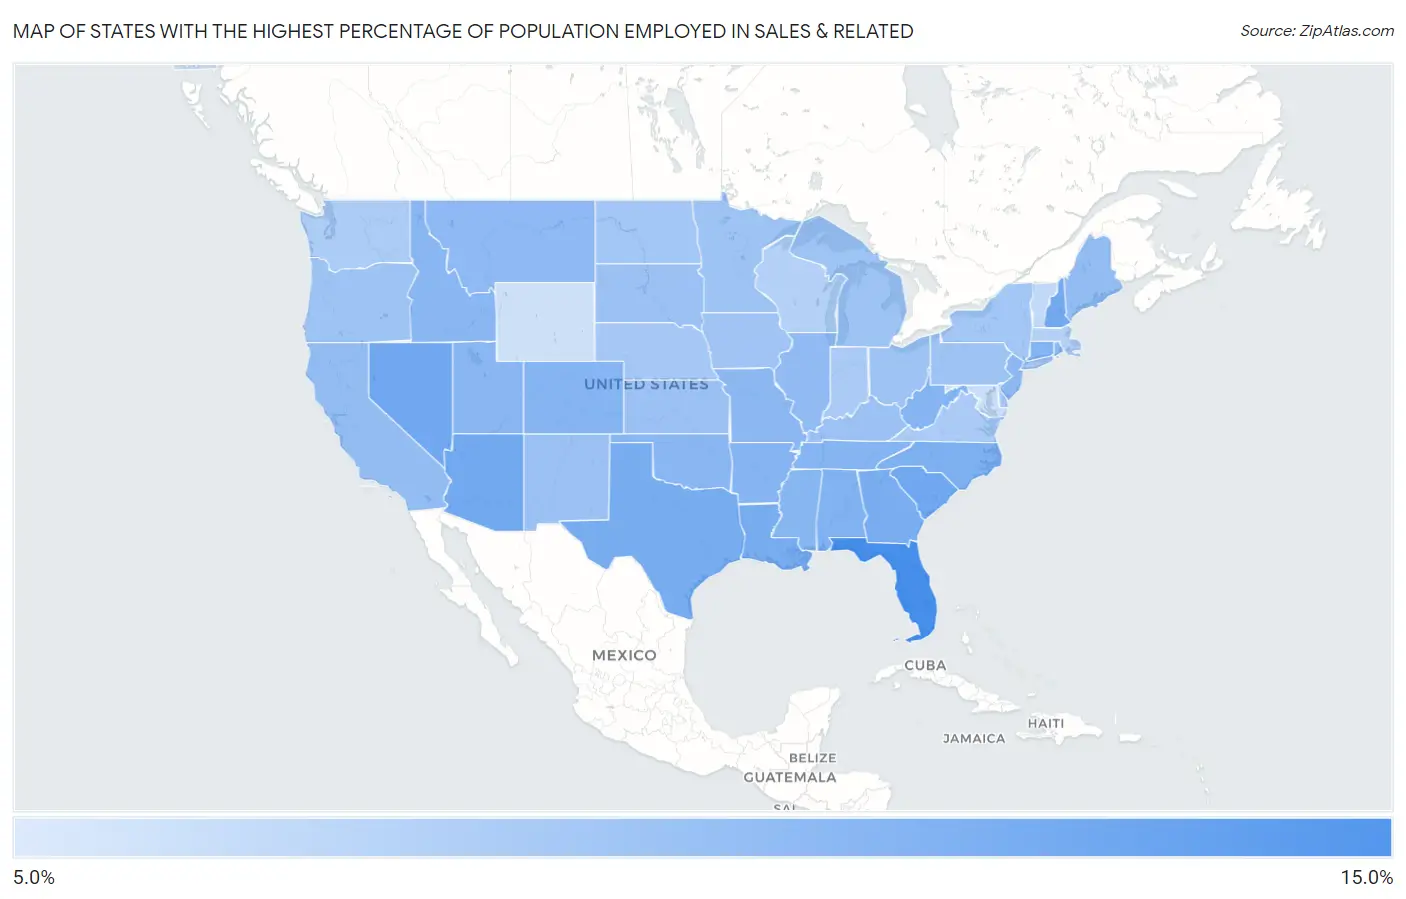
Map of States with the Highest Percentage of Population Employed in Sales & Related
5.0%
15.0%
States with the Highest Percentage of Population Employed in Sales & Related in the United States
| State | % Employed | vs State Median | vs National | |
| 1. | Florida | 11.5% | 9.5% (+2.00) | 9.6%(+1.93) |
| 2. | Nevada | 10.4% | 9.5% (+0.903) | 9.6%(+0.826) |
| 3. | South Carolina | 10.4% | 9.5% (+0.862) | 9.6%(+0.786) |
| 4. | New Hampshire | 10.3% | 9.5% (+0.828) | 9.6%(+0.751) |
| 5. | Arizona | 10.3% | 9.5% (+0.826) | 9.6%(+0.750) |
| 6. | Texas | 10.2% | 9.5% (+0.705) | 9.6%(+0.629) |
| 7. | Louisiana | 10.2% | 9.5% (+0.700) | 9.6%(+0.623) |
| 8. | Georgia | 10.2% | 9.5% (+0.638) | 9.6%(+0.562) |
| 9. | Hawaii | 10.1% | 9.5% (+0.557) | 9.6%(+0.481) |
| 10. | North Carolina | 10.0% | 9.5% (+0.511) | 9.6%(+0.434) |
| 11. | Alabama | 10.0% | 9.5% (+0.438) | 9.6%(+0.361) |
| 12. | Colorado | 9.9% | 9.5% (+0.356) | 9.6%(+0.280) |
| 13. | Connecticut | 9.9% | 9.5% (+0.351) | 9.6%(+0.275) |
| 14. | Tennessee | 9.8% | 9.5% (+0.315) | 9.6%(+0.239) |
| 15. | West Virginia | 9.8% | 9.5% (+0.312) | 9.6%(+0.235) |
| 16. | Arkansas | 9.8% | 9.5% (+0.302) | 9.6%(+0.225) |
| 17. | Mississippi | 9.8% | 9.5% (+0.260) | 9.6%(+0.183) |
| 18. | Utah | 9.7% | 9.5% (+0.216) | 9.6%(+0.140) |
| 19. | Oklahoma | 9.7% | 9.5% (+0.198) | 9.6%(+0.122) |
| 20. | Idaho | 9.7% | 9.5% (+0.178) | 9.6%(+0.101) |
| 21. | Missouri | 9.7% | 9.5% (+0.165) | 9.6%(+0.088) |
| 22. | New Jersey | 9.6% | 9.5% (+0.127) | 9.6%(+0.051) |
| 23. | Rhode Island | 9.6% | 9.5% (+0.059) | 9.6%(-0.017) |
| 24. | Montana | 9.6% | 9.5% (+0.056) | 9.6%(-0.020) |
| 25. | Illinois | 9.6% | 9.5% (+0.043) | 9.6%(-0.033) |
| 26. | Maine | 9.5% | 9.5% (-0.043) | 9.6%(-0.120) |
| 27. | California | 9.4% | 9.5% (-0.071) | 9.6%(-0.148) |
| 28. | South Dakota | 9.3% | 9.5% (-0.236) | 9.6%(-0.312) |
| 29. | Kansas | 9.3% | 9.5% (-0.244) | 9.6%(-0.320) |
| 30. | New Mexico | 9.3% | 9.5% (-0.254) | 9.6%(-0.330) |
| 31. | Kentucky | 9.2% | 9.5% (-0.306) | 9.6%(-0.382) |
| 32. | Oregon | 9.2% | 9.5% (-0.353) | 9.6%(-0.429) |
| 33. | Ohio | 9.1% | 9.5% (-0.376) | 9.6%(-0.453) |
| 34. | Minnesota | 9.1% | 9.5% (-0.378) | 9.6%(-0.454) |
| 35. | Pennsylvania | 9.1% | 9.5% (-0.378) | 9.6%(-0.454) |
| 36. | Michigan | 9.1% | 9.5% (-0.381) | 9.6%(-0.457) |
| 37. | Iowa | 9.1% | 9.5% (-0.416) | 9.6%(-0.492) |
| 38. | Delaware | 9.1% | 9.5% (-0.452) | 9.6%(-0.528) |
| 39. | North Dakota | 9.0% | 9.5% (-0.486) | 9.6%(-0.562) |
| 40. | New York | 9.0% | 9.5% (-0.494) | 9.6%(-0.570) |
| 41. | Nebraska | 9.0% | 9.5% (-0.545) | 9.6%(-0.622) |
| 42. | Virginia | 8.8% | 9.5% (-0.677) | 9.6%(-0.753) |
| 43. | Indiana | 8.8% | 9.5% (-0.678) | 9.6%(-0.755) |
| 44. | Washington | 8.8% | 9.5% (-0.727) | 9.6%(-0.803) |
| 45. | Wisconsin | 8.6% | 9.5% (-0.871) | 9.6%(-0.948) |
| 46. | Massachusetts | 8.6% | 9.5% (-0.901) | 9.6%(-0.977) |
| 47. | Vermont | 8.2% | 9.5% (-1.27) | 9.6%(-1.35) |
| 48. | Maryland | 8.0% | 9.5% (-1.53) | 9.6%(-1.61) |
| 49. | Wyoming | 7.9% | 9.5% (-1.65) | 9.6%(-1.72) |
| 50. | Alaska | 7.5% | 9.5% (-1.99) | 9.6%(-2.07) |
1
Common Questions
What are the Top 10 States with the Highest Percentage of Population Employed in Sales & Related in the United States?
Top 10 States with the Highest Percentage of Population Employed in Sales & Related in the United States are:
#1
11.5%
#2
10.4%
#3
10.4%
#4
10.3%
#5
10.3%
#6
10.2%
#7
10.2%
#8
10.2%
#9
10.1%
#10
10.0%
What state has the Highest Percentage of Population Employed in Sales & Related in the United States?
Florida has the Highest Percentage of Population Employed in Sales & Related in the United States with 11.5%.
What is the Percentage of Population Employed in Sales & Related in the United States?
Percentage of Population Employed in Sales & Related in the United States is 9.6%.