Cities with the Highest Percentage of Population Employed in Sales & Related in South Carolina
RELATED REPORTS & OPTIONS
Sales & Related
South Carolina
Compare Cities
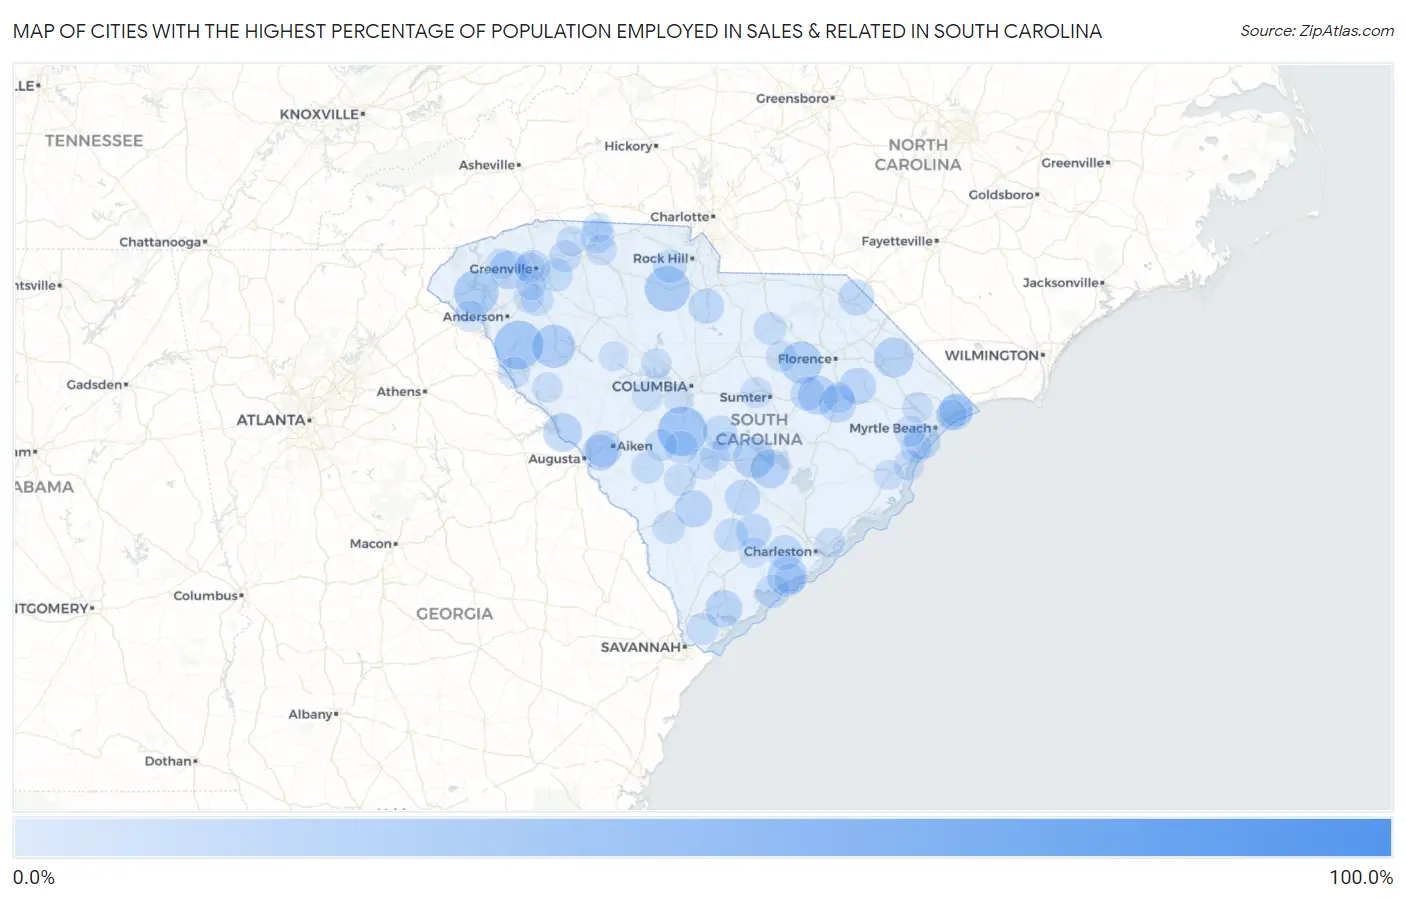
Map of Cities with the Highest Percentage of Population Employed in Sales & Related in South Carolina
0.0%
100.0%
Cities with the Highest Percentage of Population Employed in Sales & Related in South Carolina
| City | % Employed | vs State | vs National | |
| 1. | Cherokee Falls | 100.0% | 10.4%(+89.6)#1 | 9.6%(+90.4)#28 |
| 2. | Ketchuptown | 100.0% | 10.4%(+89.6)#2 | 9.6%(+90.4)#43 |
| 3. | Foreston | 43.3% | 10.4%(+33.0)#3 | 9.6%(+33.7)#259 |
| 4. | Woodford | 38.8% | 10.4%(+28.4)#4 | 9.6%(+29.2)#335 |
| 5. | Antreville | 38.2% | 10.4%(+27.8)#5 | 9.6%(+28.6)#356 |
| 6. | Pimlico | 33.8% | 10.4%(+23.4)#6 | 9.6%(+24.2)#461 |
| 7. | Gayle Mill | 33.8% | 10.4%(+23.4)#7 | 9.6%(+24.2)#462 |
| 8. | Utica | 32.6% | 10.4%(+22.2)#8 | 9.6%(+23.0)#508 |
| 9. | Hodges | 30.5% | 10.4%(+20.1)#9 | 9.6%(+20.9)#602 |
| 10. | Sheldon | 29.6% | 10.4%(+19.2)#10 | 9.6%(+20.0)#662 |
| 11. | Lamar | 29.1% | 10.4%(+18.7)#11 | 9.6%(+19.5)#696 |
| 12. | Dacusville | 28.6% | 10.4%(+18.2)#12 | 9.6%(+19.0)#725 |
| 13. | Olympia | 28.1% | 10.4%(+17.7)#13 | 9.6%(+18.5)#761 |
| 14. | Santee | 28.1% | 10.4%(+17.7)#14 | 9.6%(+18.5)#765 |
| 15. | Daviston | 28.0% | 10.4%(+17.6)#15 | 9.6%(+18.4)#772 |
| 16. | St. Charles | 27.8% | 10.4%(+17.4)#16 | 9.6%(+18.2)#784 |
| 17. | Rockville | 26.8% | 10.4%(+16.4)#17 | 9.6%(+17.2)#847 |
| 18. | Mullins | 26.4% | 10.4%(+16.0)#18 | 9.6%(+16.8)#878 |
| 19. | The Cliffs Valley | 26.2% | 10.4%(+15.8)#19 | 9.6%(+16.6)#899 |
| 20. | Olanta | 25.1% | 10.4%(+14.7)#20 | 9.6%(+15.5)#987 |
| 21. | Eutawville | 25.0% | 10.4%(+14.6)#21 | 9.6%(+15.4)#993 |
| 22. | Clarks Hill | 25.0% | 10.4%(+14.6)#22 | 9.6%(+15.4)#1,004 |
| 23. | Arial | 24.6% | 10.4%(+14.3)#23 | 9.6%(+15.1)#1,044 |
| 24. | Finklea | 24.4% | 10.4%(+14.0)#24 | 9.6%(+14.8)#1,074 |
| 25. | Newtown | 23.6% | 10.4%(+13.2)#25 | 9.6%(+14.0)#1,147 |
| 26. | Lake City | 23.0% | 10.4%(+12.6)#26 | 9.6%(+13.4)#1,230 |
| 27. | Ehrhardt | 22.9% | 10.4%(+12.5)#27 | 9.6%(+13.3)#1,246 |
| 28. | Port Royal | 22.7% | 10.4%(+12.3)#28 | 9.6%(+13.1)#1,284 |
| 29. | Pamplico | 22.5% | 10.4%(+12.1)#29 | 9.6%(+12.9)#1,311 |
| 30. | Warrenville | 22.0% | 10.4%(+11.6)#30 | 9.6%(+12.4)#1,382 |
| 31. | Tatum | 21.4% | 10.4%(+11.0)#31 | 9.6%(+11.8)#1,498 |
| 32. | Lobeco | 21.2% | 10.4%(+10.9)#32 | 9.6%(+11.6)#1,528 |
| 33. | Langley | 21.2% | 10.4%(+10.8)#33 | 9.6%(+11.6)#1,536 |
| 34. | Garden City | 21.1% | 10.4%(+10.7)#34 | 9.6%(+11.5)#1,556 |
| 35. | St George | 20.8% | 10.4%(+10.4)#35 | 9.6%(+11.2)#1,622 |
| 36. | Buford | 20.5% | 10.4%(+10.2)#36 | 9.6%(+10.9)#1,665 |
| 37. | Great Falls | 20.4% | 10.4%(+10.0)#37 | 9.6%(+10.8)#1,692 |
| 38. | Atlantic Beach | 20.3% | 10.4%(+9.97)#38 | 9.6%(+10.8)#1,704 |
| 39. | City View | 20.3% | 10.4%(+9.93)#39 | 9.6%(+10.7)#1,708 |
| 40. | Cottageville | 20.1% | 10.4%(+9.76)#40 | 9.6%(+10.6)#1,745 |
| 41. | Ravenel | 20.1% | 10.4%(+9.76)#41 | 9.6%(+10.5)#1,746 |
| 42. | Clemson University | 19.2% | 10.4%(+8.81)#42 | 9.6%(+9.59)#2,007 |
| 43. | Carolina Forest | 19.2% | 10.4%(+8.78)#43 | 9.6%(+9.57)#2,016 |
| 44. | Shiloh | 19.0% | 10.4%(+8.67)#44 | 9.6%(+9.45)#2,041 |
| 45. | Abney Crossroads | 19.0% | 10.4%(+8.67)#45 | 9.6%(+9.45)#2,047 |
| 46. | Debordieu Colony | 18.9% | 10.4%(+8.49)#46 | 9.6%(+9.27)#2,102 |
| 47. | Rains | 18.8% | 10.4%(+8.44)#47 | 9.6%(+9.23)#2,115 |
| 48. | St Matthews | 18.7% | 10.4%(+8.32)#48 | 9.6%(+9.11)#2,156 |
| 49. | Arthurtown | 18.6% | 10.4%(+8.19)#49 | 9.6%(+8.97)#2,193 |
| 50. | Edisto Beach | 18.3% | 10.4%(+7.94)#50 | 9.6%(+8.72)#2,259 |
| 51. | Walterboro | 18.3% | 10.4%(+7.90)#51 | 9.6%(+8.69)#2,271 |
| 52. | Mcconnells | 18.2% | 10.4%(+7.86)#52 | 9.6%(+8.64)#2,283 |
| 53. | Mayo | 18.2% | 10.4%(+7.78)#53 | 9.6%(+8.57)#2,313 |
| 54. | Wisacky | 17.6% | 10.4%(+7.27)#54 | 9.6%(+8.05)#2,459 |
| 55. | Livingston | 17.6% | 10.4%(+7.27)#55 | 9.6%(+8.05)#2,461 |
| 56. | Five Forks | 17.6% | 10.4%(+7.26)#56 | 9.6%(+8.05)#2,468 |
| 57. | North Myrtle Beach | 17.6% | 10.4%(+7.19)#57 | 9.6%(+7.97)#2,483 |
| 58. | Bethune | 16.9% | 10.4%(+6.51)#58 | 9.6%(+7.30)#2,778 |
| 59. | Fairfax | 16.8% | 10.4%(+6.37)#59 | 9.6%(+7.16)#2,844 |
| 60. | Centenary | 16.7% | 10.4%(+6.29)#60 | 9.6%(+7.07)#2,879 |
| 61. | Williston | 16.5% | 10.4%(+6.09)#61 | 9.6%(+6.87)#3,006 |
| 62. | Ware Place | 16.3% | 10.4%(+5.95)#62 | 9.6%(+6.73)#3,078 |
| 63. | Denmark | 16.3% | 10.4%(+5.88)#63 | 9.6%(+6.67)#3,118 |
| 64. | Salley | 16.2% | 10.4%(+5.84)#64 | 9.6%(+6.62)#3,146 |
| 65. | Duncan | 16.2% | 10.4%(+5.82)#65 | 9.6%(+6.60)#3,156 |
| 66. | Calhoun Falls | 15.9% | 10.4%(+5.49)#66 | 9.6%(+6.28)#3,372 |
| 67. | Fripp Island | 15.8% | 10.4%(+5.46)#67 | 9.6%(+6.25)#3,384 |
| 68. | Fair Play | 15.8% | 10.4%(+5.46)#68 | 9.6%(+6.25)#3,385 |
| 69. | Bluffton | 15.8% | 10.4%(+5.41)#69 | 9.6%(+6.20)#3,409 |
| 70. | Scranton | 15.5% | 10.4%(+5.16)#70 | 9.6%(+5.95)#3,584 |
| 71. | Cordova | 15.5% | 10.4%(+5.10)#71 | 9.6%(+5.88)#3,622 |
| 72. | Murrells Inlet | 15.4% | 10.4%(+5.03)#72 | 9.6%(+5.82)#3,657 |
| 73. | Cherryvale | 15.3% | 10.4%(+4.96)#73 | 9.6%(+5.75)#3,702 |
| 74. | Bishopville | 15.2% | 10.4%(+4.86)#74 | 9.6%(+5.65)#3,758 |
| 75. | Clifton | 15.1% | 10.4%(+4.70)#75 | 9.6%(+5.48)#3,881 |
| 76. | Litchfield Beach | 15.0% | 10.4%(+4.58)#76 | 9.6%(+5.36)#3,965 |
| 77. | Bucksport | 14.8% | 10.4%(+4.42)#77 | 9.6%(+5.21)#4,083 |
| 78. | Fairview Crossroads | 14.7% | 10.4%(+4.34)#78 | 9.6%(+5.13)#4,134 |
| 79. | Seabrook Island | 14.7% | 10.4%(+4.27)#79 | 9.6%(+5.06)#4,187 |
| 80. | Briarcliffe Acres | 14.6% | 10.4%(+4.21)#80 | 9.6%(+5.00)#4,233 |
| 81. | Conway | 14.5% | 10.4%(+4.15)#81 | 9.6%(+4.93)#4,288 |
| 82. | Keowee Key | 14.5% | 10.4%(+4.07)#82 | 9.6%(+4.86)#4,338 |
| 83. | Chapin | 14.4% | 10.4%(+4.06)#83 | 9.6%(+4.84)#4,350 |
| 84. | Unity | 14.4% | 10.4%(+3.97)#84 | 9.6%(+4.76)#4,425 |
| 85. | Troy | 14.3% | 10.4%(+3.90)#85 | 9.6%(+4.69)#4,499 |
| 86. | Pawleys Island | 14.3% | 10.4%(+3.90)#86 | 9.6%(+4.69)#4,506 |
| 87. | Pickens | 14.2% | 10.4%(+3.83)#87 | 9.6%(+4.62)#4,574 |
| 88. | Summit | 14.2% | 10.4%(+3.81)#88 | 9.6%(+4.60)#4,601 |
| 89. | Pelzer | 14.2% | 10.4%(+3.81)#89 | 9.6%(+4.59)#4,605 |
| 90. | Jacksonboro | 14.1% | 10.4%(+3.69)#90 | 9.6%(+4.48)#4,709 |
| 91. | Wilkinson Heights | 14.0% | 10.4%(+3.63)#91 | 9.6%(+4.42)#4,762 |
| 92. | Chesnee | 14.0% | 10.4%(+3.60)#92 | 9.6%(+4.39)#4,793 |
| 93. | Parker | 13.9% | 10.4%(+3.50)#93 | 9.6%(+4.28)#4,886 |
| 94. | Golden Grove | 13.8% | 10.4%(+3.40)#94 | 9.6%(+4.19)#4,973 |
| 95. | Cameron | 13.7% | 10.4%(+3.36)#95 | 9.6%(+4.15)#5,011 |
| 96. | Georgetown | 13.7% | 10.4%(+3.32)#96 | 9.6%(+4.11)#5,049 |
| 97. | Inman | 13.6% | 10.4%(+3.24)#97 | 9.6%(+4.03)#5,137 |
| 98. | South Congaree | 13.6% | 10.4%(+3.20)#98 | 9.6%(+3.98)#5,185 |
| 99. | Silverstreet | 13.6% | 10.4%(+3.18)#99 | 9.6%(+3.96)#5,207 |
| 100. | Mount Pleasant | 13.5% | 10.4%(+3.15)#100 | 9.6%(+3.93)#5,232 |
Common Questions
What are the Top 10 Cities with the Highest Percentage of Population Employed in Sales & Related in South Carolina?
Top 10 Cities with the Highest Percentage of Population Employed in Sales & Related in South Carolina are:
#1
38.8%
#2
38.2%
#3
33.8%
#4
32.6%
#5
30.5%
#6
29.1%
#7
28.1%
#8
26.8%
#9
26.4%
#10
25.1%
What city has the Highest Percentage of Population Employed in Sales & Related in South Carolina?
Woodford has the Highest Percentage of Population Employed in Sales & Related in South Carolina with 38.8%.
What is the Percentage of Population Employed in Sales & Related in the State of South Carolina?
Percentage of Population Employed in Sales & Related in South Carolina is 10.4%.
What is the Percentage of Population Employed in Sales & Related in the United States?
Percentage of Population Employed in Sales & Related in the United States is 9.6%.