Cities with the Largest Chilean Community in New York
RELATED REPORTS & OPTIONS
Chilean
New York
Compare Cities
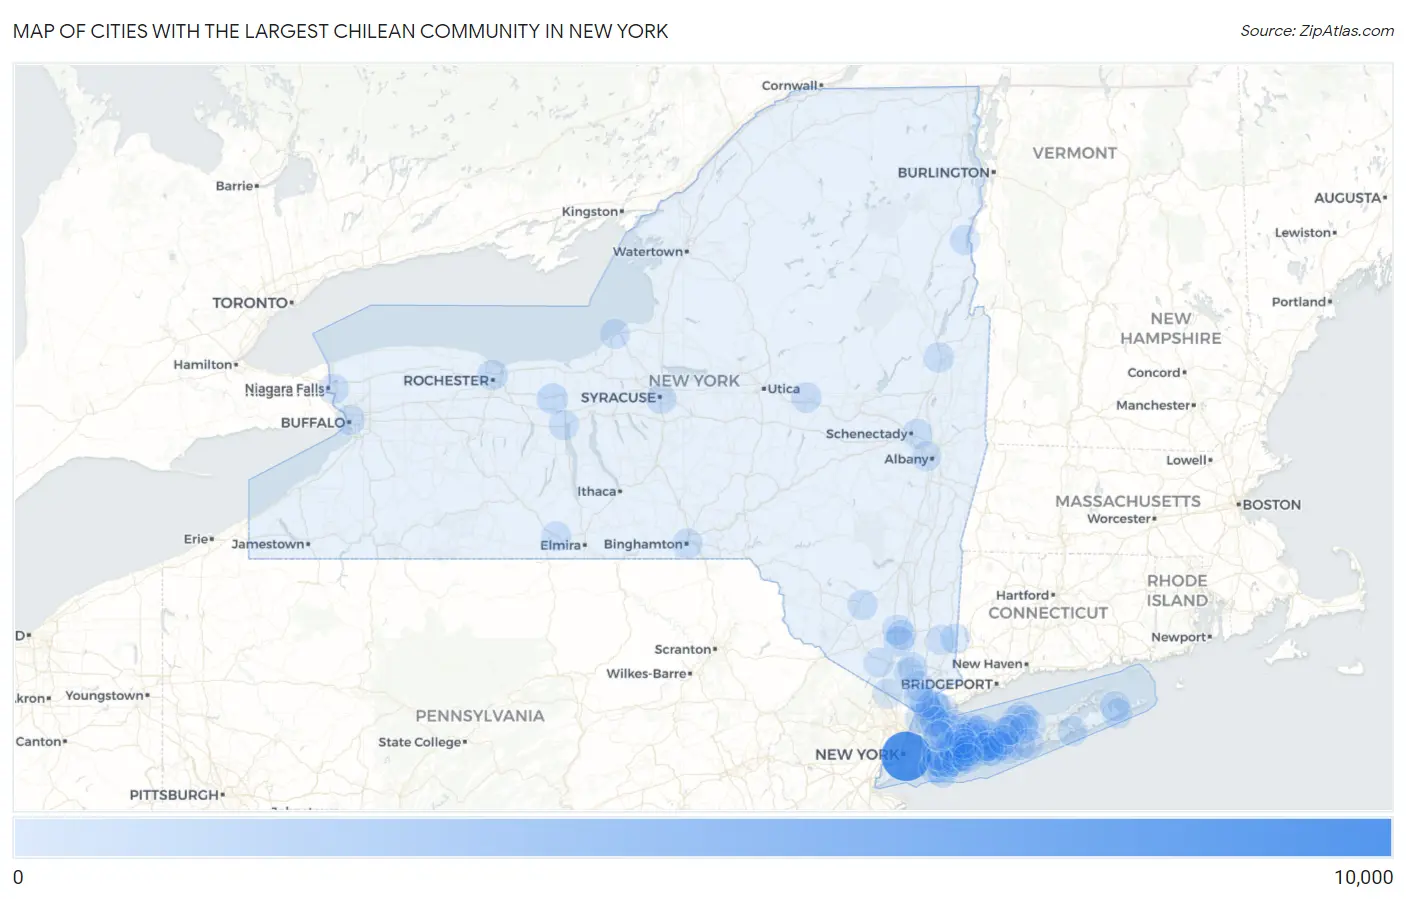
Map of Cities with the Largest Chilean Community in New York
0
10,000
Cities with the Largest Chilean Community in New York
| City | Chilean | vs State | vs National | |
| 1. | New York | 8,625 | 20,231(42.63%)#1 | 182,671(4.72%)#1 |
| 2. | White Plains | 783 | 20,231(3.87%)#2 | 182,671(0.43%)#14 |
| 3. | Cedarhurst | 644 | 20,231(3.18%)#3 | 182,671(0.35%)#23 |
| 4. | Newark | 417 | 20,231(2.06%)#4 | 182,671(0.23%)#51 |
| 5. | Oceanside | 366 | 20,231(1.81%)#5 | 182,671(0.20%)#60 |
| 6. | Port Chester | 347 | 20,231(1.72%)#6 | 182,671(0.19%)#65 |
| 7. | Central Islip | 324 | 20,231(1.60%)#7 | 182,671(0.18%)#75 |
| 8. | Valley Stream | 258 | 20,231(1.28%)#8 | 182,671(0.14%)#102 |
| 9. | North Wantagh | 234 | 20,231(1.16%)#9 | 182,671(0.13%)#120 |
| 10. | Brentwood | 233 | 20,231(1.15%)#10 | 182,671(0.13%)#121 |
| 11. | Rochester | 232 | 20,231(1.15%)#11 | 182,671(0.13%)#122 |
| 12. | Gardnertown | 224 | 20,231(1.11%)#12 | 182,671(0.12%)#129 |
| 13. | New Rochelle | 194 | 20,231(0.96%)#13 | 182,671(0.11%)#154 |
| 14. | Long Beach | 180 | 20,231(0.89%)#14 | 182,671(0.10%)#172 |
| 15. | North Bellmore | 179 | 20,231(0.88%)#15 | 182,671(0.10%)#174 |
| 16. | Commack | 173 | 20,231(0.86%)#16 | 182,671(0.09%)#186 |
| 17. | Syracuse | 163 | 20,231(0.81%)#17 | 182,671(0.09%)#200 |
| 18. | Elmont | 159 | 20,231(0.79%)#18 | 182,671(0.09%)#212 |
| 19. | Glen Cove | 158 | 20,231(0.78%)#19 | 182,671(0.09%)#214 |
| 20. | Ellenville | 135 | 20,231(0.67%)#20 | 182,671(0.07%)#261 |
| 21. | Scarsdale | 126 | 20,231(0.62%)#21 | 182,671(0.07%)#285 |
| 22. | Yonkers | 117 | 20,231(0.58%)#22 | 182,671(0.06%)#308 |
| 23. | Harrison | 117 | 20,231(0.58%)#23 | 182,671(0.06%)#310 |
| 24. | Vails Gate | 117 | 20,231(0.58%)#24 | 182,671(0.06%)#312 |
| 25. | Lynbrook | 109 | 20,231(0.54%)#25 | 182,671(0.06%)#333 |
| 26. | East Patchogue | 104 | 20,231(0.51%)#26 | 182,671(0.06%)#348 |
| 27. | Hauppauge | 104 | 20,231(0.51%)#27 | 182,671(0.06%)#349 |
| 28. | Salisbury | 104 | 20,231(0.51%)#28 | 182,671(0.06%)#350 |
| 29. | Binghamton | 91 | 20,231(0.45%)#29 | 182,671(0.05%)#399 |
| 30. | Little Falls | 90 | 20,231(0.44%)#30 | 182,671(0.05%)#406 |
| 31. | Elmsford | 89 | 20,231(0.44%)#31 | 182,671(0.05%)#409 |
| 32. | Oyster Bay | 83 | 20,231(0.41%)#32 | 182,671(0.05%)#441 |
| 33. | Bayville | 80 | 20,231(0.40%)#33 | 182,671(0.04%)#456 |
| 34. | Dix Hills | 76 | 20,231(0.38%)#34 | 182,671(0.04%)#476 |
| 35. | Niskayuna | 75 | 20,231(0.37%)#35 | 182,671(0.04%)#486 |
| 36. | Deer Park | 71 | 20,231(0.35%)#36 | 182,671(0.04%)#518 |
| 37. | Hampton Bays | 71 | 20,231(0.35%)#37 | 182,671(0.04%)#520 |
| 38. | Franklin Square | 70 | 20,231(0.35%)#38 | 182,671(0.04%)#529 |
| 39. | Ossining | 70 | 20,231(0.35%)#39 | 182,671(0.04%)#530 |
| 40. | West Glens Falls | 69 | 20,231(0.34%)#40 | 182,671(0.04%)#541 |
| 41. | Bohemia | 68 | 20,231(0.34%)#41 | 182,671(0.04%)#549 |
| 42. | Bethpage | 67 | 20,231(0.33%)#42 | 182,671(0.04%)#555 |
| 43. | Huntington Station | 66 | 20,231(0.33%)#43 | 182,671(0.04%)#560 |
| 44. | East Meadow | 61 | 20,231(0.30%)#44 | 182,671(0.03%)#605 |
| 45. | Hicksville | 60 | 20,231(0.30%)#45 | 182,671(0.03%)#616 |
| 46. | Greenlawn | 60 | 20,231(0.30%)#46 | 182,671(0.03%)#621 |
| 47. | Sound Beach | 56 | 20,231(0.28%)#47 | 182,671(0.03%)#662 |
| 48. | Lake Carmel | 55 | 20,231(0.27%)#48 | 182,671(0.03%)#667 |
| 49. | West Hills | 55 | 20,231(0.27%)#49 | 182,671(0.03%)#669 |
| 50. | Ridge | 54 | 20,231(0.27%)#50 | 182,671(0.03%)#680 |
| 51. | Mamaroneck | 53 | 20,231(0.26%)#51 | 182,671(0.03%)#687 |
| 52. | Huntington | 52 | 20,231(0.26%)#52 | 182,671(0.03%)#699 |
| 53. | Levittown | 51 | 20,231(0.25%)#53 | 182,671(0.03%)#710 |
| 54. | Mount Sinai | 48 | 20,231(0.24%)#54 | 182,671(0.03%)#749 |
| 55. | Manorhaven | 48 | 20,231(0.24%)#55 | 182,671(0.03%)#751 |
| 56. | Sea Cliff | 47 | 20,231(0.23%)#56 | 182,671(0.03%)#756 |
| 57. | Buffalo | 45 | 20,231(0.22%)#57 | 182,671(0.02%)#772 |
| 58. | Westbury | 45 | 20,231(0.22%)#58 | 182,671(0.02%)#781 |
| 59. | Sayville | 43 | 20,231(0.21%)#59 | 182,671(0.02%)#810 |
| 60. | Fairview Cdp Dutchess County | 43 | 20,231(0.21%)#60 | 182,671(0.02%)#813 |
| 61. | Bellmore | 41 | 20,231(0.20%)#61 | 182,671(0.02%)#830 |
| 62. | Newburgh | 39 | 20,231(0.19%)#62 | 182,671(0.02%)#865 |
| 63. | North Great River | 39 | 20,231(0.19%)#63 | 182,671(0.02%)#873 |
| 64. | Bay Shore | 37 | 20,231(0.18%)#64 | 182,671(0.02%)#898 |
| 65. | North Babylon | 37 | 20,231(0.18%)#65 | 182,671(0.02%)#903 |
| 66. | Rocky Point | 35 | 20,231(0.17%)#66 | 182,671(0.02%)#944 |
| 67. | Selden | 34 | 20,231(0.17%)#67 | 182,671(0.02%)#955 |
| 68. | Suffern | 34 | 20,231(0.17%)#68 | 182,671(0.02%)#959 |
| 69. | Lake Grove | 34 | 20,231(0.17%)#69 | 182,671(0.02%)#960 |
| 70. | Old Bethpage | 34 | 20,231(0.17%)#70 | 182,671(0.02%)#962 |
| 71. | Port Henry | 34 | 20,231(0.17%)#71 | 182,671(0.02%)#965 |
| 72. | Albany | 33 | 20,231(0.16%)#72 | 182,671(0.02%)#968 |
| 73. | Niagara Falls | 33 | 20,231(0.16%)#73 | 182,671(0.02%)#972 |
| 74. | East Northport | 33 | 20,231(0.16%)#74 | 182,671(0.02%)#979 |
| 75. | Chelsea Cove | 32 | 20,231(0.16%)#75 | 182,671(0.02%)#1,005 |
| 76. | Baywood | 31 | 20,231(0.15%)#76 | 182,671(0.02%)#1,021 |
| 77. | North Massapequa | 30 | 20,231(0.15%)#77 | 182,671(0.02%)#1,031 |
| 78. | Middle Island | 29 | 20,231(0.14%)#78 | 182,671(0.02%)#1,052 |
| 79. | Greenville Cdp Westchester County | 29 | 20,231(0.14%)#79 | 182,671(0.02%)#1,053 |
| 80. | Verplanck | 29 | 20,231(0.14%)#80 | 182,671(0.02%)#1,061 |
| 81. | Islip | 28 | 20,231(0.14%)#81 | 182,671(0.02%)#1,077 |
| 82. | Amagansett | 27 | 20,231(0.13%)#82 | 182,671(0.01%)#1,100 |
| 83. | Peekskill | 25 | 20,231(0.12%)#83 | 182,671(0.01%)#1,136 |
| 84. | Sleepy Hollow | 25 | 20,231(0.12%)#84 | 182,671(0.01%)#1,141 |
| 85. | Geneva | 24 | 20,231(0.12%)#85 | 182,671(0.01%)#1,163 |
| 86. | Corning | 24 | 20,231(0.12%)#86 | 182,671(0.01%)#1,167 |
| 87. | Baldwin | 22 | 20,231(0.11%)#87 | 182,671(0.01%)#1,204 |
| 88. | Syosset | 22 | 20,231(0.11%)#88 | 182,671(0.01%)#1,211 |
| 89. | Brookhaven | 22 | 20,231(0.11%)#89 | 182,671(0.01%)#1,222 |
| 90. | Suny Oswego | 22 | 20,231(0.11%)#90 | 182,671(0.01%)#1,223 |
| 91. | Farmingdale | 21 | 20,231(0.10%)#91 | 182,671(0.01%)#1,252 |
| 92. | Plainview | 20 | 20,231(0.10%)#92 | 182,671(0.01%)#1,268 |
| 93. | North Bay Shore | 20 | 20,231(0.10%)#93 | 182,671(0.01%)#1,271 |
| 94. | Putnam Lake | 20 | 20,231(0.10%)#94 | 182,671(0.01%)#1,278 |
| 95. | Baxter Estates | 20 | 20,231(0.10%)#95 | 182,671(0.01%)#1,280 |
| 96. | Ronkonkoma | 19 | 20,231(0.09%)#96 | 182,671(0.01%)#1,292 |
| 97. | Springs | 19 | 20,231(0.09%)#97 | 182,671(0.01%)#1,301 |
| 98. | East Massapequa | 18 | 20,231(0.09%)#98 | 182,671(0.01%)#1,320 |
| 99. | Walton Park | 18 | 20,231(0.09%)#99 | 182,671(0.01%)#1,336 |
| 100. | Centereach | 17 | 20,231(0.08%)#100 | 182,671(0.01%)#1,356 |
Common Questions
What are the Top 10 Cities with the Largest Chilean Community in New York?
Top 10 Cities with the Largest Chilean Community in New York are:
#1
8,625
#2
783
#3
644
#4
417
#5
366
#6
347
#7
324
#8
258
#9
234
#10
233
What city has the Largest Chilean Community in New York?
New York has the Largest Chilean Community in New York with 8,625.
What is the Total Chilean Population in the State of New York?
Total Chilean Population in New York is 20,231.
What is the Total Chilean Population in the United States?
Total Chilean Population in the United States is 182,671.