Cities with the Highest Unemployment Rate Among Males in Pennsylvania
RELATED REPORTS & OPTIONS
Highest Unemployment | Male
Pennsylvania
Compare Cities
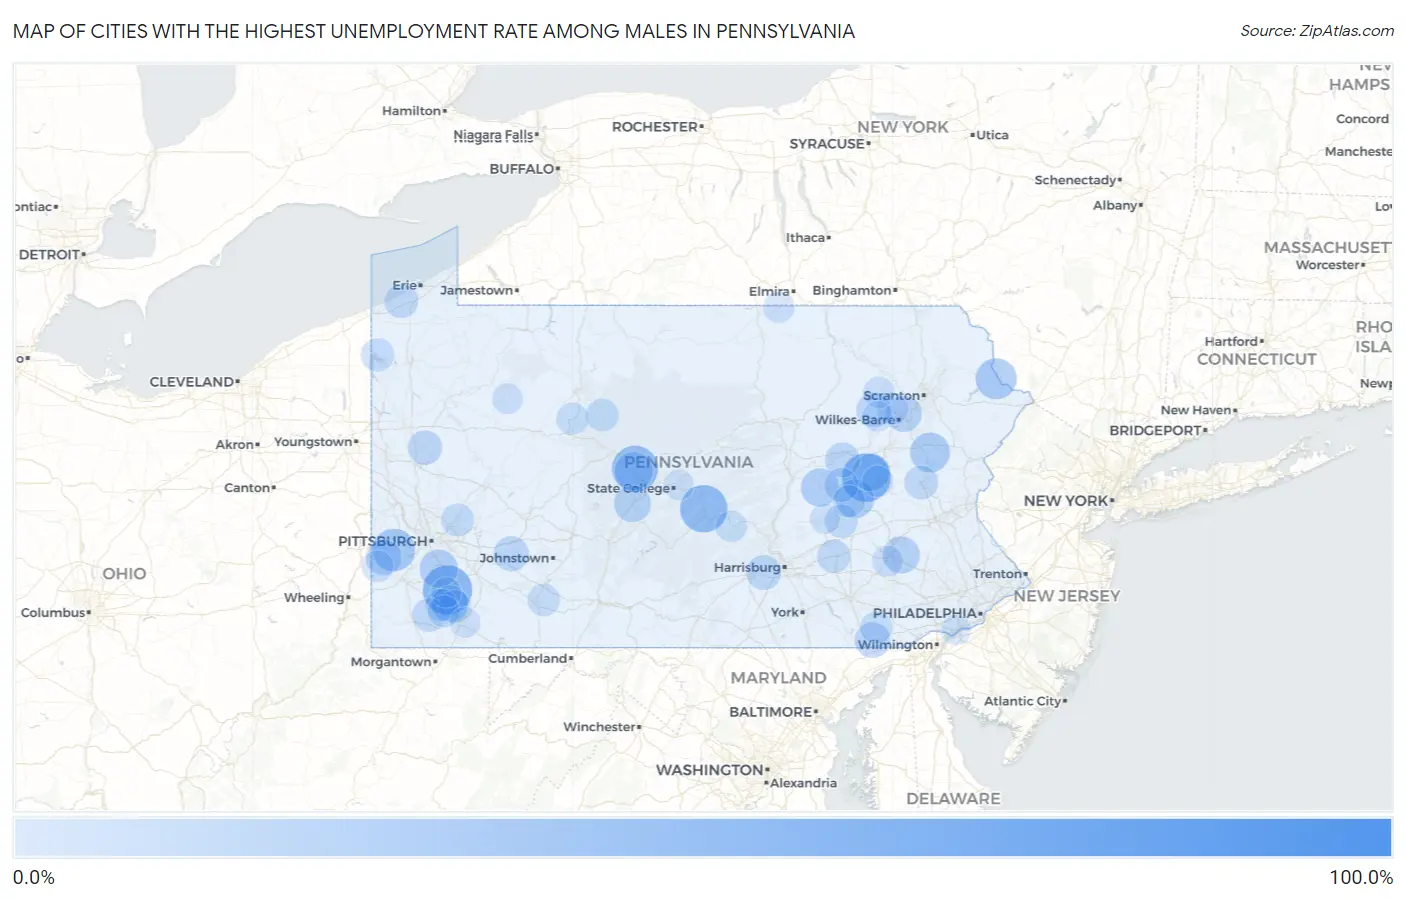
Map of Cities with the Highest Unemployment Rate Among Males in Pennsylvania
0.0%
100.0%
Cities with the Highest Unemployment Rate Among Males in Pennsylvania
| City | Male Unemployment | vs State | vs National | |
| 1. | Franklin Forge | 100.0% | 5.2%(+94.8)#1 | 5.0%(+95.0)#64 |
| 2. | Vail | 100.0% | 5.2%(+94.8)#2 | 5.0%(+95.0)#68 |
| 3. | Naomi | 56.8% | 5.2%(+51.6)#3 | 5.0%(+51.8)#182 |
| 4. | Brandonville | 55.0% | 5.2%(+49.8)#4 | 5.0%(+50.0)#197 |
| 5. | Maxatawny | 54.5% | 5.2%(+49.3)#5 | 5.0%(+49.5)#205 |
| 6. | Lumber City | 52.5% | 5.2%(+47.3)#6 | 5.0%(+47.5)#232 |
| 7. | Hawk Run | 50.0% | 5.2%(+44.8)#7 | 5.0%(+45.0)#251 |
| 8. | Burnside Borough | 45.3% | 5.2%(+40.1)#8 | 5.0%(+40.3)#330 |
| 9. | Bulger | 42.2% | 5.2%(+37.0)#9 | 5.0%(+37.2)#380 |
| 10. | Braddock Borough | 39.1% | 5.2%(+33.9)#10 | 5.0%(+34.1)#441 |
| 11. | Masthope | 39.1% | 5.2%(+33.9)#11 | 5.0%(+34.1)#444 |
| 12. | Portland Borough | 37.8% | 5.2%(+32.6)#12 | 5.0%(+32.8)#481 |
| 13. | Conneautville Borough | 36.9% | 5.2%(+31.7)#13 | 5.0%(+31.9)#509 |
| 14. | Holiday Pocono | 36.8% | 5.2%(+31.6)#14 | 5.0%(+31.8)#513 |
| 15. | Clarksville Borough | 36.4% | 5.2%(+31.2)#15 | 5.0%(+31.4)#525 |
| 16. | Greensboro Borough | 35.7% | 5.2%(+30.5)#16 | 5.0%(+30.7)#545 |
| 17. | Heckscherville | 34.6% | 5.2%(+29.4)#17 | 5.0%(+29.6)#567 |
| 18. | North Philipsburg | 33.9% | 5.2%(+28.7)#18 | 5.0%(+28.9)#586 |
| 19. | Elrama | 33.3% | 5.2%(+28.1)#19 | 5.0%(+28.3)#606 |
| 20. | Tharptown Uniontown | 32.9% | 5.2%(+27.7)#20 | 5.0%(+27.9)#642 |
| 21. | Fairview Borough | 32.6% | 5.2%(+27.4)#21 | 5.0%(+27.6)#655 |
| 22. | Cove Forge | 32.5% | 5.2%(+27.3)#22 | 5.0%(+27.5)#660 |
| 23. | Sheppton | 32.1% | 5.2%(+26.9)#23 | 5.0%(+27.1)#674 |
| 24. | Stony Creek Mills | 31.1% | 5.2%(+25.9)#24 | 5.0%(+26.1)#719 |
| 25. | Hazen | 30.3% | 5.2%(+25.1)#25 | 5.0%(+25.3)#754 |
| 26. | Northwood | 30.2% | 5.2%(+25.0)#26 | 5.0%(+25.2)#759 |
| 27. | Grindstone | 29.7% | 5.2%(+24.5)#27 | 5.0%(+24.7)#782 |
| 28. | North Braddock Borough | 29.3% | 5.2%(+24.1)#28 | 5.0%(+24.3)#807 |
| 29. | Hilldale | 29.2% | 5.2%(+24.0)#29 | 5.0%(+24.2)#814 |
| 30. | Jefferson Borough Greene County | 28.9% | 5.2%(+23.7)#30 | 5.0%(+23.9)#834 |
| 31. | Rankin Borough | 28.4% | 5.2%(+23.2)#31 | 5.0%(+23.4)#869 |
| 32. | Little Britain | 27.9% | 5.2%(+22.7)#32 | 5.0%(+22.9)#892 |
| 33. | Cross Creek | 27.8% | 5.2%(+22.6)#33 | 5.0%(+22.8)#911 |
| 34. | Westover Borough | 27.2% | 5.2%(+22.0)#34 | 5.0%(+22.2)#953 |
| 35. | Millwood | 27.1% | 5.2%(+21.9)#35 | 5.0%(+22.1)#958 |
| 36. | New Kingstown | 26.4% | 5.2%(+21.2)#36 | 5.0%(+21.4)#998 |
| 37. | Mainville | 26.3% | 5.2%(+21.1)#37 | 5.0%(+21.3)#1,006 |
| 38. | Edwardsville Borough | 26.0% | 5.2%(+20.8)#38 | 5.0%(+21.0)#1,024 |
| 39. | Pikes Creek | 26.0% | 5.2%(+20.8)#39 | 5.0%(+21.0)#1,031 |
| 40. | Slippery Rock University | 25.3% | 5.2%(+20.1)#40 | 5.0%(+20.3)#1,066 |
| 41. | Ohiopyle Borough | 25.0% | 5.2%(+19.8)#41 | 5.0%(+20.0)#1,108 |
| 42. | Wilburton Number One | 24.7% | 5.2%(+19.5)#42 | 5.0%(+19.7)#1,127 |
| 43. | Callery Borough | 24.6% | 5.2%(+19.4)#43 | 5.0%(+19.6)#1,132 |
| 44. | Weissport East | 24.2% | 5.2%(+19.0)#44 | 5.0%(+19.2)#1,170 |
| 45. | Fairview | 24.1% | 5.2%(+18.9)#45 | 5.0%(+19.1)#1,174 |
| 46. | Pleasant Hill | 23.8% | 5.2%(+18.6)#46 | 5.0%(+18.8)#1,203 |
| 47. | Ravine | 23.1% | 5.2%(+17.9)#47 | 5.0%(+18.1)#1,281 |
| 48. | Dry Tavern | 23.1% | 5.2%(+17.9)#48 | 5.0%(+18.1)#1,282 |
| 49. | Burgettstown Borough | 22.9% | 5.2%(+17.7)#49 | 5.0%(+17.9)#1,299 |
| 50. | Pymatuning North | 22.9% | 5.2%(+17.7)#50 | 5.0%(+17.9)#1,307 |
| 51. | Arnold | 22.5% | 5.2%(+17.3)#51 | 5.0%(+17.5)#1,347 |
| 52. | New Eagle Borough | 22.2% | 5.2%(+17.0)#52 | 5.0%(+17.2)#1,367 |
| 53. | Yellow Springs | 22.2% | 5.2%(+17.0)#53 | 5.0%(+17.2)#1,387 |
| 54. | Weedville | 22.0% | 5.2%(+16.8)#54 | 5.0%(+17.0)#1,410 |
| 55. | Eldred Borough | 21.7% | 5.2%(+16.5)#55 | 5.0%(+16.7)#1,437 |
| 56. | Friedens | 21.6% | 5.2%(+16.4)#56 | 5.0%(+16.6)#1,444 |
| 57. | Smock | 21.5% | 5.2%(+16.3)#57 | 5.0%(+16.5)#1,453 |
| 58. | Crenshaw | 21.3% | 5.2%(+16.1)#58 | 5.0%(+16.3)#1,475 |
| 59. | Midland Borough | 21.1% | 5.2%(+15.9)#59 | 5.0%(+16.1)#1,488 |
| 60. | Hiller | 20.9% | 5.2%(+15.7)#60 | 5.0%(+15.9)#1,503 |
| 61. | Kirkwood | 20.8% | 5.2%(+15.6)#61 | 5.0%(+15.8)#1,517 |
| 62. | Buck Run | 20.7% | 5.2%(+15.5)#62 | 5.0%(+15.7)#1,529 |
| 63. | Swarthmore Borough | 20.5% | 5.2%(+15.3)#63 | 5.0%(+15.5)#1,545 |
| 64. | Republic | 20.4% | 5.2%(+15.2)#64 | 5.0%(+15.4)#1,567 |
| 65. | Franklintown Borough | 20.1% | 5.2%(+14.9)#65 | 5.0%(+15.1)#1,600 |
| 66. | Shavertown | 20.0% | 5.2%(+14.8)#66 | 5.0%(+15.0)#1,602 |
| 67. | Avella | 20.0% | 5.2%(+14.8)#67 | 5.0%(+15.0)#1,606 |
| 68. | Pitcairn Borough | 19.8% | 5.2%(+14.6)#68 | 5.0%(+14.8)#1,653 |
| 69. | Lansford Borough | 19.4% | 5.2%(+14.2)#69 | 5.0%(+14.4)#1,696 |
| 70. | Mexico | 19.3% | 5.2%(+14.1)#70 | 5.0%(+14.3)#1,722 |
| 71. | Whitaker Borough | 19.2% | 5.2%(+14.0)#71 | 5.0%(+14.2)#1,730 |
| 72. | Renovo Borough | 19.2% | 5.2%(+14.0)#72 | 5.0%(+14.2)#1,731 |
| 73. | Noxen | 19.1% | 5.2%(+13.9)#73 | 5.0%(+14.1)#1,745 |
| 74. | Delano | 19.1% | 5.2%(+13.9)#74 | 5.0%(+14.1)#1,750 |
| 75. | Grampian Borough | 18.9% | 5.2%(+13.7)#75 | 5.0%(+13.9)#1,779 |
| 76. | Dushore Borough | 18.8% | 5.2%(+13.6)#76 | 5.0%(+13.8)#1,790 |
| 77. | Eastvale Borough | 18.8% | 5.2%(+13.6)#77 | 5.0%(+13.8)#1,794 |
| 78. | Coalmont Borough | 18.8% | 5.2%(+13.6)#78 | 5.0%(+13.8)#1,800 |
| 79. | Rural Valley Borough | 18.6% | 5.2%(+13.4)#79 | 5.0%(+13.6)#1,820 |
| 80. | Westmont Borough | 18.5% | 5.2%(+13.3)#80 | 5.0%(+13.5)#1,829 |
| 81. | Montrose Manor | 18.4% | 5.2%(+13.2)#81 | 5.0%(+13.4)#1,860 |
| 82. | Millerton | 18.3% | 5.2%(+13.1)#82 | 5.0%(+13.3)#1,870 |
| 83. | Runville | 18.2% | 5.2%(+13.0)#83 | 5.0%(+13.2)#1,886 |
| 84. | Mount Carbon Borough | 18.2% | 5.2%(+13.0)#84 | 5.0%(+13.2)#1,896 |
| 85. | Tylersburg | 17.9% | 5.2%(+12.7)#85 | 5.0%(+12.9)#1,946 |
| 86. | Dawson Borough | 17.8% | 5.2%(+12.6)#86 | 5.0%(+12.8)#1,954 |
| 87. | Salladasburg Borough | 17.7% | 5.2%(+12.5)#87 | 5.0%(+12.7)#1,964 |
| 88. | Mahanoy City Borough | 17.4% | 5.2%(+12.2)#88 | 5.0%(+12.4)#2,000 |
| 89. | East Uniontown | 17.4% | 5.2%(+12.2)#89 | 5.0%(+12.4)#2,004 |
| 90. | East Lansdowne Borough | 17.2% | 5.2%(+12.0)#90 | 5.0%(+12.2)#2,034 |
| 91. | Shiremanstown Borough | 17.2% | 5.2%(+12.0)#91 | 5.0%(+12.2)#2,039 |
| 92. | Allenport | 17.2% | 5.2%(+12.0)#92 | 5.0%(+12.2)#2,051 |
| 93. | Silkworth | 17.2% | 5.2%(+12.0)#93 | 5.0%(+12.2)#2,052 |
| 94. | Shirleysburg Borough | 17.1% | 5.2%(+11.9)#94 | 5.0%(+12.1)#2,080 |
| 95. | Lemont | 17.0% | 5.2%(+11.8)#95 | 5.0%(+12.0)#2,088 |
| 96. | Reinerton | 17.0% | 5.2%(+11.8)#96 | 5.0%(+12.0)#2,094 |
| 97. | Chester | 16.8% | 5.2%(+11.6)#97 | 5.0%(+11.8)#2,117 |
| 98. | Kutztown Borough | 16.8% | 5.2%(+11.6)#98 | 5.0%(+11.8)#2,124 |
| 99. | Nesquehoning Borough | 16.8% | 5.2%(+11.6)#99 | 5.0%(+11.8)#2,126 |
| 100. | Harmony Borough | 16.8% | 5.2%(+11.6)#100 | 5.0%(+11.8)#2,133 |
Common Questions
What are the Top 10 Cities with the Highest Unemployment Rate Among Males in Pennsylvania?
Top 10 Cities with the Highest Unemployment Rate Among Males in Pennsylvania are:
#1
56.8%
#2
55.0%
#3
52.5%
#4
50.0%
#5
42.2%
#6
39.1%
#7
36.8%
#8
34.6%
#9
33.9%
#10
33.3%
What city has the Highest Unemployment Rate Among Males in Pennsylvania?
Naomi has the Highest Unemployment Rate Among Males in Pennsylvania with 56.8%.
What is the Unemployment Rate Among Males in the State of Pennsylvania?
Unemployment Rate Among Males in Pennsylvania is 5.2%.
What is the Unemployment Rate Among Males in the United States?
Unemployment Rate Among Males in the United States is 5.0%.