Cities with the Highest Unemployment Rate Among Males in Iowa
RELATED REPORTS & OPTIONS
Highest Unemployment | Male
Iowa
Compare Cities
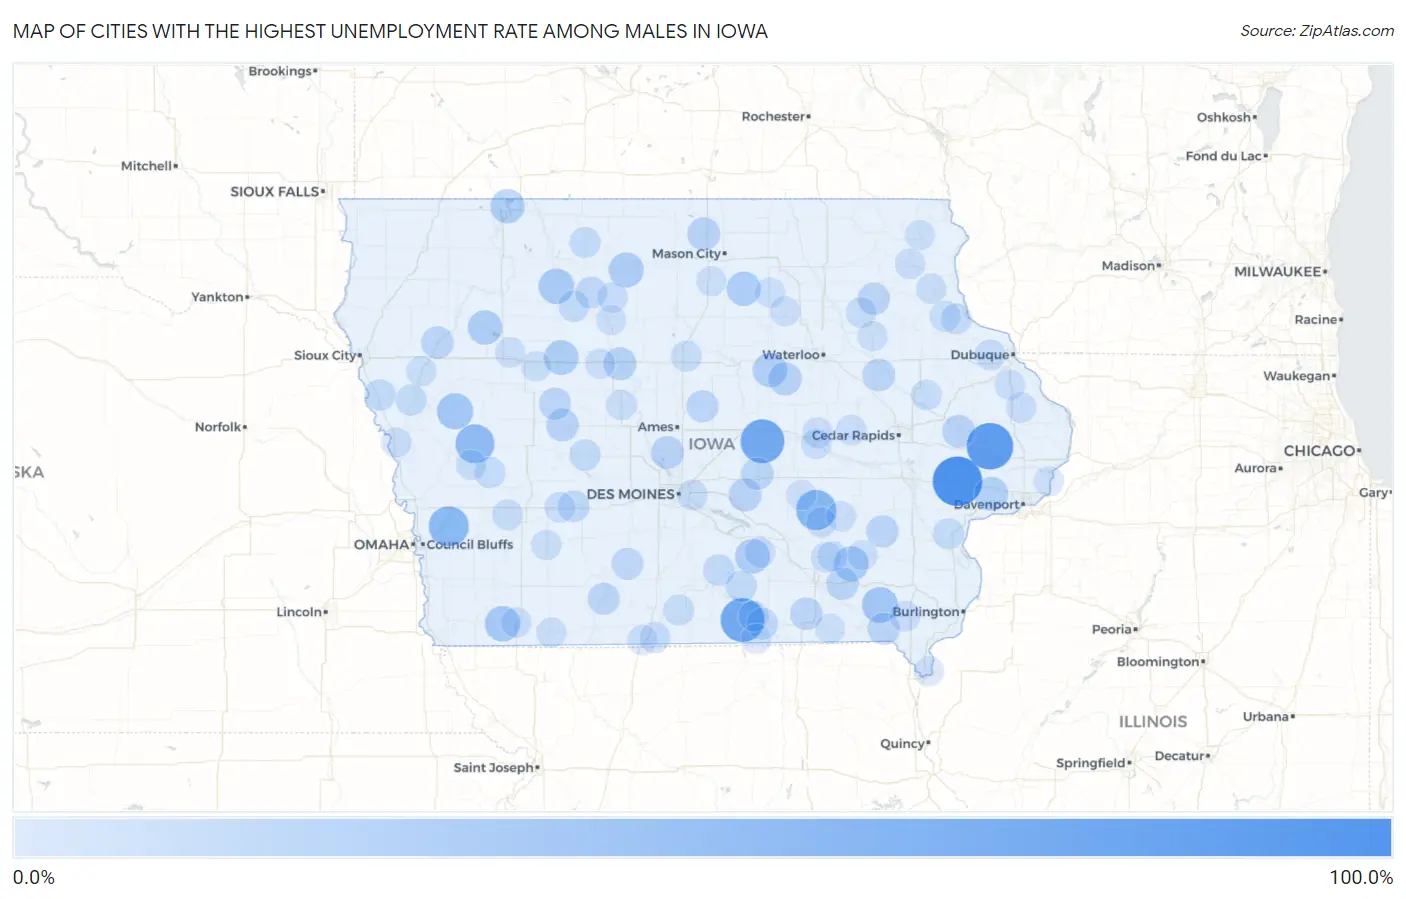
Map of Cities with the Highest Unemployment Rate Among Males in Iowa
0.0%
100.0%
Cities with the Highest Unemployment Rate Among Males in Iowa
| City | Male Unemployment | vs State | vs National | |
| 1. | Rochester | 100.0% | 3.6%(+96.4)#1 | 5.0%(+95.0)#45 |
| 2. | Toronto | 85.7% | 3.6%(+82.1)#2 | 5.0%(+80.7)#79 |
| 3. | Ferguson | 72.7% | 3.6%(+69.1)#3 | 5.0%(+67.7)#104 |
| 4. | Plano | 72.5% | 3.6%(+68.9)#4 | 5.0%(+67.5)#105 |
| 5. | Gibson | 55.6% | 3.6%(+52.0)#5 | 5.0%(+50.6)#192 |
| 6. | Bentley | 54.9% | 3.6%(+51.3)#6 | 5.0%(+49.9)#198 |
| 7. | Buck Grove | 50.0% | 3.6%(+46.4)#7 | 5.0%(+45.0)#271 |
| 8. | Ricketts | 36.8% | 3.6%(+33.2)#8 | 5.0%(+31.8)#515 |
| 9. | Stockport | 36.2% | 3.6%(+32.6)#9 | 5.0%(+31.2)#528 |
| 10. | Yorktown | 33.3% | 3.6%(+29.7)#10 | 5.0%(+28.3)#628 |
| 11. | Mallard | 32.8% | 3.6%(+29.2)#11 | 5.0%(+27.8)#646 |
| 12. | St Benedict | 31.0% | 3.6%(+27.4)#12 | 5.0%(+26.0)#730 |
| 13. | Packwood | 30.8% | 3.6%(+27.2)#13 | 5.0%(+25.8)#736 |
| 14. | Marysville | 30.0% | 3.6%(+26.4)#14 | 5.0%(+25.0)#770 |
| 15. | Twin Lakes | 29.8% | 3.6%(+26.2)#15 | 5.0%(+24.8)#777 |
| 16. | Alta | 29.0% | 3.6%(+25.4)#16 | 5.0%(+24.0)#824 |
| 17. | Dougherty | 28.6% | 3.6%(+25.0)#17 | 5.0%(+23.6)#862 |
| 18. | Holland | 28.4% | 3.6%(+24.8)#18 | 5.0%(+23.4)#870 |
| 19. | Orleans | 27.7% | 3.6%(+24.1)#19 | 5.0%(+22.7)#922 |
| 20. | Stockton | 26.3% | 3.6%(+22.7)#20 | 5.0%(+21.3)#1,005 |
| 21. | Morrison | 23.8% | 3.6%(+20.2)#21 | 5.0%(+18.8)#1,207 |
| 22. | Coalville | 22.7% | 3.6%(+19.1)#22 | 5.0%(+17.7)#1,328 |
| 23. | Hanlontown | 22.2% | 3.6%(+18.6)#23 | 5.0%(+17.2)#1,380 |
| 24. | Sheldahl | 22.0% | 3.6%(+18.4)#24 | 5.0%(+17.0)#1,411 |
| 25. | Reasnor | 22.0% | 3.6%(+18.4)#25 | 5.0%(+17.0)#1,414 |
| 26. | Olin | 21.8% | 3.6%(+18.2)#26 | 5.0%(+16.8)#1,426 |
| 27. | Ralston | 21.1% | 3.6%(+17.5)#27 | 5.0%(+16.1)#1,498 |
| 28. | Washta | 20.6% | 3.6%(+17.0)#28 | 5.0%(+15.6)#1,544 |
| 29. | Drakesville | 20.5% | 3.6%(+16.9)#29 | 5.0%(+15.5)#1,561 |
| 30. | Rowley | 20.4% | 3.6%(+16.8)#30 | 5.0%(+15.4)#1,573 |
| 31. | Batavia | 19.7% | 3.6%(+16.1)#31 | 5.0%(+14.7)#1,664 |
| 32. | West Chester | 19.4% | 3.6%(+15.8)#32 | 5.0%(+14.4)#1,708 |
| 33. | Kellogg | 19.2% | 3.6%(+15.6)#33 | 5.0%(+14.2)#1,733 |
| 34. | Bonaparte | 19.0% | 3.6%(+15.4)#34 | 5.0%(+14.0)#1,757 |
| 35. | Randalia | 19.0% | 3.6%(+15.4)#35 | 5.0%(+14.0)#1,766 |
| 36. | Lanesboro | 18.8% | 3.6%(+15.2)#36 | 5.0%(+13.8)#1,799 |
| 37. | Mccallsburg | 18.4% | 3.6%(+14.8)#37 | 5.0%(+13.4)#1,858 |
| 38. | Shannon City | 18.2% | 3.6%(+14.6)#38 | 5.0%(+13.2)#1,892 |
| 39. | Lorimor | 17.8% | 3.6%(+14.2)#39 | 5.0%(+12.8)#1,955 |
| 40. | Casey | 16.9% | 3.6%(+13.3)#40 | 5.0%(+11.9)#2,111 |
| 41. | Ottosen | 16.7% | 3.6%(+13.1)#41 | 5.0%(+11.7)#2,187 |
| 42. | Williamson | 16.0% | 3.6%(+12.4)#42 | 5.0%(+11.0)#2,322 |
| 43. | Sloan | 15.4% | 3.6%(+11.8)#43 | 5.0%(+10.4)#2,460 |
| 44. | Melrose | 15.4% | 3.6%(+11.8)#44 | 5.0%(+10.4)#2,477 |
| 45. | Centerville | 15.0% | 3.6%(+11.4)#45 | 5.0%(+10.00)#2,562 |
| 46. | Bagley | 15.0% | 3.6%(+11.4)#46 | 5.0%(+10.00)#2,585 |
| 47. | Rolfe | 14.4% | 3.6%(+10.8)#47 | 5.0%(+9.40)#2,745 |
| 48. | Rodney | 14.3% | 3.6%(+10.7)#48 | 5.0%(+9.30)#2,796 |
| 49. | Fenton | 14.0% | 3.6%(+10.4)#49 | 5.0%(+9.00)#2,877 |
| 50. | Letts | 13.6% | 3.6%(+10.00)#50 | 5.0%(+8.60)#3,008 |
| 51. | Kirkman | 13.6% | 3.6%(+10.00)#51 | 5.0%(+8.60)#3,016 |
| 52. | Garber | 13.3% | 3.6%(+9.70)#52 | 5.0%(+8.30)#3,113 |
| 53. | Williams | 13.2% | 3.6%(+9.60)#53 | 5.0%(+8.20)#3,154 |
| 54. | Garden Grove | 13.0% | 3.6%(+9.40)#54 | 5.0%(+8.00)#3,227 |
| 55. | Marne | 13.0% | 3.6%(+9.40)#55 | 5.0%(+8.00)#3,233 |
| 56. | Osterdock | 12.5% | 3.6%(+8.90)#56 | 5.0%(+7.50)#3,443 |
| 57. | Graf | 12.5% | 3.6%(+8.90)#57 | 5.0%(+7.50)#3,457 |
| 58. | Pleasant Hill | 12.4% | 3.6%(+8.80)#58 | 5.0%(+7.40)#3,463 |
| 59. | Westgate | 12.2% | 3.6%(+8.60)#59 | 5.0%(+7.20)#3,587 |
| 60. | Davis City | 12.1% | 3.6%(+8.50)#60 | 5.0%(+7.10)#3,634 |
| 61. | Prairieburg | 12.1% | 3.6%(+8.50)#61 | 5.0%(+7.10)#3,635 |
| 62. | Adair | 11.8% | 3.6%(+8.20)#62 | 5.0%(+6.80)#3,758 |
| 63. | Vining | 11.8% | 3.6%(+8.20)#63 | 5.0%(+6.80)#3,784 |
| 64. | Houghton | 11.8% | 3.6%(+8.20)#64 | 5.0%(+6.80)#3,785 |
| 65. | Hedrick | 11.7% | 3.6%(+8.10)#65 | 5.0%(+6.70)#3,830 |
| 66. | Mystic | 11.6% | 3.6%(+8.00)#66 | 5.0%(+6.60)#3,878 |
| 67. | Clarinda | 11.4% | 3.6%(+7.80)#67 | 5.0%(+6.40)#3,946 |
| 68. | Livermore | 11.4% | 3.6%(+7.80)#68 | 5.0%(+6.40)#3,967 |
| 69. | Van Horne | 11.3% | 3.6%(+7.70)#69 | 5.0%(+6.30)#4,011 |
| 70. | What Cheer | 11.3% | 3.6%(+7.70)#70 | 5.0%(+6.30)#4,012 |
| 71. | Boxholm | 11.1% | 3.6%(+7.50)#71 | 5.0%(+6.10)#4,127 |
| 72. | Postville | 10.8% | 3.6%(+7.20)#72 | 5.0%(+5.80)#4,259 |
| 73. | Chelsea | 10.8% | 3.6%(+7.20)#73 | 5.0%(+5.80)#4,287 |
| 74. | Anthon | 10.7% | 3.6%(+7.10)#74 | 5.0%(+5.70)#4,344 |
| 75. | Bussey | 10.7% | 3.6%(+7.10)#75 | 5.0%(+5.70)#4,345 |
| 76. | Andrew | 10.7% | 3.6%(+7.10)#76 | 5.0%(+5.70)#4,346 |
| 77. | Zwingle | 10.7% | 3.6%(+7.10)#77 | 5.0%(+5.70)#4,355 |
| 78. | Earling | 10.6% | 3.6%(+7.00)#78 | 5.0%(+5.60)#4,407 |
| 79. | Lytton | 10.6% | 3.6%(+7.00)#79 | 5.0%(+5.60)#4,412 |
| 80. | Blencoe | 10.6% | 3.6%(+7.00)#80 | 5.0%(+5.60)#4,414 |
| 81. | Massena | 10.5% | 3.6%(+6.90)#81 | 5.0%(+5.50)#4,470 |
| 82. | Martinsburg | 10.5% | 3.6%(+6.90)#82 | 5.0%(+5.50)#4,486 |
| 83. | St Olaf | 10.5% | 3.6%(+6.90)#83 | 5.0%(+5.50)#4,487 |
| 84. | Nemaha | 10.5% | 3.6%(+6.90)#84 | 5.0%(+5.50)#4,489 |
| 85. | Lamoni | 10.3% | 3.6%(+6.70)#85 | 5.0%(+5.30)#4,568 |
| 86. | Princeton | 10.3% | 3.6%(+6.70)#86 | 5.0%(+5.30)#4,583 |
| 87. | Webster | 10.3% | 3.6%(+6.70)#87 | 5.0%(+5.30)#4,605 |
| 88. | Moorland | 10.2% | 3.6%(+6.60)#88 | 5.0%(+5.20)#4,664 |
| 89. | Waukon | 10.1% | 3.6%(+6.50)#89 | 5.0%(+5.10)#4,684 |
| 90. | Hazleton | 10.1% | 3.6%(+6.50)#90 | 5.0%(+5.10)#4,711 |
| 91. | Pulaski | 10.1% | 3.6%(+6.50)#91 | 5.0%(+5.10)#4,719 |
| 92. | Montezuma | 10.0% | 3.6%(+6.40)#92 | 5.0%(+5.00)#4,766 |
| 93. | Swaledale | 10.0% | 3.6%(+6.40)#93 | 5.0%(+5.00)#4,800 |
| 94. | Bedford | 9.9% | 3.6%(+6.30)#94 | 5.0%(+4.90)#4,851 |
| 95. | Greene | 9.9% | 3.6%(+6.30)#95 | 5.0%(+4.90)#4,855 |
| 96. | Richland | 9.8% | 3.6%(+6.20)#96 | 5.0%(+4.80)#4,935 |
| 97. | Cincinnati | 9.8% | 3.6%(+6.20)#97 | 5.0%(+4.80)#4,946 |
| 98. | Keokuk | 9.7% | 3.6%(+6.10)#98 | 5.0%(+4.70)#4,955 |
| 99. | Clarksville | 9.6% | 3.6%(+6.00)#99 | 5.0%(+4.60)#5,065 |
| 100. | Dakota City | 9.6% | 3.6%(+6.00)#100 | 5.0%(+4.60)#5,072 |
Common Questions
What are the Top 10 Cities with the Highest Unemployment Rate Among Males in Iowa?
Top 10 Cities with the Highest Unemployment Rate Among Males in Iowa are:
What city has the Highest Unemployment Rate Among Males in Iowa?
Rochester has the Highest Unemployment Rate Among Males in Iowa with 100.0%.
What is the Unemployment Rate Among Males in the State of Iowa?
Unemployment Rate Among Males in Iowa is 3.6%.
What is the Unemployment Rate Among Males in the United States?
Unemployment Rate Among Males in the United States is 5.0%.