Cities with the Highest Unemployment Rate Among Males in Connecticut
RELATED REPORTS & OPTIONS
Highest Unemployment | Male
Connecticut
Compare Cities
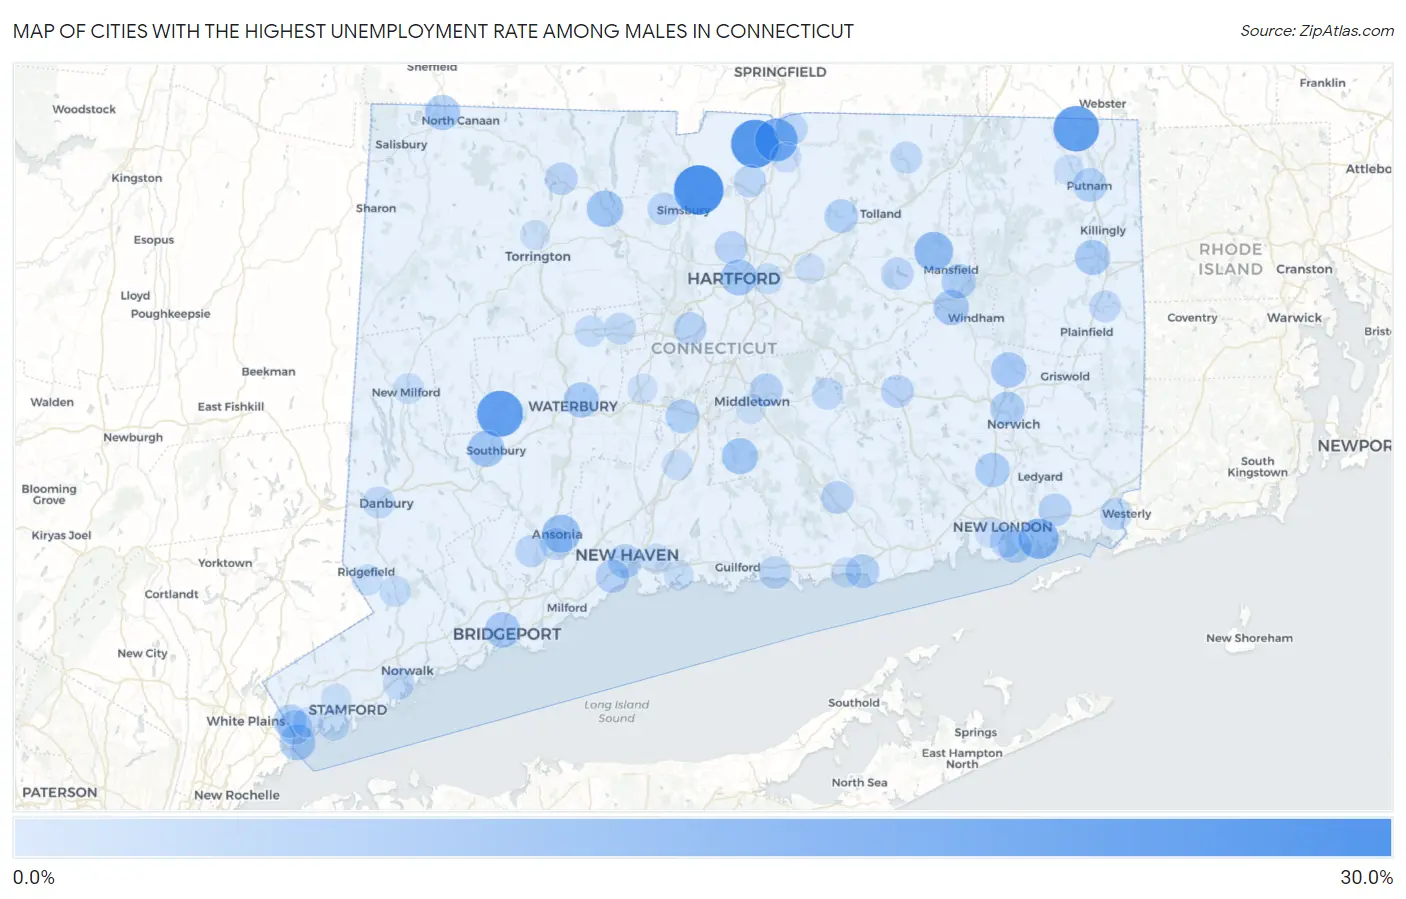
Map of Cities with the Highest Unemployment Rate Among Males in Connecticut
0.0%
30.0%
Cities with the Highest Unemployment Rate Among Males in Connecticut
| City | Male Unemployment | vs State | vs National | |
| 1. | Tariffville | 28.9% | 6.1%(+22.8)#1 | 5.0%(+23.9)#830 |
| 2. | Pleasant Valley | 27.8% | 6.1%(+21.7)#2 | 5.0%(+22.8)#908 |
| 3. | Suffield Depot | 26.9% | 6.1%(+20.8)#3 | 5.0%(+21.9)#970 |
| 4. | Bogus Hill | 24.6% | 6.1%(+18.5)#4 | 5.0%(+19.6)#1,136 |
| 5. | Woodbury Center | 24.4% | 6.1%(+18.3)#5 | 5.0%(+19.4)#1,154 |
| 6. | Quinebaug | 23.9% | 6.1%(+17.8)#6 | 5.0%(+18.9)#1,194 |
| 7. | Thompsonville | 20.0% | 6.1%(+13.9)#7 | 5.0%(+15.0)#1,601 |
| 8. | Stonington Borough | 20.0% | 6.1%(+13.9)#8 | 5.0%(+15.0)#1,605 |
| 9. | Fairfield University | 19.9% | 6.1%(+13.8)#9 | 5.0%(+14.9)#1,643 |
| 10. | Danielson Borough | 19.5% | 6.1%(+13.4)#10 | 5.0%(+14.5)#1,680 |
| 11. | Oronoque | 19.4% | 6.1%(+13.3)#11 | 5.0%(+14.4)#1,697 |
| 12. | Taylor Corners | 18.3% | 6.1%(+12.2)#12 | 5.0%(+13.3)#1,867 |
| 13. | Poquonock Bridge | 16.8% | 6.1%(+10.7)#13 | 5.0%(+11.8)#2,132 |
| 14. | Stratford Downtown | 15.6% | 6.1%(+9.50)#14 | 5.0%(+10.6)#2,414 |
| 15. | Storrs | 15.2% | 6.1%(+9.10)#15 | 5.0%(+10.2)#2,512 |
| 16. | Ansonia | 13.9% | 6.1%(+7.80)#16 | 5.0%(+8.90)#2,878 |
| 17. | Coleytown | 13.7% | 6.1%(+7.60)#17 | 5.0%(+8.70)#2,966 |
| 18. | New Canaan | 12.4% | 6.1%(+6.30)#18 | 5.0%(+7.40)#3,469 |
| 19. | Heritage Village | 12.0% | 6.1%(+5.90)#19 | 5.0%(+7.00)#3,653 |
| 20. | New Hartford Center | 12.0% | 6.1%(+5.90)#20 | 5.0%(+7.00)#3,671 |
| 21. | Durham | 11.6% | 6.1%(+5.50)#21 | 5.0%(+6.60)#3,853 |
| 22. | Hartford | 11.5% | 6.1%(+5.40)#22 | 5.0%(+6.50)#3,884 |
| 23. | Byram | 11.2% | 6.1%(+5.10)#23 | 5.0%(+6.20)#4,037 |
| 24. | Bridgeport | 10.9% | 6.1%(+4.80)#24 | 5.0%(+5.90)#4,180 |
| 25. | Baltic | 10.8% | 6.1%(+4.70)#25 | 5.0%(+5.80)#4,270 |
| 26. | Willimantic | 10.7% | 6.1%(+4.60)#26 | 5.0%(+5.70)#4,299 |
| 27. | Jewett City Borough | 10.6% | 6.1%(+4.50)#27 | 5.0%(+5.60)#4,370 |
| 28. | Waterbury | 10.5% | 6.1%(+4.40)#28 | 5.0%(+5.50)#4,418 |
| 29. | Canaan | 10.5% | 6.1%(+4.40)#29 | 5.0%(+5.50)#4,456 |
| 30. | East Brooklyn | 10.4% | 6.1%(+4.30)#30 | 5.0%(+5.40)#4,518 |
| 31. | Lakes West | 10.1% | 6.1%(+4.00)#31 | 5.0%(+5.10)#4,695 |
| 32. | Mansfield Center | 9.8% | 6.1%(+3.70)#32 | 5.0%(+4.80)#4,921 |
| 33. | Oxoboxo River | 9.7% | 6.1%(+3.60)#33 | 5.0%(+4.70)#4,981 |
| 34. | Norwich | 9.5% | 6.1%(+3.40)#34 | 5.0%(+4.50)#5,090 |
| 35. | Pemberwick | 9.5% | 6.1%(+3.40)#35 | 5.0%(+4.50)#5,111 |
| 36. | Quasset Lake | 9.5% | 6.1%(+3.40)#36 | 5.0%(+4.50)#5,156 |
| 37. | New Haven | 9.0% | 6.1%(+2.90)#37 | 5.0%(+4.00)#5,489 |
| 38. | Meriden | 9.0% | 6.1%(+2.90)#38 | 5.0%(+4.00)#5,492 |
| 39. | Putnam | 8.9% | 6.1%(+2.80)#39 | 5.0%(+3.90)#5,587 |
| 40. | Saybrook Manor | 8.9% | 6.1%(+2.80)#40 | 5.0%(+3.90)#5,625 |
| 41. | Groton | 8.8% | 6.1%(+2.70)#41 | 5.0%(+3.80)#5,668 |
| 42. | Rockville | 8.8% | 6.1%(+2.70)#42 | 5.0%(+3.80)#5,672 |
| 43. | West Haven | 8.5% | 6.1%(+2.40)#43 | 5.0%(+3.50)#5,905 |
| 44. | Glenville | 8.3% | 6.1%(+2.20)#44 | 5.0%(+3.30)#6,079 |
| 45. | Portland | 8.1% | 6.1%(+2.00)#45 | 5.0%(+3.10)#6,312 |
| 46. | New Britain | 8.0% | 6.1%(+1.90)#46 | 5.0%(+3.00)#6,376 |
| 47. | Old Mystic | 7.9% | 6.1%(+1.80)#47 | 5.0%(+2.90)#6,517 |
| 48. | Chester Center | 7.7% | 6.1%(+1.60)#48 | 5.0%(+2.70)#6,732 |
| 49. | Blue Hills | 7.6% | 6.1%(+1.50)#49 | 5.0%(+2.60)#6,843 |
| 50. | New London | 7.5% | 6.1%(+1.40)#50 | 5.0%(+2.50)#6,895 |
| 51. | Winsted | 7.4% | 6.1%(+1.30)#51 | 5.0%(+2.40)#7,009 |
| 52. | Colchester | 7.4% | 6.1%(+1.30)#52 | 5.0%(+2.40)#7,014 |
| 53. | Sherwood Manor | 7.3% | 6.1%(+1.20)#53 | 5.0%(+2.30)#7,109 |
| 54. | Madison Center | 7.3% | 6.1%(+1.20)#54 | 5.0%(+2.30)#7,135 |
| 55. | Sandy Hook | 7.2% | 6.1%(+1.10)#55 | 5.0%(+2.20)#7,210 |
| 56. | Pawcatuck | 7.2% | 6.1%(+1.10)#56 | 5.0%(+2.20)#7,221 |
| 57. | Coventry Lake | 7.1% | 6.1%(+1.000)#57 | 5.0%(+2.10)#7,339 |
| 58. | West Simsbury | 7.0% | 6.1%(+0.900)#58 | 5.0%(+2.00)#7,459 |
| 59. | Ball Pond | 7.0% | 6.1%(+0.900)#59 | 5.0%(+2.00)#7,462 |
| 60. | Windsor Locks | 6.9% | 6.1%(+0.800)#60 | 5.0%(+1.90)#7,549 |
| 61. | Derby | 6.8% | 6.1%(+0.700)#61 | 5.0%(+1.80)#7,674 |
| 62. | Shelton | 6.7% | 6.1%(+0.600)#62 | 5.0%(+1.70)#7,798 |
| 63. | Danbury | 6.5% | 6.1%(+0.400)#63 | 5.0%(+1.50)#8,043 |
| 64. | Bristol | 6.5% | 6.1%(+0.400)#64 | 5.0%(+1.50)#8,045 |
| 65. | Stafford Springs | 6.5% | 6.1%(+0.400)#65 | 5.0%(+1.50)#8,092 |
| 66. | Candlewood Orchards | 6.5% | 6.1%(+0.400)#66 | 5.0%(+1.50)#8,170 |
| 67. | Norwalk | 6.4% | 6.1%(+0.300)#67 | 5.0%(+1.40)#8,208 |
| 68. | Moosup | 6.4% | 6.1%(+0.300)#68 | 5.0%(+1.40)#8,289 |
| 69. | East Hampton | 6.4% | 6.1%(+0.300)#69 | 5.0%(+1.40)#8,292 |
| 70. | Cornwall Bridge | 6.4% | 6.1%(+0.300)#70 | 5.0%(+1.40)#8,349 |
| 71. | Murray | 6.3% | 6.1%(+0.200)#71 | 5.0%(+1.30)#8,493 |
| 72. | Westport | 5.8% | 6.1%(-0.300)#72 | 5.0%(+0.800)#9,269 |
| 73. | Old Greenwich | 5.7% | 6.1%(-0.400)#73 | 5.0%(+0.700)#9,423 |
| 74. | Woodmont Borough | 5.7% | 6.1%(-0.400)#74 | 5.0%(+0.700)#9,476 |
| 75. | Noroton Heights | 5.6% | 6.1%(-0.500)#75 | 5.0%(+0.600)#9,623 |
| 76. | Georgetown | 5.6% | 6.1%(-0.500)#76 | 5.0%(+0.600)#9,644 |
| 77. | East Hartford | 5.5% | 6.1%(-0.600)#77 | 5.0%(+0.500)#9,733 |
| 78. | Terryville | 5.5% | 6.1%(-0.600)#78 | 5.0%(+0.500)#9,811 |
| 79. | Naugatuck Borough | 5.3% | 6.1%(-0.800)#79 | 5.0%(+0.300)#10,117 |
| 80. | Ridgefield | 5.3% | 6.1%(-0.800)#80 | 5.0%(+0.300)#10,154 |
| 81. | New Milford | 5.2% | 6.1%(-0.900)#81 | 5.0%(+0.200)#10,348 |
| 82. | Wallingford Center | 5.1% | 6.1%(-1.00)#82 | 5.0%(+0.100)#10,515 |
| 83. | Daniels Farm | 5.1% | 6.1%(-1.00)#83 | 5.0%(+0.100)#10,562 |
| 84. | Candlewood Shores | 5.0% | 6.1%(-1.10)#84 | 5.0%(=0.000)#10,838 |
| 85. | Indian Field | 5.0% | 6.1%(-1.10)#85 | 5.0%(=0.000)#10,854 |
| 86. | Waterford | 4.9% | 6.1%(-1.20)#86 | 5.0%(-0.100)#10,966 |
| 87. | Southwood Acres | 4.7% | 6.1%(-1.40)#87 | 5.0%(-0.300)#11,298 |
| 88. | South Woodstock | 4.7% | 6.1%(-1.40)#88 | 5.0%(-0.300)#11,361 |
| 89. | Stamford | 4.6% | 6.1%(-1.50)#89 | 5.0%(-0.400)#11,421 |
| 90. | East Haven | 4.6% | 6.1%(-1.50)#90 | 5.0%(-0.400)#11,445 |
| 91. | Greenwich | 4.6% | 6.1%(-1.50)#91 | 5.0%(-0.400)#11,463 |
| 92. | Branford Center | 4.6% | 6.1%(-1.50)#92 | 5.0%(-0.400)#11,502 |
| 93. | Westbrook Center | 4.6% | 6.1%(-1.50)#93 | 5.0%(-0.400)#11,540 |
| 94. | Manchester | 4.5% | 6.1%(-1.60)#94 | 5.0%(-0.500)#11,625 |
| 95. | Groton Long Point Borough | 4.5% | 6.1%(-1.60)#95 | 5.0%(-0.500)#11,781 |
| 96. | Middletown | 4.4% | 6.1%(-1.70)#96 | 5.0%(-0.600)#11,824 |
| 97. | Compo | 4.4% | 6.1%(-1.70)#97 | 5.0%(-0.600)#11,911 |
| 98. | Tashua | 4.4% | 6.1%(-1.70)#98 | 5.0%(-0.600)#11,914 |
| 99. | Plantsville | 4.4% | 6.1%(-1.70)#99 | 5.0%(-0.600)#11,939 |
| 100. | Torrington | 4.3% | 6.1%(-1.80)#100 | 5.0%(-0.700)#12,036 |
1
2Common Questions
What are the Top 10 Cities with the Highest Unemployment Rate Among Males in Connecticut?
Top 10 Cities with the Highest Unemployment Rate Among Males in Connecticut are:
#1
28.9%
#2
26.9%
#3
24.4%
#4
23.9%
#5
20.0%
#6
16.8%
#7
15.2%
#8
13.9%
#9
12.0%
#10
12.0%
What city has the Highest Unemployment Rate Among Males in Connecticut?
Tariffville has the Highest Unemployment Rate Among Males in Connecticut with 28.9%.
What is the Unemployment Rate Among Males in the State of Connecticut?
Unemployment Rate Among Males in Connecticut is 6.1%.
What is the Unemployment Rate Among Males in the United States?
Unemployment Rate Among Males in the United States is 5.0%.