Cities with the Highest Unemployment Rate Among Males in Illinois
RELATED REPORTS & OPTIONS
Highest Unemployment | Male
Illinois
Compare Cities
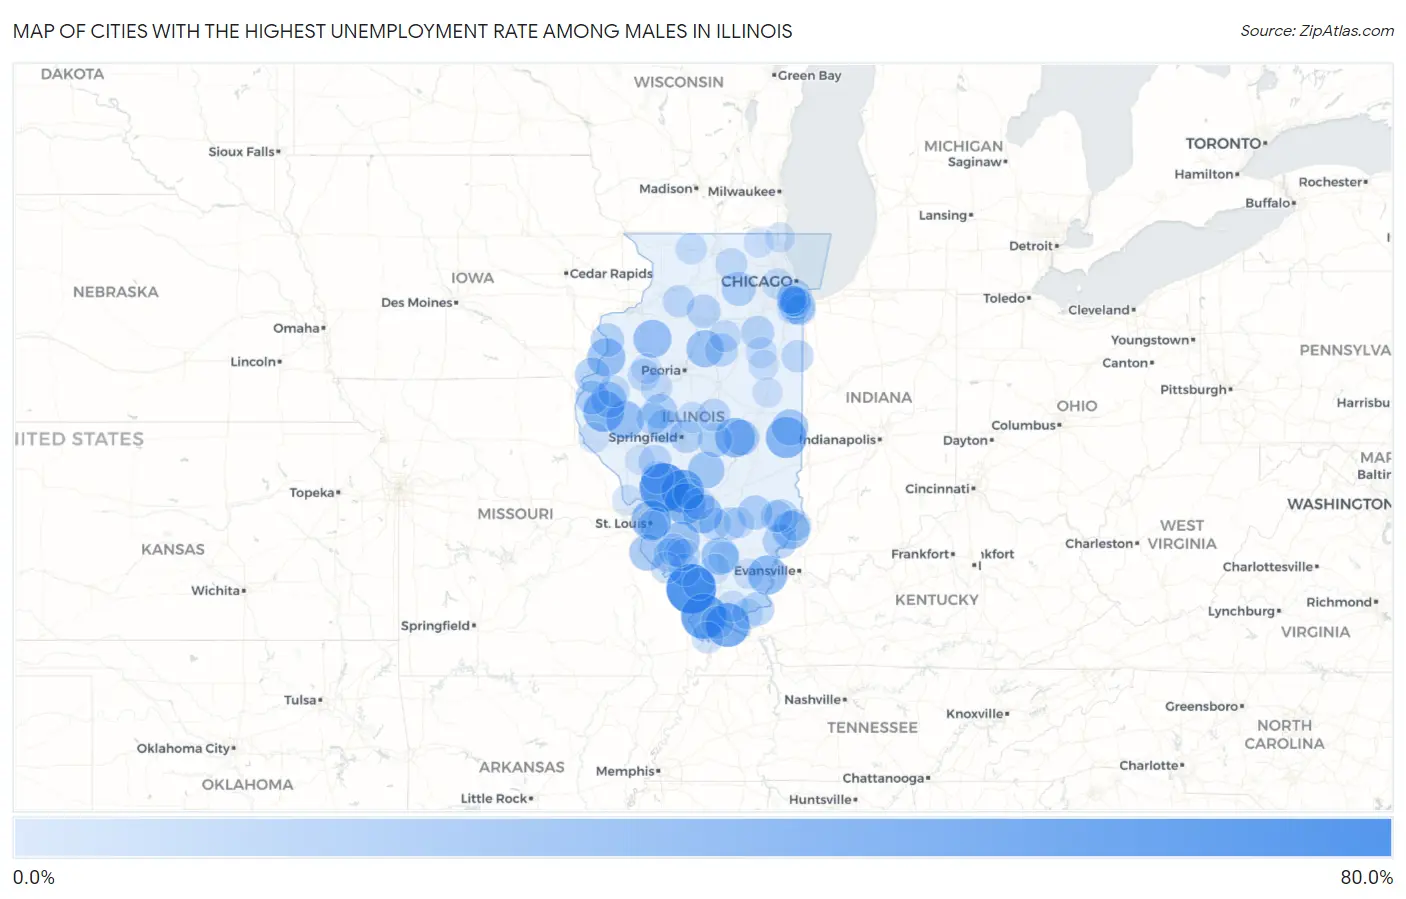
Map of Cities with the Highest Unemployment Rate Among Males in Illinois
0.0%
80.0%
Cities with the Highest Unemployment Rate Among Males in Illinois
| City | Male Unemployment | vs State | vs National | |
| 1. | Gorham | 60.3% | 5.7%(+54.6)#1 | 5.0%(+55.3)#156 |
| 2. | Royal Lakes | 57.9% | 5.7%(+52.2)#2 | 5.0%(+52.9)#173 |
| 3. | Lowpoint | 55.9% | 5.7%(+50.2)#3 | 5.0%(+50.9)#188 |
| 4. | Mill Creek | 50.0% | 5.7%(+44.3)#4 | 5.0%(+45.0)#267 |
| 5. | Joppa | 47.1% | 5.7%(+41.4)#5 | 5.0%(+42.1)#301 |
| 6. | Walshville | 45.2% | 5.7%(+39.5)#6 | 5.0%(+40.2)#332 |
| 7. | Old Ripley | 40.0% | 5.7%(+34.3)#7 | 5.0%(+35.0)#421 |
| 8. | La Prairie | 40.0% | 5.7%(+34.3)#8 | 5.0%(+35.0)#424 |
| 9. | Metcalf | 39.7% | 5.7%(+34.0)#9 | 5.0%(+34.7)#431 |
| 10. | Venice | 37.0% | 5.7%(+31.3)#10 | 5.0%(+32.0)#506 |
| 11. | Laplace | 36.8% | 5.7%(+31.1)#11 | 5.0%(+31.8)#514 |
| 12. | New Haven | 36.1% | 5.7%(+30.4)#12 | 5.0%(+31.1)#532 |
| 13. | Serena | 36.0% | 5.7%(+30.3)#13 | 5.0%(+31.0)#536 |
| 14. | Keyesport | 35.6% | 5.7%(+29.9)#14 | 5.0%(+30.6)#549 |
| 15. | Carman | 34.7% | 5.7%(+29.0)#15 | 5.0%(+29.7)#564 |
| 16. | Gladstone | 33.3% | 5.7%(+27.6)#16 | 5.0%(+28.3)#611 |
| 17. | Ripley | 33.3% | 5.7%(+27.6)#17 | 5.0%(+28.3)#626 |
| 18. | Altona | 33.1% | 5.7%(+27.4)#18 | 5.0%(+28.1)#634 |
| 19. | Allendale | 32.7% | 5.7%(+27.0)#19 | 5.0%(+27.7)#650 |
| 20. | Nason | 31.8% | 5.7%(+26.1)#20 | 5.0%(+26.8)#694 |
| 21. | La Rose | 31.3% | 5.7%(+25.6)#21 | 5.0%(+26.3)#714 |
| 22. | Venedy | 31.0% | 5.7%(+25.3)#22 | 5.0%(+26.0)#728 |
| 23. | Burtons Bridge | 30.0% | 5.7%(+24.3)#23 | 5.0%(+25.0)#766 |
| 24. | Ohlman | 30.0% | 5.7%(+24.3)#24 | 5.0%(+25.0)#769 |
| 25. | Maeystown | 29.4% | 5.7%(+23.7)#25 | 5.0%(+24.4)#805 |
| 26. | Indianola | 29.3% | 5.7%(+23.6)#26 | 5.0%(+24.3)#811 |
| 27. | Plymouth | 28.3% | 5.7%(+22.6)#27 | 5.0%(+23.3)#874 |
| 28. | Glenwood | 28.2% | 5.7%(+22.5)#28 | 5.0%(+23.2)#877 |
| 29. | Hammond | 27.8% | 5.7%(+22.1)#29 | 5.0%(+22.8)#905 |
| 30. | Pontoosuc | 26.7% | 5.7%(+21.0)#30 | 5.0%(+21.7)#981 |
| 31. | Kilbourne | 25.4% | 5.7%(+19.7)#31 | 5.0%(+20.4)#1,064 |
| 32. | Boody | 25.0% | 5.7%(+19.3)#32 | 5.0%(+20.0)#1,089 |
| 33. | Bellmont | 25.0% | 5.7%(+19.3)#33 | 5.0%(+20.0)#1,098 |
| 34. | Sailor Springs | 25.0% | 5.7%(+19.3)#34 | 5.0%(+20.0)#1,100 |
| 35. | Tallula | 24.8% | 5.7%(+19.1)#35 | 5.0%(+19.8)#1,123 |
| 36. | Hinckley | 24.4% | 5.7%(+18.7)#36 | 5.0%(+19.4)#1,152 |
| 37. | Basco | 24.1% | 5.7%(+18.4)#37 | 5.0%(+19.1)#1,178 |
| 38. | Sumner | 24.0% | 5.7%(+18.3)#38 | 5.0%(+19.0)#1,180 |
| 39. | Calumet Park | 23.9% | 5.7%(+18.2)#39 | 5.0%(+18.9)#1,188 |
| 40. | Elizabethtown | 23.5% | 5.7%(+17.8)#40 | 5.0%(+18.5)#1,237 |
| 41. | Keithsburg | 23.4% | 5.7%(+17.7)#41 | 5.0%(+18.4)#1,253 |
| 42. | Arlington | 23.1% | 5.7%(+17.4)#42 | 5.0%(+18.1)#1,286 |
| 43. | Clear Lake | 22.8% | 5.7%(+17.1)#43 | 5.0%(+17.8)#1,319 |
| 44. | Gardner | 22.7% | 5.7%(+17.0)#44 | 5.0%(+17.7)#1,322 |
| 45. | East Hazel Crest | 22.7% | 5.7%(+17.0)#45 | 5.0%(+17.7)#1,323 |
| 46. | Baldwin | 22.7% | 5.7%(+17.0)#46 | 5.0%(+17.7)#1,329 |
| 47. | Dana | 22.2% | 5.7%(+16.5)#47 | 5.0%(+17.2)#1,385 |
| 48. | New Grand Chain | 22.2% | 5.7%(+16.5)#48 | 5.0%(+17.2)#1,386 |
| 49. | Iuka | 21.6% | 5.7%(+15.9)#49 | 5.0%(+16.6)#1,447 |
| 50. | Chesterfield | 21.6% | 5.7%(+15.9)#50 | 5.0%(+16.6)#1,450 |
| 51. | Marissa | 21.5% | 5.7%(+15.8)#51 | 5.0%(+16.5)#1,451 |
| 52. | Scottville | 21.4% | 5.7%(+15.7)#52 | 5.0%(+16.4)#1,470 |
| 53. | Kenney | 21.1% | 5.7%(+15.4)#53 | 5.0%(+16.1)#1,495 |
| 54. | Ritchie | 20.8% | 5.7%(+15.1)#54 | 5.0%(+15.8)#1,520 |
| 55. | Willisville | 20.6% | 5.7%(+14.9)#55 | 5.0%(+15.6)#1,540 |
| 56. | Harrison | 20.5% | 5.7%(+14.8)#56 | 5.0%(+15.5)#1,553 |
| 57. | Odin | 20.5% | 5.7%(+14.8)#57 | 5.0%(+15.5)#1,554 |
| 58. | East St Louis | 20.4% | 5.7%(+14.7)#58 | 5.0%(+15.4)#1,562 |
| 59. | Coulterville | 20.4% | 5.7%(+14.7)#59 | 5.0%(+15.4)#1,569 |
| 60. | Chandlerville | 20.4% | 5.7%(+14.7)#60 | 5.0%(+15.4)#1,571 |
| 61. | Donovan | 20.4% | 5.7%(+14.7)#61 | 5.0%(+15.4)#1,574 |
| 62. | St Francisville | 20.0% | 5.7%(+14.3)#62 | 5.0%(+15.0)#1,607 |
| 63. | Smithboro | 20.0% | 5.7%(+14.3)#63 | 5.0%(+15.0)#1,617 |
| 64. | Claremont | 20.0% | 5.7%(+14.3)#64 | 5.0%(+15.0)#1,623 |
| 65. | Ellisville | 20.0% | 5.7%(+14.3)#65 | 5.0%(+15.0)#1,630 |
| 66. | Deer Grove | 20.0% | 5.7%(+14.3)#66 | 5.0%(+15.0)#1,636 |
| 67. | Kangley | 19.6% | 5.7%(+13.9)#67 | 5.0%(+14.6)#1,676 |
| 68. | Bryant | 19.6% | 5.7%(+13.9)#68 | 5.0%(+14.6)#1,677 |
| 69. | Cairo | 19.4% | 5.7%(+13.7)#69 | 5.0%(+14.4)#1,701 |
| 70. | Tennessee | 19.4% | 5.7%(+13.7)#70 | 5.0%(+14.4)#1,709 |
| 71. | Kingston | 19.1% | 5.7%(+13.4)#71 | 5.0%(+14.1)#1,741 |
| 72. | Ellis Grove | 19.0% | 5.7%(+13.3)#72 | 5.0%(+14.0)#1,760 |
| 73. | Ridott | 18.5% | 5.7%(+12.8)#73 | 5.0%(+13.5)#1,842 |
| 74. | Ina | 18.4% | 5.7%(+12.7)#74 | 5.0%(+13.4)#1,851 |
| 75. | Olympia Fields | 18.2% | 5.7%(+12.5)#75 | 5.0%(+13.2)#1,873 |
| 76. | Phoenix | 18.2% | 5.7%(+12.5)#76 | 5.0%(+13.2)#1,880 |
| 77. | Broadwell | 18.2% | 5.7%(+12.5)#77 | 5.0%(+13.2)#1,890 |
| 78. | Simpson | 18.2% | 5.7%(+12.5)#78 | 5.0%(+13.2)#1,894 |
| 79. | Golconda | 18.0% | 5.7%(+12.3)#79 | 5.0%(+13.0)#1,918 |
| 80. | Sauk Village | 17.7% | 5.7%(+12.0)#80 | 5.0%(+12.7)#1,957 |
| 81. | Kempton | 17.7% | 5.7%(+12.0)#81 | 5.0%(+12.7)#1,963 |
| 82. | Xenia | 17.6% | 5.7%(+11.9)#82 | 5.0%(+12.6)#1,976 |
| 83. | Oak Brook | 17.5% | 5.7%(+11.8)#83 | 5.0%(+12.5)#1,985 |
| 84. | Sauget | 17.4% | 5.7%(+11.7)#84 | 5.0%(+12.4)#2,015 |
| 85. | Panama | 17.1% | 5.7%(+11.4)#85 | 5.0%(+12.1)#2,075 |
| 86. | Harvey | 17.0% | 5.7%(+11.3)#86 | 5.0%(+12.0)#2,083 |
| 87. | Markham | 16.8% | 5.7%(+11.1)#87 | 5.0%(+11.8)#2,118 |
| 88. | Plainville | 16.7% | 5.7%(+11.0)#88 | 5.0%(+11.7)#2,165 |
| 89. | Broughton | 16.7% | 5.7%(+11.0)#89 | 5.0%(+11.7)#2,171 |
| 90. | Brussels | 16.7% | 5.7%(+11.0)#90 | 5.0%(+11.7)#2,175 |
| 91. | Piper City | 16.4% | 5.7%(+10.7)#91 | 5.0%(+11.4)#2,226 |
| 92. | Mccullom Lake | 16.3% | 5.7%(+10.6)#92 | 5.0%(+11.3)#2,243 |
| 93. | London Mills | 16.3% | 5.7%(+10.6)#93 | 5.0%(+11.3)#2,251 |
| 94. | Ludlow | 16.0% | 5.7%(+10.3)#94 | 5.0%(+11.0)#2,315 |
| 95. | Wadsworth | 15.9% | 5.7%(+10.2)#95 | 5.0%(+10.9)#2,330 |
| 96. | Cahokia Heights | 15.8% | 5.7%(+10.1)#96 | 5.0%(+10.8)#2,352 |
| 97. | Roodhouse | 15.8% | 5.7%(+10.1)#97 | 5.0%(+10.8)#2,364 |
| 98. | Robbins | 15.6% | 5.7%(+9.90)#98 | 5.0%(+10.6)#2,406 |
| 99. | Tilden | 15.5% | 5.7%(+9.80)#99 | 5.0%(+10.5)#2,442 |
| 100. | North City | 15.5% | 5.7%(+9.80)#100 | 5.0%(+10.5)#2,444 |
Common Questions
What are the Top 10 Cities with the Highest Unemployment Rate Among Males in Illinois?
Top 10 Cities with the Highest Unemployment Rate Among Males in Illinois are:
#1
60.3%
#2
57.9%
#3
50.0%
#4
47.1%
#5
45.2%
#6
40.0%
#7
40.0%
#8
39.7%
#9
37.0%
#10
36.8%
What city has the Highest Unemployment Rate Among Males in Illinois?
Gorham has the Highest Unemployment Rate Among Males in Illinois with 60.3%.
What is the Unemployment Rate Among Males in the State of Illinois?
Unemployment Rate Among Males in Illinois is 5.7%.
What is the Unemployment Rate Among Males in the United States?
Unemployment Rate Among Males in the United States is 5.0%.