Cities with the Highest Unemployment Rate Among Males in Indiana
RELATED REPORTS & OPTIONS
Highest Unemployment | Male
Indiana
Compare Cities
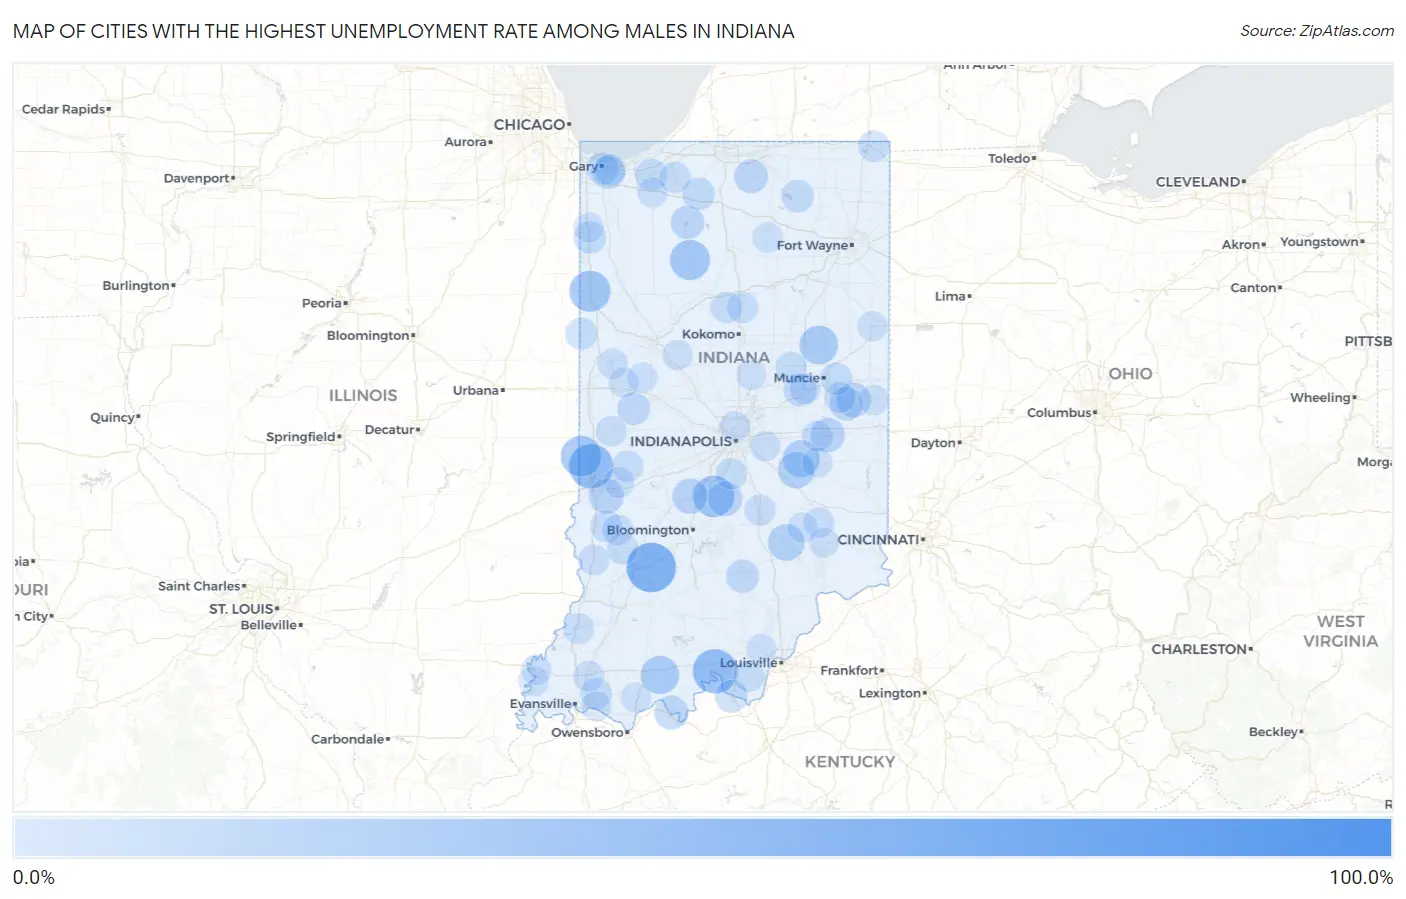
Map of Cities with the Highest Unemployment Rate Among Males in Indiana
0.0%
100.0%
Cities with the Highest Unemployment Rate Among Males in Indiana
| City | Male Unemployment | vs State | vs National | |
| 1. | Urbana | 100.0% | 4.3%(+95.7)#1 | 5.0%(+95.0)#26 |
| 2. | Lake Bruce | 84.8% | 4.3%(+80.5)#2 | 5.0%(+79.8)#80 |
| 3. | Scotland | 62.5% | 4.3%(+58.2)#3 | 5.0%(+57.5)#145 |
| 4. | Thayer | 52.7% | 4.3%(+48.4)#4 | 5.0%(+47.7)#227 |
| 5. | Fountaintown | 52.6% | 4.3%(+48.3)#5 | 5.0%(+47.6)#230 |
| 6. | Keystone | 50.0% | 4.3%(+45.7)#6 | 5.0%(+45.0)#257 |
| 7. | Leavenworth | 49.0% | 4.3%(+44.7)#7 | 5.0%(+44.0)#281 |
| 8. | Shepardsville | 48.3% | 4.3%(+44.0)#8 | 5.0%(+43.3)#287 |
| 9. | Bear Lake | 42.9% | 4.3%(+38.6)#9 | 5.0%(+37.9)#364 |
| 10. | Painted Hills | 40.2% | 4.3%(+35.9)#10 | 5.0%(+35.2)#415 |
| 11. | Patricksburg | 39.4% | 4.3%(+35.1)#11 | 5.0%(+34.4)#436 |
| 12. | Kentland | 39.1% | 4.3%(+34.8)#12 | 5.0%(+34.1)#442 |
| 13. | Billtown | 38.5% | 4.3%(+34.2)#13 | 5.0%(+33.5)#462 |
| 14. | Blanford | 38.3% | 4.3%(+34.0)#14 | 5.0%(+33.3)#471 |
| 15. | Star City | 36.7% | 4.3%(+32.4)#15 | 5.0%(+31.7)#517 |
| 16. | Shamrock Lakes | 32.8% | 4.3%(+28.5)#16 | 5.0%(+27.8)#645 |
| 17. | Burnett | 32.1% | 4.3%(+27.8)#17 | 5.0%(+27.1)#676 |
| 18. | St Meinrad | 31.7% | 4.3%(+27.4)#18 | 5.0%(+26.7)#696 |
| 19. | Millgrove | 29.2% | 4.3%(+24.9)#19 | 5.0%(+24.2)#820 |
| 20. | Anoka | 28.9% | 4.3%(+24.6)#20 | 5.0%(+23.9)#832 |
| 21. | Arlington | 28.3% | 4.3%(+24.0)#21 | 5.0%(+23.3)#875 |
| 22. | Spencerville | 27.9% | 4.3%(+23.6)#22 | 5.0%(+22.9)#891 |
| 23. | Manilla | 27.0% | 4.3%(+22.7)#23 | 5.0%(+22.0)#965 |
| 24. | Scipio | 27.0% | 4.3%(+22.7)#24 | 5.0%(+22.0)#967 |
| 25. | Eden | 24.5% | 4.3%(+20.2)#25 | 5.0%(+19.5)#1,145 |
| 26. | Sardinia | 24.5% | 4.3%(+20.2)#26 | 5.0%(+19.5)#1,146 |
| 27. | Wawaka | 24.2% | 4.3%(+19.9)#27 | 5.0%(+19.2)#1,172 |
| 28. | Paragon | 23.8% | 4.3%(+19.5)#28 | 5.0%(+18.8)#1,205 |
| 29. | Antioch | 22.6% | 4.3%(+18.3)#29 | 5.0%(+17.6)#1,345 |
| 30. | Riley | 22.3% | 4.3%(+18.0)#30 | 5.0%(+17.3)#1,365 |
| 31. | Modoc | 22.2% | 4.3%(+17.9)#31 | 5.0%(+17.2)#1,381 |
| 32. | Morgantown | 22.1% | 4.3%(+17.8)#32 | 5.0%(+17.1)#1,399 |
| 33. | Lewisville | 21.2% | 4.3%(+16.9)#33 | 5.0%(+16.2)#1,483 |
| 34. | Libertyville | 20.8% | 4.3%(+16.5)#34 | 5.0%(+15.8)#1,519 |
| 35. | Cannelton | 19.8% | 4.3%(+15.5)#35 | 5.0%(+14.8)#1,654 |
| 36. | Wakarusa | 19.6% | 4.3%(+15.3)#36 | 5.0%(+14.6)#1,672 |
| 37. | Losantville | 19.0% | 4.3%(+14.7)#37 | 5.0%(+14.0)#1,762 |
| 38. | Bass Lake | 18.9% | 4.3%(+14.6)#38 | 5.0%(+13.9)#1,773 |
| 39. | Vallonia | 17.9% | 4.3%(+13.6)#39 | 5.0%(+12.9)#1,937 |
| 40. | New Chicago | 17.2% | 4.3%(+12.9)#40 | 5.0%(+12.2)#2,037 |
| 41. | Chesterfield | 17.0% | 4.3%(+12.7)#41 | 5.0%(+12.0)#2,087 |
| 42. | Mauckport | 16.7% | 4.3%(+12.4)#42 | 5.0%(+11.7)#2,179 |
| 43. | Alamo | 16.7% | 4.3%(+12.4)#43 | 5.0%(+11.7)#2,181 |
| 44. | Cromwell | 16.5% | 4.3%(+12.2)#44 | 5.0%(+11.5)#2,209 |
| 45. | Lake Village | 16.0% | 4.3%(+11.7)#45 | 5.0%(+11.0)#2,311 |
| 46. | Westville | 15.9% | 4.3%(+11.6)#46 | 5.0%(+10.9)#2,328 |
| 47. | Gary | 15.8% | 4.3%(+11.5)#47 | 5.0%(+10.8)#2,351 |
| 48. | Koontz Lake | 15.6% | 4.3%(+11.3)#48 | 5.0%(+10.6)#2,417 |
| 49. | Enchanted Hills | 15.1% | 4.3%(+10.8)#49 | 5.0%(+10.1)#2,551 |
| 50. | Selma | 15.0% | 4.3%(+10.7)#50 | 5.0%(+10.00)#2,578 |
| 51. | Ambia | 15.0% | 4.3%(+10.7)#51 | 5.0%(+10.00)#2,586 |
| 52. | Holiday Woods | 14.9% | 4.3%(+10.6)#52 | 5.0%(+9.90)#2,619 |
| 53. | Hymera | 14.6% | 4.3%(+10.3)#53 | 5.0%(+9.60)#2,688 |
| 54. | Alexandria | 13.8% | 4.3%(+9.50)#54 | 5.0%(+8.80)#2,920 |
| 55. | Chandler | 13.7% | 4.3%(+9.40)#55 | 5.0%(+8.70)#2,963 |
| 56. | Lake Station | 13.6% | 4.3%(+9.30)#56 | 5.0%(+8.60)#2,986 |
| 57. | Linton | 13.5% | 4.3%(+9.20)#57 | 5.0%(+8.50)#3,020 |
| 58. | Bargersville | 13.4% | 4.3%(+9.10)#58 | 5.0%(+8.40)#3,049 |
| 59. | Carbon | 13.4% | 4.3%(+9.10)#59 | 5.0%(+8.40)#3,068 |
| 60. | Fremont | 13.3% | 4.3%(+9.00)#60 | 5.0%(+8.30)#3,080 |
| 61. | Lake Of The Woods | 13.3% | 4.3%(+9.00)#61 | 5.0%(+8.30)#3,094 |
| 62. | Reddington | 13.3% | 4.3%(+9.00)#62 | 5.0%(+8.30)#3,103 |
| 63. | New Middletown | 13.3% | 4.3%(+9.00)#63 | 5.0%(+8.30)#3,123 |
| 64. | Mineral Springs | 13.2% | 4.3%(+8.90)#64 | 5.0%(+8.20)#3,144 |
| 65. | Walton | 13.0% | 4.3%(+8.70)#65 | 5.0%(+8.00)#3,210 |
| 66. | Kingsbury | 13.0% | 4.3%(+8.70)#66 | 5.0%(+8.00)#3,226 |
| 67. | Bunker Hill | 12.7% | 4.3%(+8.40)#67 | 5.0%(+7.70)#3,341 |
| 68. | Taylorsville | 12.5% | 4.3%(+8.20)#68 | 5.0%(+7.50)#3,418 |
| 69. | Dunreith | 12.5% | 4.3%(+8.20)#69 | 5.0%(+7.50)#3,434 |
| 70. | Blountsville | 12.5% | 4.3%(+8.20)#70 | 5.0%(+7.50)#3,449 |
| 71. | Jasonville | 12.2% | 4.3%(+7.90)#71 | 5.0%(+7.20)#3,566 |
| 72. | Daleville | 12.2% | 4.3%(+7.90)#72 | 5.0%(+7.20)#3,568 |
| 73. | Elberfeld | 12.1% | 4.3%(+7.80)#73 | 5.0%(+7.10)#3,621 |
| 74. | Hazleton | 12.1% | 4.3%(+7.80)#74 | 5.0%(+7.10)#3,632 |
| 75. | Midland | 11.9% | 4.3%(+7.60)#75 | 5.0%(+6.90)#3,732 |
| 76. | Carlisle | 11.8% | 4.3%(+7.50)#76 | 5.0%(+6.80)#3,766 |
| 77. | Staunton | 11.6% | 4.3%(+7.30)#77 | 5.0%(+6.60)#3,881 |
| 78. | Bloomingdale | 11.4% | 4.3%(+7.10)#78 | 5.0%(+6.40)#3,970 |
| 79. | North Crows Nest | 11.1% | 4.3%(+6.80)#79 | 5.0%(+6.10)#4,137 |
| 80. | Attica | 11.0% | 4.3%(+6.70)#80 | 5.0%(+6.00)#4,153 |
| 81. | Millhousen | 11.0% | 4.3%(+6.70)#81 | 5.0%(+6.00)#4,179 |
| 82. | Jimmerson Lake | 10.9% | 4.3%(+6.60)#82 | 5.0%(+5.90)#4,206 |
| 83. | New Palestine | 10.7% | 4.3%(+6.40)#83 | 5.0%(+5.70)#4,316 |
| 84. | Newburgh | 10.6% | 4.3%(+6.30)#84 | 5.0%(+5.60)#4,371 |
| 85. | Rushville | 10.5% | 4.3%(+6.20)#85 | 5.0%(+5.50)#4,434 |
| 86. | New Harmony | 10.5% | 4.3%(+6.20)#86 | 5.0%(+5.50)#4,462 |
| 87. | Chrisney | 10.5% | 4.3%(+6.20)#87 | 5.0%(+5.50)#4,468 |
| 88. | Claypool | 10.5% | 4.3%(+6.20)#88 | 5.0%(+5.50)#4,474 |
| 89. | Griffin | 10.5% | 4.3%(+6.20)#89 | 5.0%(+5.50)#4,485 |
| 90. | Mulberry | 10.4% | 4.3%(+6.10)#90 | 5.0%(+5.40)#4,525 |
| 91. | Bryant | 10.3% | 4.3%(+6.00)#91 | 5.0%(+5.30)#4,598 |
| 92. | Atlanta | 10.2% | 4.3%(+5.90)#92 | 5.0%(+5.20)#4,648 |
| 93. | Schneider | 10.2% | 4.3%(+5.90)#93 | 5.0%(+5.20)#4,663 |
| 94. | Lynn | 10.1% | 4.3%(+5.80)#94 | 5.0%(+5.10)#4,699 |
| 95. | Westport | 10.0% | 4.3%(+5.70)#95 | 5.0%(+5.00)#4,763 |
| 96. | Holton | 10.0% | 4.3%(+5.70)#96 | 5.0%(+5.00)#4,777 |
| 97. | New Richmond | 10.0% | 4.3%(+5.70)#97 | 5.0%(+5.00)#4,782 |
| 98. | Mellott | 10.0% | 4.3%(+5.70)#98 | 5.0%(+5.00)#4,797 |
| 99. | Galena | 9.9% | 4.3%(+5.60)#99 | 5.0%(+4.90)#4,849 |
| 100. | Wanatah | 9.9% | 4.3%(+5.60)#100 | 5.0%(+4.90)#4,856 |
Common Questions
What are the Top 10 Cities with the Highest Unemployment Rate Among Males in Indiana?
Top 10 Cities with the Highest Unemployment Rate Among Males in Indiana are:
#1
62.5%
#2
49.0%
#3
48.3%
#4
40.2%
#5
39.1%
#6
38.3%
#7
36.7%
#8
32.8%
#9
31.7%
#10
28.3%
What city has the Highest Unemployment Rate Among Males in Indiana?
Scotland has the Highest Unemployment Rate Among Males in Indiana with 62.5%.
What is the Unemployment Rate Among Males in the State of Indiana?
Unemployment Rate Among Males in Indiana is 4.3%.
What is the Unemployment Rate Among Males in the United States?
Unemployment Rate Among Males in the United States is 5.0%.