Cities with the Highest Unemployment Rate Among Males in Tennessee
RELATED REPORTS & OPTIONS
Highest Unemployment | Male
Tennessee
Compare Cities
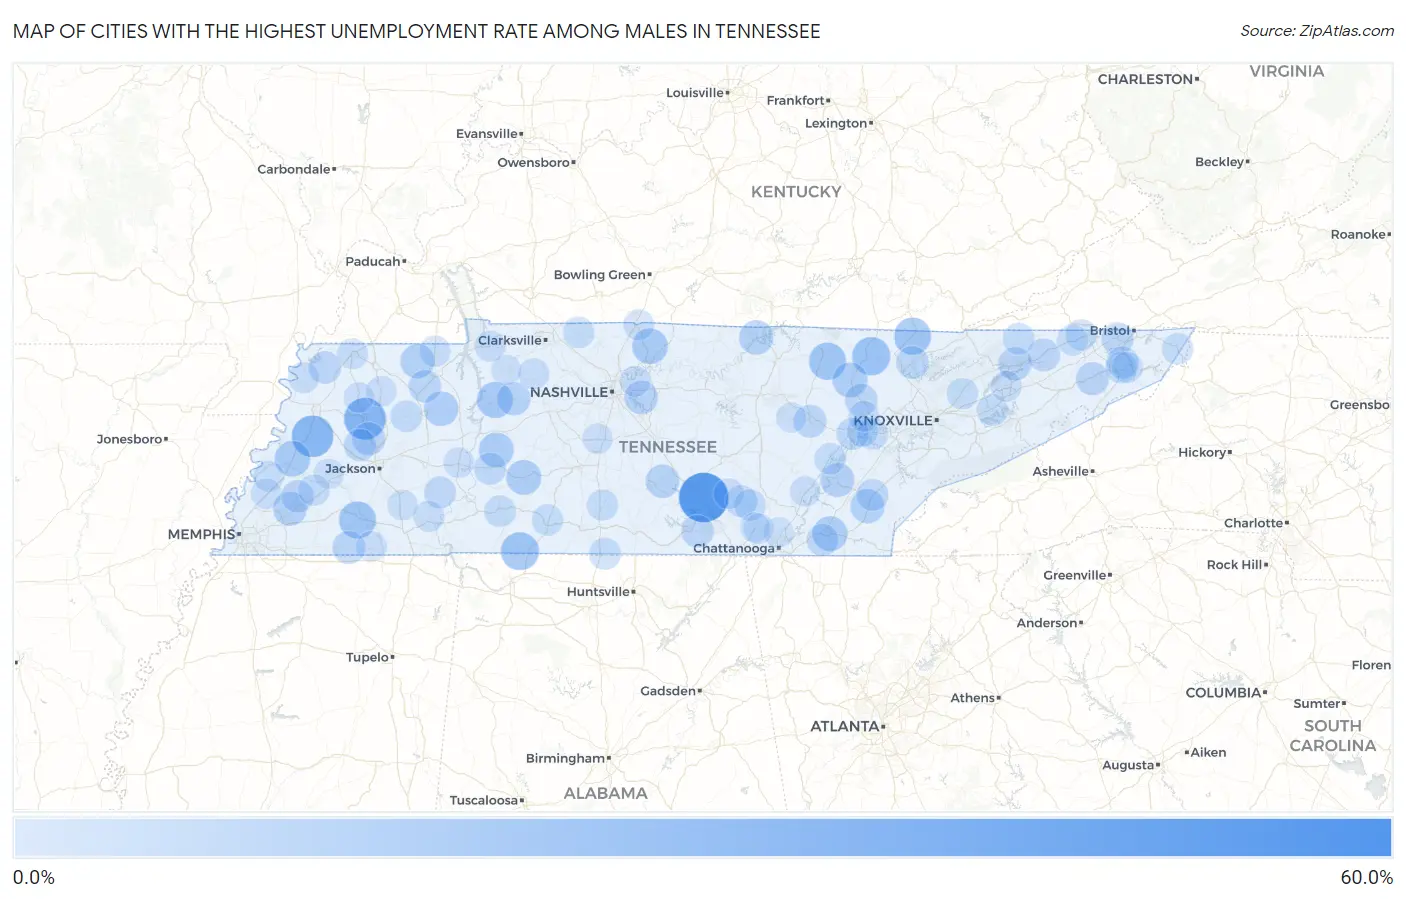
Map of Cities with the Highest Unemployment Rate Among Males in Tennessee
0.0%
60.0%
Cities with the Highest Unemployment Rate Among Males in Tennessee
| City | Male Unemployment | vs State | vs National | |
| 1. | Oak Grove Cdp Sumner County | 54.5% | 4.5%(+50.0)#1 | 5.0%(+49.5)#201 |
| 2. | Hillsboro | 50.0% | 4.5%(+45.5)#2 | 5.0%(+45.0)#252 |
| 3. | Wildersville | 47.6% | 4.5%(+43.1)#3 | 5.0%(+42.6)#293 |
| 4. | Beech Bluff | 33.3% | 4.5%(+28.8)#4 | 5.0%(+28.3)#602 |
| 5. | Trenton | 32.9% | 4.5%(+28.4)#5 | 5.0%(+27.9)#637 |
| 6. | Gates | 32.5% | 4.5%(+28.0)#6 | 5.0%(+27.5)#659 |
| 7. | Huntsville | 24.8% | 4.5%(+20.3)#7 | 5.0%(+19.8)#1,120 |
| 8. | Iron City | 24.6% | 4.5%(+20.1)#8 | 5.0%(+19.6)#1,138 |
| 9. | Bolivar | 22.9% | 4.5%(+18.4)#9 | 5.0%(+17.9)#1,295 |
| 10. | Jellico | 22.9% | 4.5%(+18.4)#10 | 5.0%(+17.9)#1,297 |
| 11. | Allardt | 22.9% | 4.5%(+18.4)#11 | 5.0%(+17.9)#1,300 |
| 12. | Waverly | 20.5% | 4.5%(+16.0)#12 | 5.0%(+15.5)#1,546 |
| 13. | Henning | 19.6% | 4.5%(+15.1)#13 | 5.0%(+14.6)#1,673 |
| 14. | Graball | 19.6% | 4.5%(+15.1)#14 | 5.0%(+14.6)#1,678 |
| 15. | East Cleveland | 18.4% | 4.5%(+13.9)#15 | 5.0%(+13.4)#1,849 |
| 16. | Hohenwald | 18.1% | 4.5%(+13.6)#16 | 5.0%(+13.1)#1,900 |
| 17. | Sunbright | 18.1% | 4.5%(+13.6)#17 | 5.0%(+13.1)#1,906 |
| 18. | Lobelville | 18.0% | 4.5%(+13.5)#18 | 5.0%(+13.0)#1,917 |
| 19. | Hollow Rock | 17.2% | 4.5%(+12.7)#19 | 5.0%(+12.2)#2,048 |
| 20. | Celina | 16.9% | 4.5%(+12.4)#20 | 5.0%(+11.9)#2,103 |
| 21. | Cottage Grove | 16.7% | 4.5%(+12.2)#21 | 5.0%(+11.7)#2,180 |
| 22. | Etowah | 16.4% | 4.5%(+11.9)#22 | 5.0%(+11.4)#2,214 |
| 23. | Decatur | 16.2% | 4.5%(+11.7)#23 | 5.0%(+11.2)#2,262 |
| 24. | Rocky Top | 16.1% | 4.5%(+11.6)#24 | 5.0%(+11.1)#2,280 |
| 25. | Gallaway | 16.0% | 4.5%(+11.5)#25 | 5.0%(+11.0)#2,309 |
| 26. | Delano | 15.8% | 4.5%(+11.3)#26 | 5.0%(+10.8)#2,367 |
| 27. | Wartrace | 15.5% | 4.5%(+11.0)#27 | 5.0%(+10.5)#2,445 |
| 28. | Rural Hill | 15.2% | 4.5%(+10.7)#28 | 5.0%(+10.2)#2,518 |
| 29. | Mcewen | 14.8% | 4.5%(+10.3)#29 | 5.0%(+9.80)#2,629 |
| 30. | Mooresburg | 14.7% | 4.5%(+10.2)#30 | 5.0%(+9.70)#2,659 |
| 31. | Humboldt | 14.4% | 4.5%(+9.90)#31 | 5.0%(+9.40)#2,730 |
| 32. | Telford | 14.2% | 4.5%(+9.70)#32 | 5.0%(+9.20)#2,810 |
| 33. | Saulsbury | 13.9% | 4.5%(+9.40)#33 | 5.0%(+8.90)#2,908 |
| 34. | Crossville | 13.7% | 4.5%(+9.20)#34 | 5.0%(+8.70)#2,954 |
| 35. | Rogersville | 13.7% | 4.5%(+9.20)#35 | 5.0%(+8.70)#2,961 |
| 36. | La Follette | 13.4% | 4.5%(+8.90)#36 | 5.0%(+8.40)#3,051 |
| 37. | Cowan | 13.2% | 4.5%(+8.70)#37 | 5.0%(+8.20)#3,136 |
| 38. | Wartburg | 13.1% | 4.5%(+8.60)#38 | 5.0%(+8.10)#3,170 |
| 39. | Henry | 13.1% | 4.5%(+8.60)#39 | 5.0%(+8.10)#3,176 |
| 40. | Hornbeak | 13.1% | 4.5%(+8.60)#40 | 5.0%(+8.10)#3,181 |
| 41. | Mason | 13.0% | 4.5%(+8.50)#41 | 5.0%(+8.00)#3,202 |
| 42. | Blountville | 12.6% | 4.5%(+8.10)#42 | 5.0%(+7.60)#3,372 |
| 43. | Mcdonald | 12.5% | 4.5%(+8.00)#43 | 5.0%(+7.50)#3,419 |
| 44. | Gadsden | 12.5% | 4.5%(+8.00)#44 | 5.0%(+7.50)#3,429 |
| 45. | Watauga | 12.4% | 4.5%(+7.90)#45 | 5.0%(+7.40)#3,497 |
| 46. | South Cleveland | 12.2% | 4.5%(+7.70)#46 | 5.0%(+7.20)#3,554 |
| 47. | Westpoint | 12.2% | 4.5%(+7.70)#47 | 5.0%(+7.20)#3,583 |
| 48. | Linden | 12.1% | 4.5%(+7.60)#48 | 5.0%(+7.10)#3,613 |
| 49. | Hampton | 12.0% | 4.5%(+7.50)#49 | 5.0%(+7.00)#3,670 |
| 50. | Sardis | 11.9% | 4.5%(+7.40)#50 | 5.0%(+6.90)#3,728 |
| 51. | Rockwood | 11.8% | 4.5%(+7.30)#51 | 5.0%(+6.80)#3,741 |
| 52. | Gruetli Laager | 11.8% | 4.5%(+7.30)#52 | 5.0%(+6.80)#3,756 |
| 53. | Englewood | 11.7% | 4.5%(+7.20)#53 | 5.0%(+6.70)#3,820 |
| 54. | Sneedville | 11.5% | 4.5%(+7.00)#54 | 5.0%(+6.50)#3,910 |
| 55. | Ardmore | 11.5% | 4.5%(+7.00)#55 | 5.0%(+6.50)#3,914 |
| 56. | Waynesboro | 11.4% | 4.5%(+6.90)#56 | 5.0%(+6.40)#3,953 |
| 57. | Central | 11.1% | 4.5%(+6.60)#57 | 5.0%(+6.10)#4,086 |
| 58. | Mclemoresville | 11.1% | 4.5%(+6.60)#58 | 5.0%(+6.10)#4,110 |
| 59. | Palmer | 11.0% | 4.5%(+6.50)#59 | 5.0%(+6.00)#4,170 |
| 60. | Lawrenceburg | 10.8% | 4.5%(+6.30)#60 | 5.0%(+5.80)#4,235 |
| 61. | Kingston | 10.8% | 4.5%(+6.30)#61 | 5.0%(+5.80)#4,244 |
| 62. | Dandridge | 10.8% | 4.5%(+6.30)#62 | 5.0%(+5.80)#4,254 |
| 63. | Blaine | 10.7% | 4.5%(+6.20)#63 | 5.0%(+5.70)#4,318 |
| 64. | Spring City | 10.7% | 4.5%(+6.20)#64 | 5.0%(+5.70)#4,319 |
| 65. | Adams | 10.7% | 4.5%(+6.20)#65 | 5.0%(+5.70)#4,341 |
| 66. | Stanton | 10.7% | 4.5%(+6.20)#66 | 5.0%(+5.70)#4,342 |
| 67. | Briceville | 10.6% | 4.5%(+6.10)#67 | 5.0%(+5.60)#4,410 |
| 68. | Mountain City | 10.5% | 4.5%(+6.00)#68 | 5.0%(+5.50)#4,444 |
| 69. | Strawberry Plains | 10.4% | 4.5%(+5.90)#69 | 5.0%(+5.40)#4,516 |
| 70. | Cornersville | 10.3% | 4.5%(+5.80)#70 | 5.0%(+5.30)#4,574 |
| 71. | Mount Carmel | 10.2% | 4.5%(+5.70)#71 | 5.0%(+5.20)#4,624 |
| 72. | Midtown | 10.2% | 4.5%(+5.70)#72 | 5.0%(+5.20)#4,638 |
| 73. | Puryear | 10.1% | 4.5%(+5.60)#73 | 5.0%(+5.10)#4,710 |
| 74. | Ridgely | 10.0% | 4.5%(+5.50)#74 | 5.0%(+5.00)#4,762 |
| 75. | Oakdale | 10.0% | 4.5%(+5.50)#75 | 5.0%(+5.00)#4,790 |
| 76. | Slayden | 10.0% | 4.5%(+5.50)#76 | 5.0%(+5.00)#4,793 |
| 77. | Church Hill | 9.9% | 4.5%(+5.40)#77 | 5.0%(+4.90)#4,826 |
| 78. | Dover | 9.8% | 4.5%(+5.30)#78 | 5.0%(+4.80)#4,914 |
| 79. | Burlison | 9.8% | 4.5%(+5.30)#79 | 5.0%(+4.80)#4,941 |
| 80. | Adamsville | 9.7% | 4.5%(+5.20)#80 | 5.0%(+4.70)#4,982 |
| 81. | Morristown | 9.6% | 4.5%(+5.10)#81 | 5.0%(+4.60)#5,029 |
| 82. | Elizabethton | 9.6% | 4.5%(+5.10)#82 | 5.0%(+4.60)#5,034 |
| 83. | Union City | 9.5% | 4.5%(+5.00)#83 | 5.0%(+4.50)#5,098 |
| 84. | Mitchellville | 9.5% | 4.5%(+5.00)#84 | 5.0%(+4.50)#5,159 |
| 85. | Munford | 9.2% | 4.5%(+4.70)#85 | 5.0%(+4.20)#5,342 |
| 86. | Green Hill | 9.1% | 4.5%(+4.60)#86 | 5.0%(+4.10)#5,412 |
| 87. | Altamont | 9.1% | 4.5%(+4.60)#87 | 5.0%(+4.10)#5,446 |
| 88. | Greenfield | 9.0% | 4.5%(+4.50)#88 | 5.0%(+4.00)#5,522 |
| 89. | Finger | 9.0% | 4.5%(+4.50)#89 | 5.0%(+4.00)#5,556 |
| 90. | Thompson S Station | 8.9% | 4.5%(+4.40)#90 | 5.0%(+3.90)#5,585 |
| 91. | Middleton | 8.9% | 4.5%(+4.40)#91 | 5.0%(+3.90)#5,635 |
| 92. | Parsons | 8.8% | 4.5%(+4.30)#92 | 5.0%(+3.80)#5,691 |
| 93. | Graysville | 8.6% | 4.5%(+4.10)#93 | 5.0%(+3.60)#5,876 |
| 94. | Rutherford | 8.6% | 4.5%(+4.10)#94 | 5.0%(+3.60)#5,881 |
| 95. | Brownsville | 8.5% | 4.5%(+4.00)#95 | 5.0%(+3.50)#5,919 |
| 96. | Walden | 8.5% | 4.5%(+4.00)#96 | 5.0%(+3.50)#5,940 |
| 97. | Erin | 8.3% | 4.5%(+3.80)#97 | 5.0%(+3.30)#6,099 |
| 98. | Powells Crossroads | 8.2% | 4.5%(+3.70)#98 | 5.0%(+3.20)#6,226 |
| 99. | Whitwell | 8.2% | 4.5%(+3.70)#99 | 5.0%(+3.20)#6,228 |
| 100. | Pleasant Hill | 8.2% | 4.5%(+3.70)#100 | 5.0%(+3.20)#6,254 |
Common Questions
What are the Top 10 Cities with the Highest Unemployment Rate Among Males in Tennessee?
Top 10 Cities with the Highest Unemployment Rate Among Males in Tennessee are:
What city has the Highest Unemployment Rate Among Males in Tennessee?
Hillsboro has the Highest Unemployment Rate Among Males in Tennessee with 50.0%.
What is the Unemployment Rate Among Males in the State of Tennessee?
Unemployment Rate Among Males in Tennessee is 4.5%.
What is the Unemployment Rate Among Males in the United States?
Unemployment Rate Among Males in the United States is 5.0%.