Cities with the Highest Percentage of Slovak Population in Illinois
RELATED REPORTS & OPTIONS
Slovak
Illinois
Compare Cities
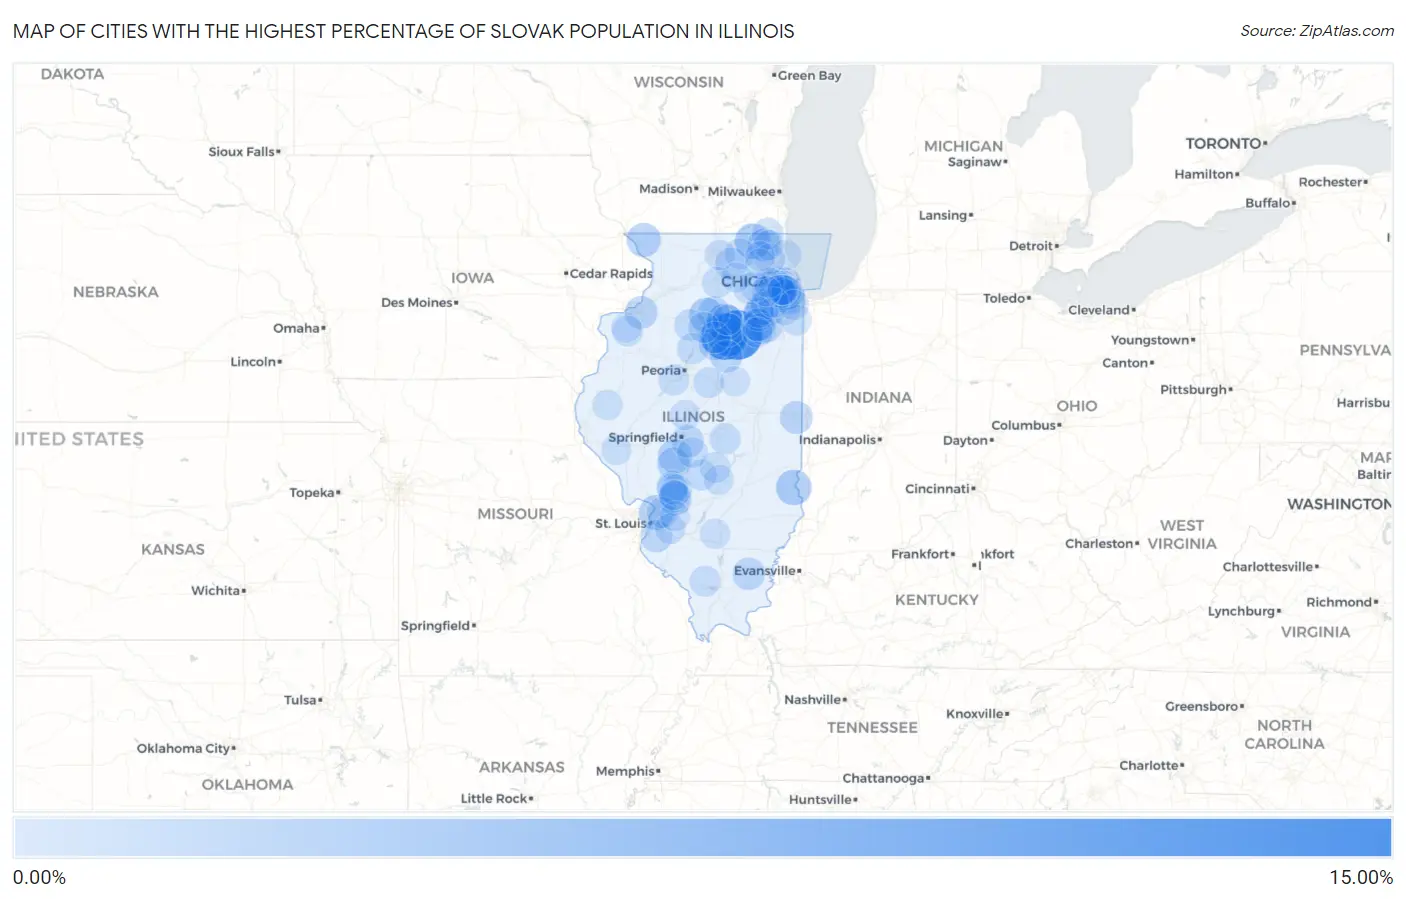
Map of Cities with the Highest Percentage of Slovak Population in Illinois
0.00%
15.00%
Cities with the Highest Percentage of Slovak Population in Illinois
| City | Slovak | vs State | vs National | |
| 1. | Ransom | 11.60% | 0.25%(+11.4)#1 | 0.19%(+11.4)#45 |
| 2. | Kangley | 10.26% | 0.25%(+10.0)#2 | 0.19%(+10.1)#58 |
| 3. | Burtons Bridge | 6.16% | 0.25%(+5.92)#3 | 0.19%(+5.97)#183 |
| 4. | Streator | 5.36% | 0.25%(+5.11)#4 | 0.19%(+5.17)#224 |
| 5. | Naplate | 4.61% | 0.25%(+4.37)#5 | 0.19%(+4.42)#293 |
| 6. | Ritchie | 3.90% | 0.25%(+3.65)#6 | 0.19%(+3.70)#380 |
| 7. | Hutsonville | 3.55% | 0.25%(+3.31)#7 | 0.19%(+3.36)#422 |
| 8. | Greenwood | 3.52% | 0.25%(+3.27)#8 | 0.19%(+3.32)#430 |
| 9. | Mitchell | 3.29% | 0.25%(+3.05)#9 | 0.19%(+3.10)#471 |
| 10. | Rockdale | 3.27% | 0.25%(+3.03)#10 | 0.19%(+3.08)#474 |
| 11. | Wilton Center | 3.16% | 0.25%(+2.92)#11 | 0.19%(+2.97)#500 |
| 12. | Cherry | 3.04% | 0.25%(+2.80)#12 | 0.19%(+2.85)#520 |
| 13. | The Galena Territory | 2.80% | 0.25%(+2.56)#13 | 0.19%(+2.61)#567 |
| 14. | Thayer | 2.71% | 0.25%(+2.47)#14 | 0.19%(+2.52)#598 |
| 15. | Grand Ridge | 2.53% | 0.25%(+2.28)#15 | 0.19%(+2.34)#633 |
| 16. | Livingston | 2.47% | 0.25%(+2.22)#16 | 0.19%(+2.28)#644 |
| 17. | Lakewood Shores | 2.18% | 0.25%(+1.94)#17 | 0.19%(+1.99)#733 |
| 18. | Coal City | 2.17% | 0.25%(+1.92)#18 | 0.19%(+1.97)#736 |
| 19. | Girard | 2.14% | 0.25%(+1.90)#19 | 0.19%(+1.95)#748 |
| 20. | Wenona | 2.10% | 0.25%(+1.86)#20 | 0.19%(+1.91)#766 |
| 21. | Belgium | 2.10% | 0.25%(+1.85)#21 | 0.19%(+1.91)#769 |
| 22. | Colona | 2.07% | 0.25%(+1.83)#22 | 0.19%(+1.88)#777 |
| 23. | Lakemoor | 2.04% | 0.25%(+1.79)#23 | 0.19%(+1.85)#788 |
| 24. | Rochester | 2.00% | 0.25%(+1.75)#24 | 0.19%(+1.81)#806 |
| 25. | Shorewood | 1.93% | 0.25%(+1.69)#25 | 0.19%(+1.74)#828 |
| 26. | Palos Heights | 1.93% | 0.25%(+1.69)#26 | 0.19%(+1.74)#829 |
| 27. | Broughton | 1.92% | 0.25%(+1.68)#27 | 0.19%(+1.73)#834 |
| 28. | Flanagan | 1.92% | 0.25%(+1.67)#28 | 0.19%(+1.73)#836 |
| 29. | Riverside | 1.86% | 0.25%(+1.62)#29 | 0.19%(+1.67)#859 |
| 30. | Troy Grove | 1.86% | 0.25%(+1.61)#30 | 0.19%(+1.67)#862 |
| 31. | Carbon Hill | 1.83% | 0.25%(+1.59)#31 | 0.19%(+1.64)#875 |
| 32. | Millstadt | 1.78% | 0.25%(+1.54)#32 | 0.19%(+1.59)#898 |
| 33. | Lake Carroll | 1.72% | 0.25%(+1.47)#33 | 0.19%(+1.52)#932 |
| 34. | Kingston | 1.69% | 0.25%(+1.44)#34 | 0.19%(+1.50)#946 |
| 35. | Channahon | 1.65% | 0.25%(+1.41)#35 | 0.19%(+1.46)#963 |
| 36. | Oakbrook Terrace | 1.60% | 0.25%(+1.35)#36 | 0.19%(+1.40)#989 |
| 37. | Indian Head Park | 1.54% | 0.25%(+1.30)#37 | 0.19%(+1.35)#1,015 |
| 38. | Lostant | 1.50% | 0.25%(+1.25)#38 | 0.19%(+1.30)#1,054 |
| 39. | La Grange | 1.49% | 0.25%(+1.24)#39 | 0.19%(+1.30)#1,059 |
| 40. | Tiskilwa | 1.47% | 0.25%(+1.23)#40 | 0.19%(+1.28)#1,066 |
| 41. | Darien | 1.43% | 0.25%(+1.19)#41 | 0.19%(+1.24)#1,086 |
| 42. | Crestwood | 1.42% | 0.25%(+1.17)#42 | 0.19%(+1.22)#1,101 |
| 43. | East Gillespie | 1.38% | 0.25%(+1.14)#43 | 0.19%(+1.19)#1,113 |
| 44. | Lake Catherine | 1.37% | 0.25%(+1.13)#44 | 0.19%(+1.18)#1,118 |
| 45. | Mount Zion | 1.31% | 0.25%(+1.07)#45 | 0.19%(+1.12)#1,164 |
| 46. | Williamson | 1.30% | 0.25%(+1.05)#46 | 0.19%(+1.11)#1,175 |
| 47. | Mount Olive | 1.26% | 0.25%(+1.01)#47 | 0.19%(+1.07)#1,210 |
| 48. | Clarendon Hills | 1.26% | 0.25%(+1.01)#48 | 0.19%(+1.07)#1,211 |
| 49. | Hopewell | 1.26% | 0.25%(+1.01)#49 | 0.19%(+1.07)#1,213 |
| 50. | Sugar Grove | 1.22% | 0.25%(+0.976)#50 | 0.19%(+1.03)#1,238 |
| 51. | Oak Lawn | 1.20% | 0.25%(+0.958)#51 | 0.19%(+1.01)#1,256 |
| 52. | Glen Carbon | 1.20% | 0.25%(+0.956)#52 | 0.19%(+1.01)#1,257 |
| 53. | Lisle | 1.19% | 0.25%(+0.946)#53 | 0.19%(+1.00)#1,267 |
| 54. | Crystal Lawns | 1.19% | 0.25%(+0.945)#54 | 0.19%(+0.999)#1,269 |
| 55. | Coalton | 1.17% | 0.25%(+0.921)#55 | 0.19%(+0.975)#1,295 |
| 56. | Danvers | 1.15% | 0.25%(+0.910)#56 | 0.19%(+0.964)#1,299 |
| 57. | Steward | 1.15% | 0.25%(+0.900)#57 | 0.19%(+0.954)#1,305 |
| 58. | Countryside | 1.14% | 0.25%(+0.894)#58 | 0.19%(+0.948)#1,312 |
| 59. | Mark | 1.13% | 0.25%(+0.885)#59 | 0.19%(+0.939)#1,323 |
| 60. | De Soto | 1.13% | 0.25%(+0.883)#60 | 0.19%(+0.937)#1,326 |
| 61. | Beecher | 1.12% | 0.25%(+0.873)#61 | 0.19%(+0.927)#1,335 |
| 62. | Benld | 1.11% | 0.25%(+0.865)#62 | 0.19%(+0.919)#1,345 |
| 63. | Pana | 1.10% | 0.25%(+0.858)#63 | 0.19%(+0.912)#1,354 |
| 64. | Godley | 1.09% | 0.25%(+0.844)#64 | 0.19%(+0.898)#1,372 |
| 65. | Worth | 1.04% | 0.25%(+0.795)#65 | 0.19%(+0.849)#1,418 |
| 66. | Kingston Mines | 1.03% | 0.25%(+0.786)#66 | 0.19%(+0.840)#1,429 |
| 67. | Marengo | 1.02% | 0.25%(+0.772)#67 | 0.19%(+0.826)#1,446 |
| 68. | Burr Ridge | 0.97% | 0.25%(+0.725)#68 | 0.19%(+0.779)#1,504 |
| 69. | Viola | 0.97% | 0.25%(+0.723)#69 | 0.19%(+0.777)#1,509 |
| 70. | Tovey | 0.95% | 0.25%(+0.707)#70 | 0.19%(+0.761)#1,534 |
| 71. | Highwood | 0.94% | 0.25%(+0.692)#71 | 0.19%(+0.746)#1,563 |
| 72. | Frankfort | 0.93% | 0.25%(+0.688)#72 | 0.19%(+0.742)#1,579 |
| 73. | Justice | 0.91% | 0.25%(+0.665)#73 | 0.19%(+0.719)#1,613 |
| 74. | Bridgeview | 0.90% | 0.25%(+0.658)#74 | 0.19%(+0.712)#1,620 |
| 75. | Minooka | 0.90% | 0.25%(+0.651)#75 | 0.19%(+0.705)#1,635 |
| 76. | North Aurora | 0.89% | 0.25%(+0.645)#76 | 0.19%(+0.699)#1,644 |
| 77. | Cherry Valley | 0.88% | 0.25%(+0.636)#77 | 0.19%(+0.690)#1,656 |
| 78. | Augusta | 0.87% | 0.25%(+0.624)#78 | 0.19%(+0.678)#1,676 |
| 79. | Walnut Hill | 0.85% | 0.25%(+0.602)#79 | 0.19%(+0.656)#1,704 |
| 80. | Scott Afb | 0.85% | 0.25%(+0.600)#80 | 0.19%(+0.654)#1,708 |
| 81. | Deer Park | 0.84% | 0.25%(+0.594)#81 | 0.19%(+0.648)#1,720 |
| 82. | East Dundee | 0.82% | 0.25%(+0.578)#82 | 0.19%(+0.632)#1,744 |
| 83. | Willow Springs | 0.82% | 0.25%(+0.574)#83 | 0.19%(+0.627)#1,749 |
| 84. | Herrick | 0.80% | 0.25%(+0.559)#84 | 0.19%(+0.613)#1,784 |
| 85. | Ottawa | 0.80% | 0.25%(+0.551)#85 | 0.19%(+0.605)#1,791 |
| 86. | Pittsfield | 0.79% | 0.25%(+0.550)#86 | 0.19%(+0.603)#1,797 |
| 87. | Homewood | 0.79% | 0.25%(+0.545)#87 | 0.19%(+0.599)#1,807 |
| 88. | Middletown | 0.79% | 0.25%(+0.542)#88 | 0.19%(+0.596)#1,814 |
| 89. | Matherville | 0.76% | 0.25%(+0.511)#89 | 0.19%(+0.564)#1,860 |
| 90. | Gardner | 0.74% | 0.25%(+0.500)#90 | 0.19%(+0.553)#1,883 |
| 91. | Lockport | 0.73% | 0.25%(+0.486)#91 | 0.19%(+0.540)#1,907 |
| 92. | Wheaton | 0.72% | 0.25%(+0.480)#92 | 0.19%(+0.533)#1,921 |
| 93. | Round Lake | 0.70% | 0.25%(+0.456)#93 | 0.19%(+0.510)#1,976 |
| 94. | Hodgkins | 0.70% | 0.25%(+0.455)#94 | 0.19%(+0.509)#1,981 |
| 95. | Cortland | 0.70% | 0.25%(+0.452)#95 | 0.19%(+0.506)#1,991 |
| 96. | St Jacob | 0.69% | 0.25%(+0.444)#96 | 0.19%(+0.497)#2,005 |
| 97. | Naperville | 0.68% | 0.25%(+0.434)#97 | 0.19%(+0.488)#2,027 |
| 98. | Staunton | 0.68% | 0.25%(+0.432)#98 | 0.19%(+0.486)#2,035 |
| 99. | Cooksville | 0.68% | 0.25%(+0.431)#99 | 0.19%(+0.484)#2,039 |
| 100. | Trout Valley | 0.67% | 0.25%(+0.429)#100 | 0.19%(+0.483)#2,042 |
Common Questions
What are the Top 10 Cities with the Highest Percentage of Slovak Population in Illinois?
Top 10 Cities with the Highest Percentage of Slovak Population in Illinois are:
#1
11.60%
#2
10.26%
#3
5.36%
#4
4.61%
#5
3.55%
#6
3.52%
#7
3.29%
#8
3.27%
#9
3.04%
#10
2.80%
What city has the Highest Percentage of Slovak Population in Illinois?
Ransom has the Highest Percentage of Slovak Population in Illinois with 11.60%.
What is the Percentage of Slovak Population in the State of Illinois?
Percentage of Slovak Population in Illinois is 0.25%.
What is the Percentage of Slovak Population in the United States?
Percentage of Slovak Population in the United States is 0.19%.