Cities with the Highest Percentage of Immigrants from Morocco in Illinois
RELATED REPORTS & OPTIONS
Morocco
Illinois
Compare Cities
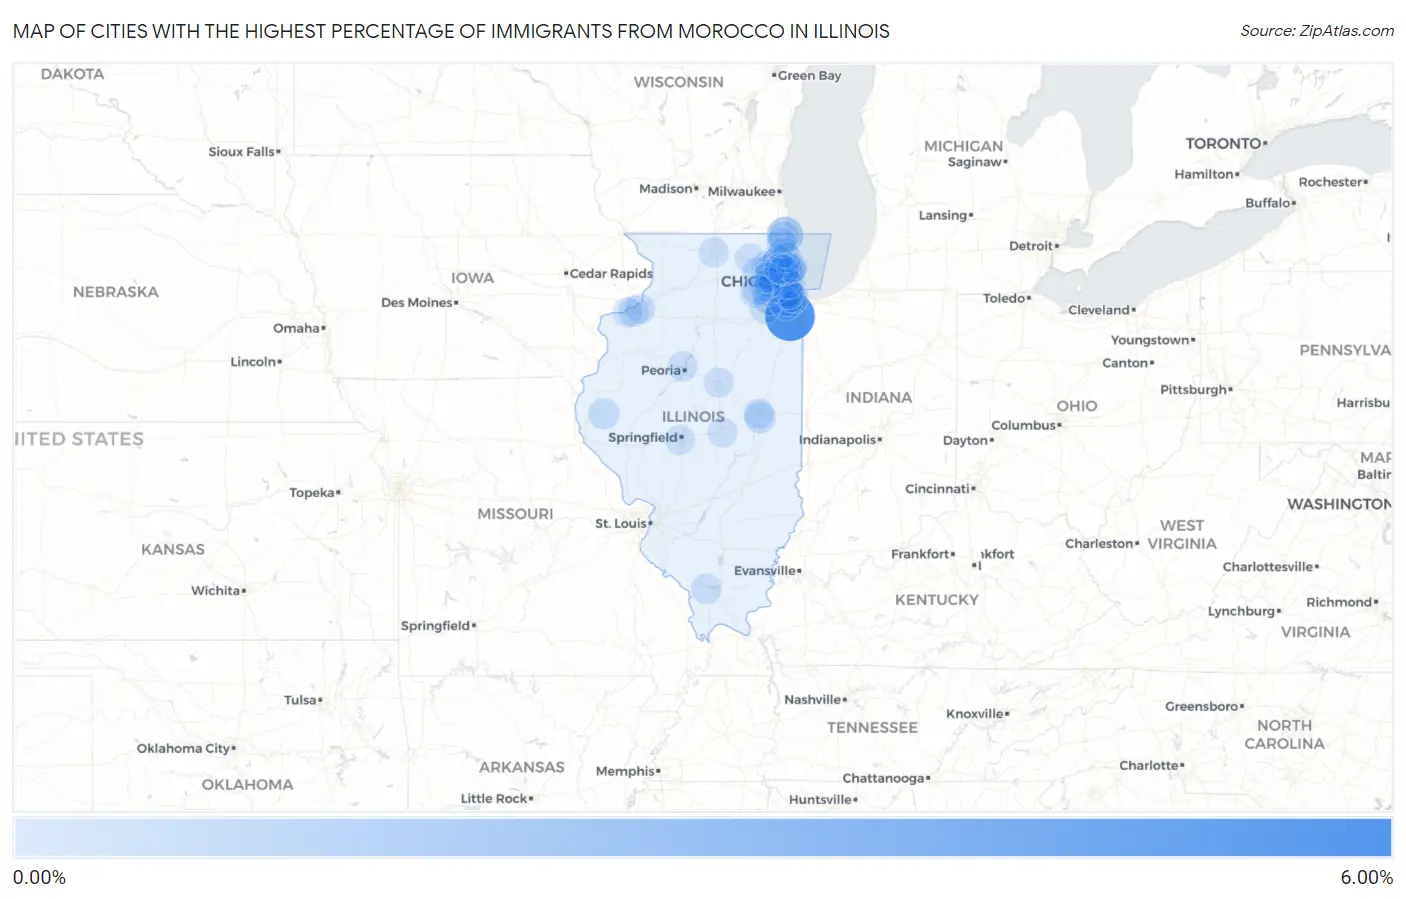
Map of Cities with the Highest Percentage of Immigrants from Morocco in Illinois
0.00%
6.00%
Cities with the Highest Percentage of Immigrants from Morocco in Illinois
| City | Morocco | vs State | vs National | |
| 1. | Monee | 5.02% | 0.030%(+4.99)#-1 | 0.027%(+4.99)#0 |
| 2. | Winthrop Harbor | 1.54% | 0.030%(+1.51)#0 | 0.027%(+1.51)#1 |
| 3. | Midlothian | 0.77% | 0.030%(+0.738)#1 | 0.027%(+0.741)#2 |
| 4. | Harwood Heights | 0.74% | 0.030%(+0.708)#2 | 0.027%(+0.711)#3 |
| 5. | Romeoville | 0.71% | 0.030%(+0.678)#3 | 0.027%(+0.681)#4 |
| 6. | Rosemont | 0.57% | 0.030%(+0.540)#4 | 0.027%(+0.543)#5 |
| 7. | Lincolnwood | 0.51% | 0.030%(+0.483)#5 | 0.027%(+0.486)#6 |
| 8. | Schiller Park | 0.50% | 0.030%(+0.470)#6 | 0.027%(+0.473)#7 |
| 9. | Alsip | 0.48% | 0.030%(+0.447)#7 | 0.027%(+0.450)#8 |
| 10. | Niles | 0.44% | 0.030%(+0.411)#8 | 0.027%(+0.414)#9 |
| 11. | Chicago Ridge | 0.35% | 0.030%(+0.320)#9 | 0.027%(+0.323)#10 |
| 12. | Savoy | 0.33% | 0.030%(+0.304)#10 | 0.027%(+0.307)#11 |
| 13. | Golden | 0.26% | 0.030%(+0.230)#11 | 0.027%(+0.233)#12 |
| 14. | Villa Park | 0.20% | 0.030%(+0.173)#12 | 0.027%(+0.176)#13 |
| 15. | Westmont | 0.16% | 0.030%(+0.127)#13 | 0.027%(+0.130)#14 |
| 16. | River Forest | 0.16% | 0.030%(+0.126)#14 | 0.027%(+0.129)#15 |
| 17. | Burbank | 0.15% | 0.030%(+0.118)#15 | 0.027%(+0.121)#16 |
| 18. | Wheeling | 0.13% | 0.030%(+0.104)#16 | 0.027%(+0.107)#17 |
| 19. | Warrenville | 0.13% | 0.030%(+0.099)#17 | 0.027%(+0.102)#18 |
| 20. | Montgomery | 0.12% | 0.030%(+0.087)#18 | 0.027%(+0.090)#19 |
| 21. | Hinsdale | 0.11% | 0.030%(+0.081)#19 | 0.027%(+0.084)#20 |
| 22. | Moline | 0.097% | 0.030%(+0.067)#20 | 0.027%(+0.070)#21 |
| 23. | Morton Grove | 0.092% | 0.030%(+0.063)#21 | 0.027%(+0.066)#22 |
| 24. | South Elgin | 0.080% | 0.030%(+0.050)#22 | 0.027%(+0.053)#23 |
| 25. | La Grange Park | 0.075% | 0.030%(+0.045)#23 | 0.027%(+0.048)#24 |
| 26. | Hoffman Estates | 0.072% | 0.030%(+0.042)#24 | 0.027%(+0.045)#25 |
| 27. | Orland Park | 0.070% | 0.030%(+0.041)#25 | 0.027%(+0.044)#26 |
| 28. | Tinley Park | 0.070% | 0.030%(+0.041)#26 | 0.027%(+0.044)#27 |
| 29. | Carbondale | 0.068% | 0.030%(+0.038)#27 | 0.027%(+0.041)#28 |
| 30. | Skokie | 0.067% | 0.030%(+0.037)#28 | 0.027%(+0.040)#237 |
| 31. | Arlington Heights | 0.064% | 0.030%(+0.034)#29 | 0.027%(+0.037)#238 |
| 32. | Champaign | 0.058% | 0.030%(+0.028)#30 | 0.027%(+0.031)#239 |
| 33. | Glendale Heights | 0.054% | 0.030%(+0.025)#31 | 0.027%(+0.028)#240 |
| 34. | Chicago | 0.051% | 0.030%(+0.021)#32 | 0.027%(+0.024)#322 |
| 35. | Lisle | 0.047% | 0.030%(+0.017)#33 | 0.027%(+0.020)#323 |
| 36. | Lombard | 0.045% | 0.030%(+0.016)#34 | 0.027%(+0.019)#324 |
| 37. | East Moline | 0.043% | 0.030%(+0.013)#35 | 0.027%(+0.016)#325 |
| 38. | Huntley | 0.040% | 0.030%(+0.010)#36 | 0.027%(+0.013)#326 |
| 39. | Buffalo Grove | 0.037% | 0.030%(+0.008)#37 | 0.027%(+0.011)#327 |
| 40. | Berwyn | 0.037% | 0.030%(+0.007)#38 | 0.027%(+0.011)#328 |
| 41. | Zion | 0.037% | 0.030%(+0.007)#39 | 0.027%(+0.010)#329 |
| 42. | Normal | 0.036% | 0.030%(+0.006)#40 | 0.027%(+0.009)#330 |
| 43. | Bloomingdale | 0.036% | 0.030%(+0.006)#41 | 0.027%(+0.009)#331 |
| 44. | Rock Island | 0.032% | 0.030%(+0.003)#42 | 0.027%(+0.006)#332 |
| 45. | Blue Island | 0.031% | 0.030%(+0.001)#43 | 0.027%(+0.004)#333 |
| 46. | Naperville | 0.030% | 0.030%(+0.001)#44 | 0.027%(+0.004)#334 |
| 47. | Highland Park | 0.026% | 0.030%(-0.003)#45 | 0.027%(-0.000)#335 |
| 48. | Schaumburg | 0.026% | 0.030%(-0.004)#46 | 0.027%(-0.001)#336 |
| 49. | Lake Forest | 0.026% | 0.030%(-0.004)#47 | 0.027%(-0.001)#337 |
| 50. | Peoria | 0.024% | 0.030%(-0.006)#48 | 0.027%(-0.003)#373 |
| 51. | Wheaton | 0.020% | 0.030%(-0.009)#49 | 0.027%(-0.006)#374 |
| 52. | Oak Lawn | 0.019% | 0.030%(-0.011)#50 | 0.027%(-0.008)#375 |
| 53. | Carol Stream | 0.018% | 0.030%(-0.012)#51 | 0.027%(-0.009)#376 |
| 54. | Des Plaines | 0.017% | 0.030%(-0.013)#52 | 0.027%(-0.010)#377 |
| 55. | Rockford | 0.016% | 0.030%(-0.014)#53 | 0.027%(-0.011)#378 |
| 56. | Joliet | 0.013% | 0.030%(-0.016)#54 | 0.027%(-0.013)#379 |
| 57. | Evanston | 0.013% | 0.030%(-0.017)#55 | 0.027%(-0.014)#380 |
| 58. | Decatur | 0.011% | 0.030%(-0.018)#56 | 0.027%(-0.015)#381 |
| 59. | Waukegan | 0.011% | 0.030%(-0.018)#57 | 0.027%(-0.015)#382 |
| 60. | Springfield | 0.0096% | 0.030%(-0.020)#58 | 0.027%(-0.017)#383 |
| 61. | Park Ridge | 0.0051% | 0.030%(-0.025)#59 | 0.027%(-0.022)#384 |
| 62. | Aurora | 0.0050% | 0.030%(-0.025)#60 | 0.027%(-0.022)#385 |
Common Questions
What are the Top 10 Cities with the Highest Percentage of Immigrants from Morocco in Illinois?
Top 10 Cities with the Highest Percentage of Immigrants from Morocco in Illinois are:
#1
5.02%
#2
1.54%
#3
0.77%
#4
0.74%
#5
0.71%
#6
0.57%
#7
0.51%
#8
0.50%
#9
0.48%
#10
0.44%
What city has the Highest Percentage of Immigrants from Morocco in Illinois?
Monee has the Highest Percentage of Immigrants from Morocco in Illinois with 5.02%.
What is the Percentage of Immigrants from Morocco in the State of Illinois?
Percentage of Immigrants from Morocco in Illinois is 0.030%.
What is the Percentage of Immigrants from Morocco in the United States?
Percentage of Immigrants from Morocco in the United States is 0.027%.