Cities with the Largest Blackfeet Community in Pennsylvania
RELATED REPORTS & OPTIONS
Blackfeet
Pennsylvania
Compare Cities
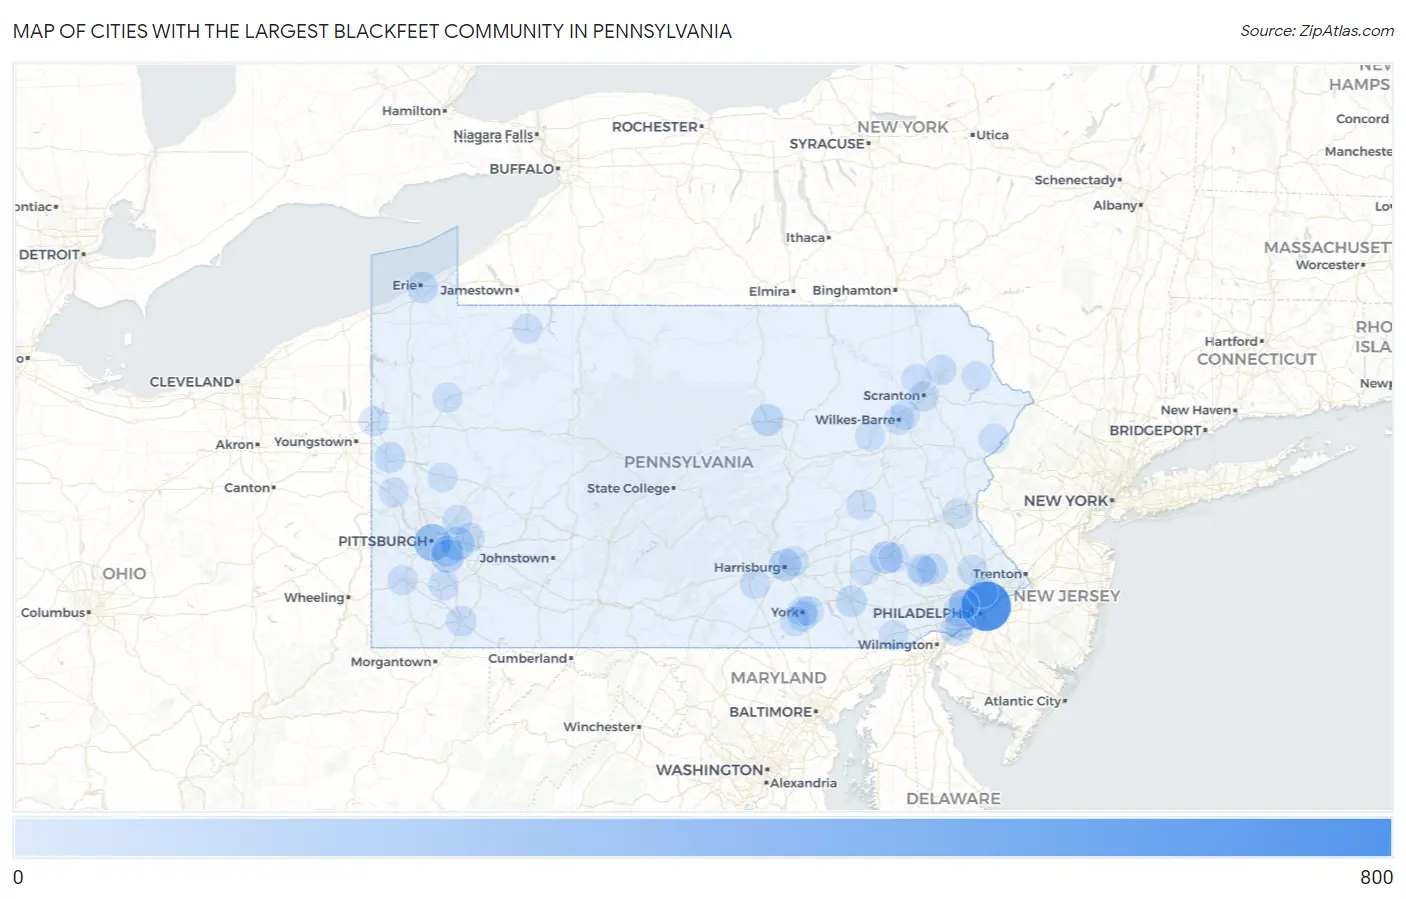
Map of Cities with the Largest Blackfeet Community in Pennsylvania
0
800
Cities with the Largest Blackfeet Community in Pennsylvania
| City | Blackfeet | vs State | vs National | |
| 1. | Philadelphia | 705 | 5,361(13.15%)#1 | 203,870(0.35%)#18 |
| 2. | Pittsburgh | 246 | 5,361(4.59%)#2 | 203,870(0.12%)#106 |
| 3. | Monroeville | 139 | 5,361(2.59%)#3 | 203,870(0.07%)#217 |
| 4. | Mckeesport | 119 | 5,361(2.22%)#4 | 203,870(0.06%)#272 |
| 5. | East Petersburg Borough | 98 | 5,361(1.83%)#5 | 203,870(0.05%)#346 |
| 6. | West Lawn | 97 | 5,361(1.81%)#6 | 203,870(0.05%)#352 |
| 7. | Oxford Borough | 91 | 5,361(1.70%)#7 | 203,870(0.04%)#377 |
| 8. | Harrisburg | 77 | 5,361(1.44%)#8 | 203,870(0.04%)#453 |
| 9. | Williamsport | 75 | 5,361(1.40%)#9 | 203,870(0.04%)#469 |
| 10. | Chester | 65 | 5,361(1.21%)#10 | 203,870(0.03%)#540 |
| 11. | Red Lion Borough | 65 | 5,361(1.21%)#11 | 203,870(0.03%)#547 |
| 12. | Wilkinsburg Borough | 62 | 5,361(1.16%)#12 | 203,870(0.03%)#563 |
| 13. | West Mifflin Borough | 61 | 5,361(1.14%)#13 | 203,870(0.03%)#571 |
| 14. | Duquesne | 52 | 5,361(0.97%)#14 | 203,870(0.03%)#689 |
| 15. | Lancaster | 51 | 5,361(0.95%)#15 | 203,870(0.03%)#695 |
| 16. | Erie | 47 | 5,361(0.88%)#16 | 203,870(0.02%)#760 |
| 17. | Mechanicsburg Borough | 38 | 5,361(0.71%)#17 | 203,870(0.02%)#937 |
| 18. | Milton Borough | 38 | 5,361(0.71%)#18 | 203,870(0.02%)#940 |
| 19. | New Castle | 36 | 5,361(0.67%)#19 | 203,870(0.02%)#981 |
| 20. | Broomall | 36 | 5,361(0.67%)#20 | 203,870(0.02%)#985 |
| 21. | Chambersburg Borough | 34 | 5,361(0.63%)#21 | 203,870(0.02%)#1,024 |
| 22. | Pine Grove Borough | 31 | 5,361(0.58%)#22 | 203,870(0.02%)#1,111 |
| 23. | Grantley | 27 | 5,361(0.50%)#23 | 203,870(0.01%)#1,208 |
| 24. | Sanatoga | 26 | 5,361(0.48%)#24 | 203,870(0.01%)#1,240 |
| 25. | New Holland Borough | 26 | 5,361(0.48%)#25 | 203,870(0.01%)#1,244 |
| 26. | Dupont Borough | 26 | 5,361(0.48%)#26 | 203,870(0.01%)#1,250 |
| 27. | Haverford College | 24 | 5,361(0.45%)#27 | 203,870(0.01%)#1,324 |
| 28. | Burgettstown Borough | 24 | 5,361(0.45%)#28 | 203,870(0.01%)#1,326 |
| 29. | Norristown Borough | 23 | 5,361(0.43%)#29 | 203,870(0.01%)#1,343 |
| 30. | Millersville Borough | 22 | 5,361(0.41%)#30 | 203,870(0.01%)#1,396 |
| 31. | Ambridge Borough | 22 | 5,361(0.41%)#31 | 203,870(0.01%)#1,398 |
| 32. | Hollidaysburg Borough | 22 | 5,361(0.41%)#32 | 203,870(0.01%)#1,400 |
| 33. | Uniontown | 21 | 5,361(0.39%)#33 | 203,870(0.01%)#1,439 |
| 34. | Carroll Valley Borough | 20 | 5,361(0.37%)#34 | 203,870(0.01%)#1,486 |
| 35. | Waynesboro Borough | 19 | 5,361(0.35%)#35 | 203,870(0.01%)#1,524 |
| 36. | Reading | 17 | 5,361(0.32%)#36 | 203,870(0.01%)#1,614 |
| 37. | York | 17 | 5,361(0.32%)#37 | 203,870(0.01%)#1,624 |
| 38. | Washington | 17 | 5,361(0.32%)#38 | 203,870(0.01%)#1,643 |
| 39. | Berwick Borough | 17 | 5,361(0.32%)#39 | 203,870(0.01%)#1,648 |
| 40. | Sellersville Borough | 17 | 5,361(0.32%)#40 | 203,870(0.01%)#1,662 |
| 41. | Saw Creek | 17 | 5,361(0.32%)#41 | 203,870(0.01%)#1,663 |
| 42. | Athens Borough | 17 | 5,361(0.32%)#42 | 203,870(0.01%)#1,666 |
| 43. | Scranton | 16 | 5,361(0.30%)#43 | 203,870(0.01%)#1,682 |
| 44. | Quakertown Borough | 16 | 5,361(0.30%)#44 | 203,870(0.01%)#1,713 |
| 45. | Boiling Springs | 16 | 5,361(0.30%)#45 | 203,870(0.01%)#1,729 |
| 46. | Carbondale | 15 | 5,361(0.28%)#46 | 203,870(0.01%)#1,773 |
| 47. | Carnegie Borough | 15 | 5,361(0.28%)#47 | 203,870(0.01%)#1,777 |
| 48. | Fleetwood Borough | 15 | 5,361(0.28%)#48 | 203,870(0.01%)#1,792 |
| 49. | East Pittsburgh Borough | 15 | 5,361(0.28%)#49 | 203,870(0.01%)#1,802 |
| 50. | Fredericksburg Cdp Lebanon County | 15 | 5,361(0.28%)#50 | 203,870(0.01%)#1,805 |
| 51. | Montgomeryville | 14 | 5,361(0.26%)#51 | 203,870(0.01%)#1,864 |
| 52. | Macungie Borough | 14 | 5,361(0.26%)#52 | 203,870(0.01%)#1,883 |
| 53. | South Pottstown | 14 | 5,361(0.26%)#53 | 203,870(0.01%)#1,887 |
| 54. | Oakland Borough | 14 | 5,361(0.26%)#54 | 203,870(0.01%)#1,898 |
| 55. | Shrewsbury Borough | 13 | 5,361(0.24%)#55 | 203,870(0.01%)#1,946 |
| 56. | Leesport Borough | 13 | 5,361(0.24%)#56 | 203,870(0.01%)#1,959 |
| 57. | Woodlyn | 12 | 5,361(0.22%)#57 | 203,870(0.01%)#2,017 |
| 58. | Canonsburg Borough | 12 | 5,361(0.22%)#58 | 203,870(0.01%)#2,018 |
| 59. | Monessen | 12 | 5,361(0.22%)#59 | 203,870(0.01%)#2,028 |
| 60. | Colonial Park | 11 | 5,361(0.21%)#60 | 203,870(0.01%)#2,105 |
| 61. | Braddock Borough | 11 | 5,361(0.21%)#61 | 203,870(0.01%)#2,164 |
| 62. | Munhall Borough | 10 | 5,361(0.19%)#62 | 203,870(0.00%)#2,236 |
| 63. | Columbia Borough | 10 | 5,361(0.19%)#63 | 203,870(0.00%)#2,239 |
| 64. | Warren | 10 | 5,361(0.19%)#64 | 203,870(0.00%)#2,246 |
| 65. | Wyncote | 10 | 5,361(0.19%)#65 | 203,870(0.00%)#2,260 |
| 66. | Georgetown Cdp Luzerne County | 10 | 5,361(0.19%)#66 | 203,870(0.00%)#2,273 |
| 67. | Dale Borough | 10 | 5,361(0.19%)#67 | 203,870(0.00%)#2,282 |
| 68. | Butler | 9 | 5,361(0.17%)#68 | 203,870(0.00%)#2,362 |
| 69. | Pottsville | 9 | 5,361(0.17%)#69 | 203,870(0.00%)#2,363 |
| 70. | Franklin | 9 | 5,361(0.17%)#70 | 203,870(0.00%)#2,378 |
| 71. | Stowe | 9 | 5,361(0.17%)#71 | 203,870(0.00%)#2,392 |
| 72. | Myerstown Borough | 9 | 5,361(0.17%)#72 | 203,870(0.00%)#2,395 |
| 73. | New Salem | 9 | 5,361(0.17%)#73 | 203,870(0.00%)#2,434 |
| 74. | Wilkes Barre | 8 | 5,361(0.15%)#74 | 203,870(0.00%)#2,457 |
| 75. | Mount Joy Borough | 8 | 5,361(0.15%)#75 | 203,870(0.00%)#2,511 |
| 76. | Beaver Borough | 8 | 5,361(0.15%)#76 | 203,870(0.00%)#2,529 |
| 77. | Hudson | 8 | 5,361(0.15%)#77 | 203,870(0.00%)#2,565 |
| 78. | Schoeneck | 8 | 5,361(0.15%)#78 | 203,870(0.00%)#2,573 |
| 79. | Mocanaqua | 8 | 5,361(0.15%)#79 | 203,870(0.00%)#2,580 |
| 80. | East Rochester Borough | 8 | 5,361(0.15%)#80 | 203,870(0.00%)#2,582 |
| 81. | Carlisle Borough | 7 | 5,361(0.13%)#81 | 203,870(0.00%)#2,627 |
| 82. | Sharon | 7 | 5,361(0.13%)#82 | 203,870(0.00%)#2,646 |
| 83. | Middletown Borough | 7 | 5,361(0.13%)#83 | 203,870(0.00%)#2,656 |
| 84. | Swissvale Borough | 7 | 5,361(0.13%)#84 | 203,870(0.00%)#2,659 |
| 85. | Vandergrift Borough | 7 | 5,361(0.13%)#85 | 203,870(0.00%)#2,671 |
| 86. | Frackville Borough | 7 | 5,361(0.13%)#86 | 203,870(0.00%)#2,680 |
| 87. | Wyoming Borough | 7 | 5,361(0.13%)#87 | 203,870(0.00%)#2,687 |
| 88. | Lincoln University | 7 | 5,361(0.13%)#88 | 203,870(0.00%)#2,695 |
| 89. | Glenburn | 7 | 5,361(0.13%)#89 | 203,870(0.00%)#2,707 |
| 90. | White Mills | 7 | 5,361(0.13%)#90 | 203,870(0.00%)#2,715 |
| 91. | Murrysville | 6 | 5,361(0.11%)#91 | 203,870(0.00%)#2,763 |
| 92. | East York | 6 | 5,361(0.11%)#92 | 203,870(0.00%)#2,785 |
| 93. | Arnold | 6 | 5,361(0.11%)#93 | 203,870(0.00%)#2,811 |
| 94. | Meyersdale Borough | 6 | 5,361(0.11%)#94 | 203,870(0.00%)#2,831 |
| 95. | Big Beaver Borough | 6 | 5,361(0.11%)#95 | 203,870(0.00%)#2,839 |
| 96. | Bethlehem | 5 | 5,361(0.09%)#96 | 203,870(0.00%)#2,892 |
| 97. | Beaver Falls | 5 | 5,361(0.09%)#97 | 203,870(0.00%)#2,952 |
| 98. | Bryn Mawr | 5 | 5,361(0.09%)#98 | 203,870(0.00%)#2,966 |
| 99. | Collegeville Borough | 5 | 5,361(0.09%)#99 | 203,870(0.00%)#2,969 |
| 100. | Sugarcreek Borough | 5 | 5,361(0.09%)#100 | 203,870(0.00%)#2,972 |
Common Questions
What are the Top 10 Cities with the Largest Blackfeet Community in Pennsylvania?
Top 10 Cities with the Largest Blackfeet Community in Pennsylvania are:
#1
705
#2
246
#3
139
#4
119
#5
97
#6
77
#7
75
#8
65
#9
52
#10
51
What city has the Largest Blackfeet Community in Pennsylvania?
Philadelphia has the Largest Blackfeet Community in Pennsylvania with 705.
What is the Total Blackfeet Population in the State of Pennsylvania?
Total Blackfeet Population in Pennsylvania is 5,361.
What is the Total Blackfeet Population in the United States?
Total Blackfeet Population in the United States is 203,870.