Cities with the Largest Blackfeet Community in Connecticut
RELATED REPORTS & OPTIONS
Blackfeet
Connecticut
Compare Cities
Map of Cities with the Largest Blackfeet Community in Connecticut
0
250
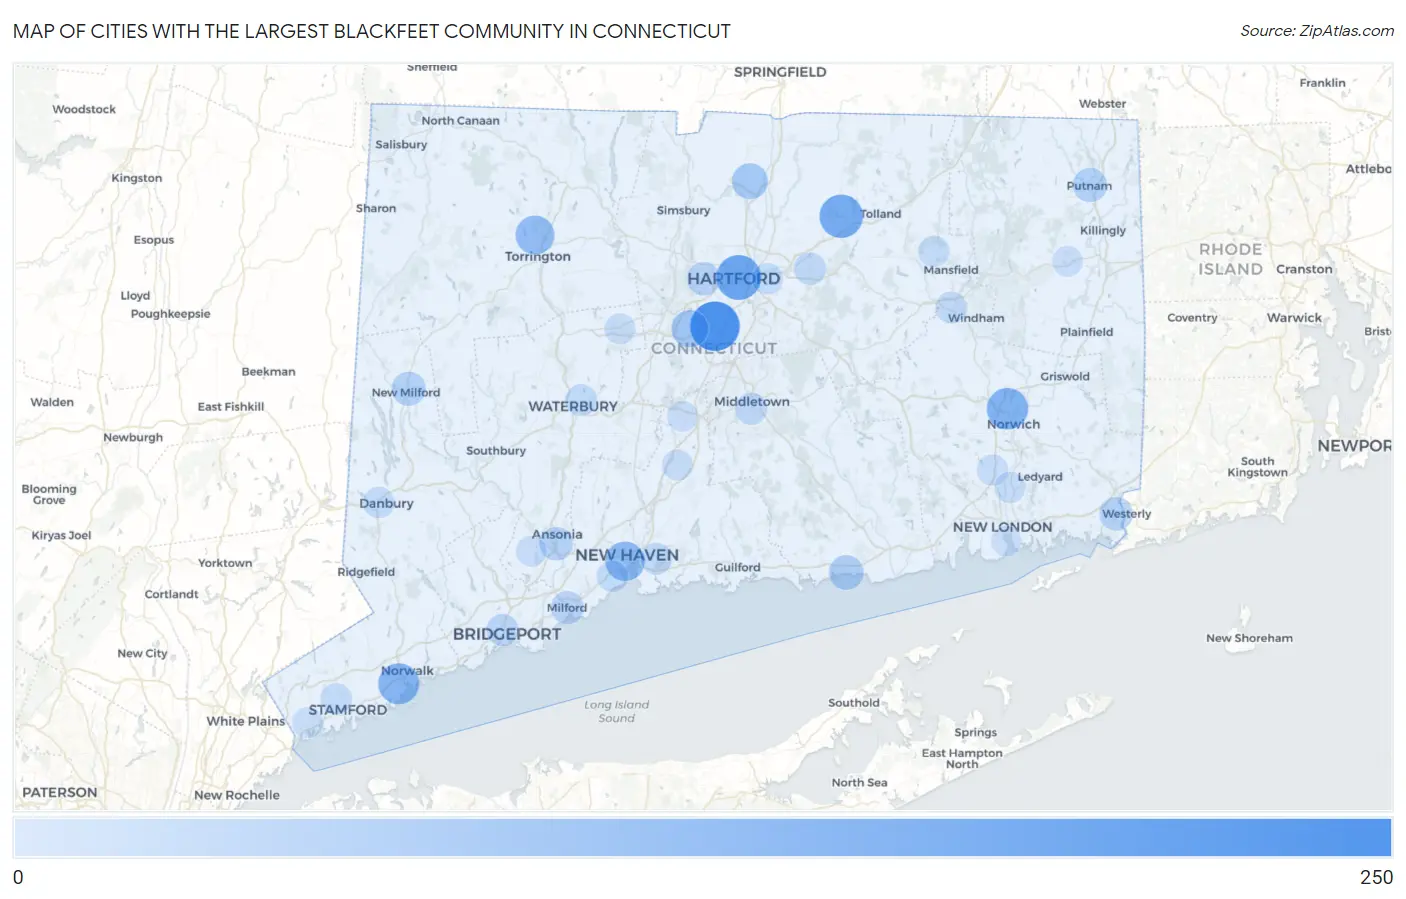
Cities with the Largest Blackfeet Community in Connecticut
| City | Blackfeet | vs State | vs National | |
| 1. | Newington | 221 | 2,277(9.71%)#1 | 203,870(0.11%)#120 |
| 2. | Hartford | 166 | 2,277(7.29%)#2 | 203,870(0.08%)#178 |
| 3. | Rockville | 150 | 2,277(6.59%)#3 | 203,870(0.07%)#204 |
| 4. | Norwich | 127 | 2,277(5.58%)#4 | 203,870(0.06%)#248 |
| 5. | Norwalk | 121 | 2,277(5.31%)#5 | 203,870(0.06%)#267 |
| 6. | New Haven | 104 | 2,277(4.57%)#6 | 203,870(0.05%)#319 |
| 7. | Torrington | 97 | 2,277(4.26%)#7 | 203,870(0.05%)#350 |
| 8. | New Britain | 77 | 2,277(3.38%)#8 | 203,870(0.04%)#451 |
| 9. | Windsor Locks | 63 | 2,277(2.77%)#9 | 203,870(0.03%)#556 |
| 10. | Westbrook Center | 50 | 2,277(2.20%)#10 | 203,870(0.02%)#726 |
| 11. | Putnam | 44 | 2,277(1.93%)#11 | 203,870(0.02%)#814 |
| 12. | New Milford | 43 | 2,277(1.89%)#12 | 203,870(0.02%)#831 |
| 13. | Derby | 38 | 2,277(1.67%)#13 | 203,870(0.02%)#935 |
| 14. | Pawcatuck | 38 | 2,277(1.67%)#14 | 203,870(0.02%)#941 |
| 15. | West Hartford | 36 | 2,277(1.58%)#15 | 203,870(0.02%)#975 |
| 16. | Milford City Balance | 31 | 2,277(1.36%)#16 | 203,870(0.02%)#1,092 |
| 17. | Woodmont Borough | 27 | 2,277(1.19%)#17 | 203,870(0.01%)#1,216 |
| 18. | Bridgeport | 23 | 2,277(1.01%)#18 | 203,870(0.01%)#1,329 |
| 19. | Manchester | 22 | 2,277(0.97%)#19 | 203,870(0.01%)#1,378 |
| 20. | Middletown | 20 | 2,277(0.88%)#20 | 203,870(0.01%)#1,462 |
| 21. | East Haven | 19 | 2,277(0.83%)#21 | 203,870(0.01%)#1,513 |
| 22. | Gaylordsville | 19 | 2,277(0.83%)#22 | 203,870(0.01%)#1,551 |
| 23. | Waterbury | 18 | 2,277(0.79%)#23 | 203,870(0.01%)#1,558 |
| 24. | Willimantic | 17 | 2,277(0.75%)#24 | 203,870(0.01%)#1,640 |
| 25. | Danbury | 15 | 2,277(0.66%)#25 | 203,870(0.01%)#1,753 |
| 26. | West Haven | 15 | 2,277(0.66%)#26 | 203,870(0.01%)#1,755 |
| 27. | Westport | 15 | 2,277(0.66%)#27 | 203,870(0.01%)#1,798 |
| 28. | Stamford | 14 | 2,277(0.61%)#28 | 203,870(0.01%)#1,821 |
| 29. | East Hartford | 13 | 2,277(0.57%)#29 | 203,870(0.01%)#1,908 |
| 30. | Storrs | 13 | 2,277(0.57%)#30 | 203,870(0.01%)#1,929 |
| 31. | Danielson Borough | 12 | 2,277(0.53%)#31 | 203,870(0.01%)#2,035 |
| 32. | Oxoboxo River | 11 | 2,277(0.48%)#32 | 203,870(0.01%)#2,156 |
| 33. | Gales Ferry | 10 | 2,277(0.44%)#33 | 203,870(0.00%)#2,281 |
| 34. | Bristol | 9 | 2,277(0.40%)#34 | 203,870(0.00%)#2,313 |
| 35. | Wallingford Center | 9 | 2,277(0.40%)#35 | 203,870(0.00%)#2,348 |
| 36. | Meriden | 6 | 2,277(0.26%)#36 | 203,870(0.00%)#2,742 |
| 37. | Quinnipiac University | 6 | 2,277(0.26%)#37 | 203,870(0.00%)#2,808 |
| 38. | Brooklyn | 6 | 2,277(0.26%)#38 | 203,870(0.00%)#2,861 |
| 39. | Shelton | 5 | 2,277(0.22%)#39 | 203,870(0.00%)#2,899 |
| 40. | Greenwich | 4 | 2,277(0.18%)#40 | 203,870(0.00%)#3,083 |
| 41. | New London | 3 | 2,277(0.13%)#41 | 203,870(0.00%)#3,273 |
1
Common Questions
What are the Top 10 Cities with the Largest Blackfeet Community in Connecticut?
Top 10 Cities with the Largest Blackfeet Community in Connecticut are:
#1
221
#2
166
#3
150
#4
127
#5
121
#6
104
#7
97
#8
77
#9
63
#10
50
What city has the Largest Blackfeet Community in Connecticut?
Newington has the Largest Blackfeet Community in Connecticut with 221.
What is the Total Blackfeet Population in the State of Connecticut?
Total Blackfeet Population in Connecticut is 2,277.
What is the Total Blackfeet Population in the United States?
Total Blackfeet Population in the United States is 203,870.