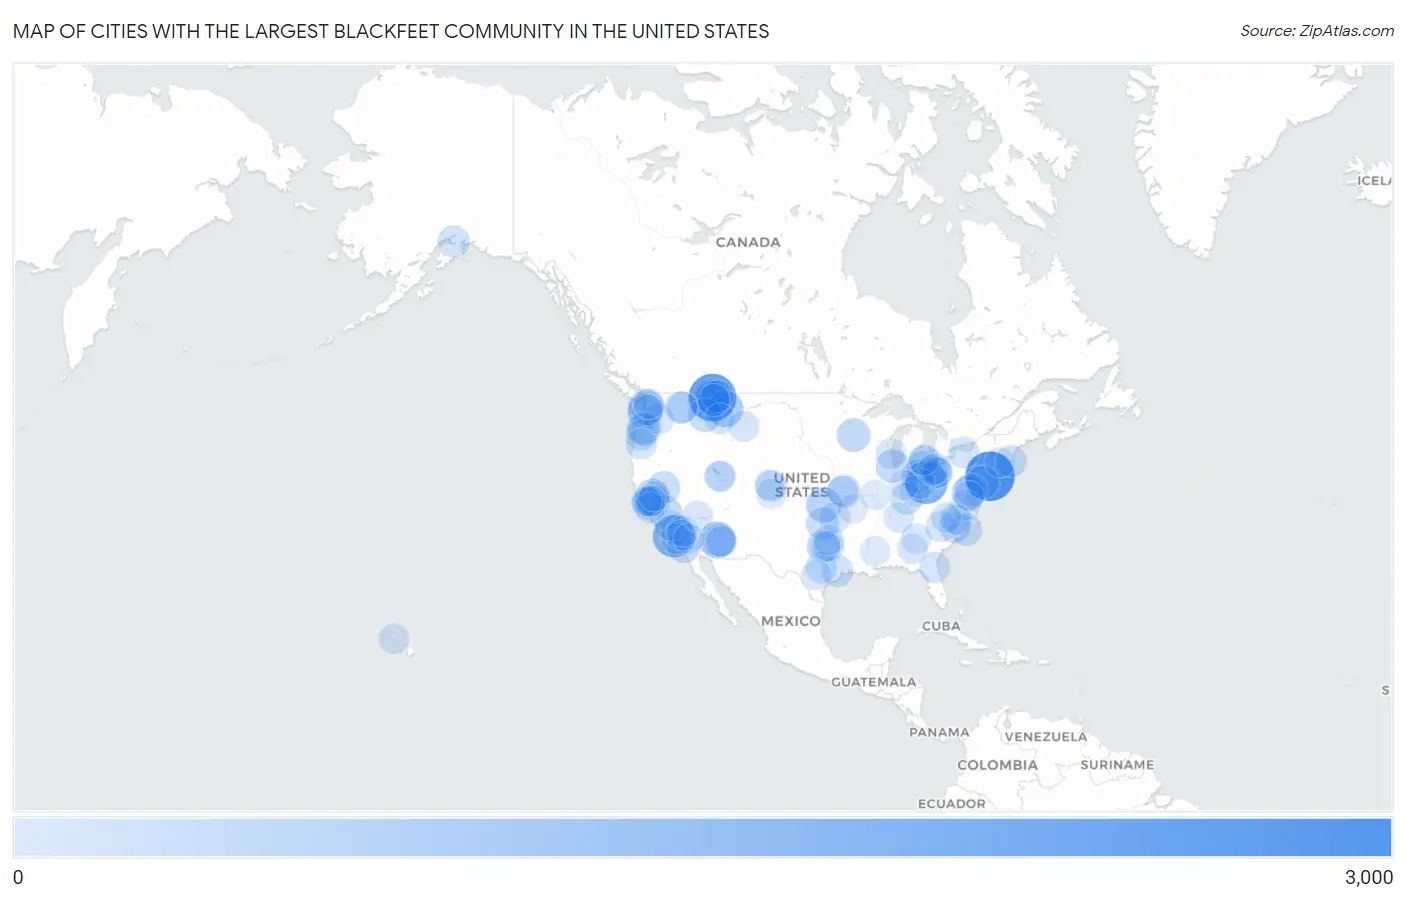
Cities with the Largest Blackfeet Community in the United States
RELATED REPORTS & OPTIONS
Blackfeet
United States
Compare Cities
Map of Cities with the Largest Blackfeet Community in the United States
0
3,000
Cities with the Largest Blackfeet Community in the United States
| City | Blackfeet | vs State | vs National | |
| 1. | New York | 2,944 | 7,727(38.10%)#1 | 203,870(1.44%)#1 |
| 2. | North Browning | 2,651 | 14,793(17.92%)#1 | 203,870(1.30%)#2 |
| 3. | Columbus | 2,004 | 12,315(16.27%)#1 | 203,870(0.98%)#3 |
| 4. | Los Angeles | 1,873 | 26,780(6.99%)#1 | 203,870(0.92%)#4 |
| 5. | South Browning | 1,362 | 14,793(9.21%)#2 | 203,870(0.67%)#5 |
| 6. | Glendale | 1,180 | 4,598(25.66%)#1 | 203,870(0.58%)#6 |
| 7. | Great Falls | 1,129 | 14,793(7.63%)#3 | 203,870(0.55%)#7 |
| 8. | Seattle | 990 | 12,776(7.75%)#1 | 203,870(0.49%)#8 |
| 9. | Tacoma | 941 | 12,776(7.37%)#2 | 203,870(0.46%)#9 |
| 10. | Wichita | 915 | 3,320(27.56%)#1 | 203,870(0.45%)#10 |
| 11. | Sacramento | 867 | 26,780(3.24%)#2 | 203,870(0.43%)#11 |
| 12. | Portland | 779 | 6,118(12.73%)#1 | 203,870(0.38%)#12 |
| 13. | St Paul | 758 | 2,206(34.36%)#1 | 203,870(0.37%)#13 |
| 14. | Browning | 746 | 14,793(5.04%)#4 | 203,870(0.37%)#14 |
| 15. | Fresno | 735 | 26,780(2.74%)#3 | 203,870(0.36%)#15 |
| 16. | Washington | 723 | 723(100.00%)#1 | 203,870(0.35%)#16 |
| 17. | Missoula | 714 | 14,793(4.83%)#5 | 203,870(0.35%)#17 |
| 18. | Philadelphia | 705 | 5,361(13.15%)#1 | 203,870(0.35%)#18 |
| 19. | Fort Worth | 695 | 11,607(5.99%)#1 | 203,870(0.34%)#19 |
| 20. | Chicago | 689 | 4,521(15.24%)#1 | 203,870(0.34%)#20 |
| 21. | San Diego | 673 | 26,780(2.51%)#4 | 203,870(0.33%)#21 |
| 22. | Kansas City | 653 | 5,285(12.36%)#1 | 203,870(0.32%)#22 |
| 23. | Phoenix | 633 | 4,598(13.77%)#2 | 203,870(0.31%)#23 |
| 24. | Lima | 631 | 12,315(5.12%)#2 | 203,870(0.31%)#24 |
| 25. | Oklahoma City | 623 | 3,217(19.37%)#1 | 203,870(0.31%)#25 |
| 26. | Stockton | 623 | 26,780(2.33%)#5 | 203,870(0.31%)#26 |
| 27. | Baltimore | 616 | 4,108(15.00%)#1 | 203,870(0.30%)#27 |
| 28. | Reno | 601 | 2,365(25.41%)#1 | 203,870(0.29%)#28 |
| 29. | Toledo | 567 | 12,315(4.60%)#3 | 203,870(0.28%)#29 |
| 30. | Spokane | 561 | 12,776(4.39%)#3 | 203,870(0.28%)#30 |
| 31. | Detroit | 558 | 7,922(7.04%)#1 | 203,870(0.27%)#31 |
| 32. | Cut Bank | 549 | 14,793(3.71%)#6 | 203,870(0.27%)#32 |
| 33. | Akron | 539 | 12,315(4.38%)#4 | 203,870(0.26%)#33 |
| 34. | Louisville | 516 | 2,102(24.55%)#1 | 203,870(0.25%)#34 |
| 35. | Heart Butte | 514 | 14,793(3.47%)#7 | 203,870(0.25%)#35 |
| 36. | Anchorage | 508 | 1,080(47.04%)#1 | 203,870(0.25%)#36 |
| 37. | Jacksonville | 481 | 6,409(7.51%)#1 | 203,870(0.24%)#37 |
| 38. | Boston | 478 | 3,060(15.62%)#1 | 203,870(0.23%)#38 |
| 39. | Houston | 467 | 11,607(4.02%)#2 | 203,870(0.23%)#39 |
| 40. | Oakland | 441 | 26,780(1.65%)#6 | 203,870(0.22%)#40 |
| 41. | Fayetteville | 437 | 6,409(6.82%)#2 | 203,870(0.21%)#41 |
| 42. | Austin | 429 | 11,607(3.70%)#3 | 203,870(0.21%)#42 |
| 43. | Cleveland | 429 | 12,315(3.48%)#5 | 203,870(0.21%)#43 |
| 44. | Jacksonville | 416 | 8,247(5.04%)#1 | 203,870(0.20%)#44 |
| 45. | Charlotte | 412 | 6,409(6.43%)#3 | 203,870(0.20%)#45 |
| 46. | Rochester | 411 | 7,727(5.32%)#2 | 203,870(0.20%)#46 |
| 47. | Dallas | 410 | 11,607(3.53%)#4 | 203,870(0.20%)#47 |
| 48. | Tulsa | 406 | 3,217(12.62%)#2 | 203,870(0.20%)#48 |
| 49. | Vancouver | 403 | 12,776(3.15%)#4 | 203,870(0.20%)#49 |
| 50. | Aurora | 397 | 3,540(11.21%)#1 | 203,870(0.19%)#50 |
| 51. | Concord | 396 | 26,780(1.48%)#7 | 203,870(0.19%)#51 |
| 52. | Spokane Valley | 393 | 12,776(3.08%)#5 | 203,870(0.19%)#52 |
| 53. | Billings | 391 | 14,793(2.64%)#8 | 203,870(0.19%)#53 |
| 54. | Salem | 382 | 6,118(6.24%)#2 | 203,870(0.19%)#54 |
| 55. | Antioch | 380 | 26,780(1.42%)#8 | 203,870(0.19%)#55 |
| 56. | Lancaster | 379 | 26,780(1.42%)#9 | 203,870(0.19%)#56 |
| 57. | Eugene | 378 | 6,118(6.18%)#3 | 203,870(0.19%)#57 |
| 58. | Cincinnati | 372 | 12,315(3.02%)#6 | 203,870(0.18%)#58 |
| 59. | Long Beach | 370 | 26,780(1.38%)#10 | 203,870(0.18%)#59 |
| 60. | Milwaukee | 367 | 2,052(17.88%)#1 | 203,870(0.18%)#60 |
| 61. | Yakima | 363 | 12,776(2.84%)#6 | 203,870(0.18%)#61 |
| 62. | Durham | 359 | 6,409(5.60%)#4 | 203,870(0.18%)#62 |
| 63. | Bakersfield | 357 | 26,780(1.33%)#11 | 203,870(0.18%)#63 |
| 64. | San Jose | 347 | 26,780(1.30%)#12 | 203,870(0.17%)#64 |
| 65. | Salt Lake City | 345 | 1,901(18.15%)#1 | 203,870(0.17%)#65 |
| 66. | Kent | 343 | 12,776(2.68%)#7 | 203,870(0.17%)#66 |
| 67. | Mesa | 336 | 4,598(7.31%)#3 | 203,870(0.16%)#67 |
| 68. | Apple Valley | 336 | 26,780(1.25%)#13 | 203,870(0.16%)#68 |
| 69. | North Las Vegas | 332 | 2,365(14.04%)#2 | 203,870(0.16%)#69 |
| 70. | Fontana | 326 | 26,780(1.22%)#14 | 203,870(0.16%)#70 |
| 71. | Richmond | 323 | 3,607(8.95%)#1 | 203,870(0.16%)#71 |
| 72. | Helena | 322 | 14,793(2.18%)#9 | 203,870(0.16%)#72 |
| 73. | Nashville | 319 | 2,412(13.23%)#1 | 203,870(0.16%)#73 |
| 74. | Raleigh | 318 | 6,409(4.96%)#5 | 203,870(0.16%)#74 |
| 75. | Atlanta | 316 | 4,696(6.73%)#1 | 203,870(0.16%)#75 |
| 76. | Urban Honolulu | 314 | 1,825(17.21%)#1 | 203,870(0.15%)#76 |
| 77. | Columbus | 311 | 4,696(6.62%)#2 | 203,870(0.15%)#77 |
| 78. | Winston Salem | 307 | 6,409(4.79%)#6 | 203,870(0.15%)#78 |
| 79. | West Valley City | 306 | 1,901(16.10%)#2 | 203,870(0.15%)#79 |
| 80. | Palm Desert | 306 | 26,780(1.14%)#15 | 203,870(0.15%)#80 |
| 81. | San Antonio | 305 | 11,607(2.63%)#5 | 203,870(0.15%)#81 |
| 82. | Everett | 304 | 12,776(2.38%)#8 | 203,870(0.15%)#82 |
| 83. | Denver | 303 | 3,540(8.56%)#2 | 203,870(0.15%)#83 |
| 84. | Kansas City | 303 | 3,320(9.13%)#2 | 203,870(0.15%)#84 |
| 85. | Springfield | 301 | 12,315(2.44%)#7 | 203,870(0.15%)#85 |
| 86. | Elyria | 300 | 12,315(2.44%)#8 | 203,870(0.15%)#86 |
| 87. | Sherman | 293 | 11,607(2.52%)#6 | 203,870(0.14%)#87 |
| 88. | Springfield | 289 | 3,060(9.44%)#2 | 203,870(0.14%)#88 |
| 89. | Oakley | 289 | 26,780(1.08%)#16 | 203,870(0.14%)#89 |
| 90. | Waldorf | 283 | 4,108(6.89%)#2 | 203,870(0.14%)#90 |
| 91. | Bedford | 283 | 11,607(2.44%)#7 | 203,870(0.14%)#91 |
| 92. | San Pablo | 278 | 26,780(1.04%)#17 | 203,870(0.14%)#92 |
| 93. | St Louis | 277 | 5,285(5.24%)#2 | 203,870(0.14%)#93 |
| 94. | Kent | 272 | 12,315(2.21%)#9 | 203,870(0.13%)#94 |
| 95. | Springfield | 271 | 5,285(5.13%)#3 | 203,870(0.13%)#95 |
| 96. | Southfield | 271 | 7,922(3.42%)#2 | 203,870(0.13%)#96 |
| 97. | Colorado Springs | 270 | 3,540(7.63%)#3 | 203,870(0.13%)#97 |
| 98. | Jackson | 266 | 884(30.09%)#1 | 203,870(0.13%)#98 |
| 99. | Rancho Cordova | 266 | 26,780(0.99%)#18 | 203,870(0.13%)#99 |
| 100. | Indianapolis | 265 | 3,216(8.24%)#1 | 203,870(0.13%)#100 |
Common Questions
What are the Top 10 Cities with the Largest Blackfeet Community in the United States?
Top 10 Cities with the Largest Blackfeet Community in the United States are:
#1
2,944
#2
2,651
#3
2,004
#4
1,873
#5
1,362
#6
1,180
#7
1,129
#8
990
#9
941
#10
915
What city has the Largest Blackfeet Community in the United States?
New York has the Largest Blackfeet Community in the United States with 2,944.
What is the Total Blackfeet Population in the United States?
Total Blackfeet Population in the United States is 203,870.