Cities with the Largest Blackfeet Community in Illinois
RELATED REPORTS & OPTIONS
Blackfeet
Illinois
Compare Cities
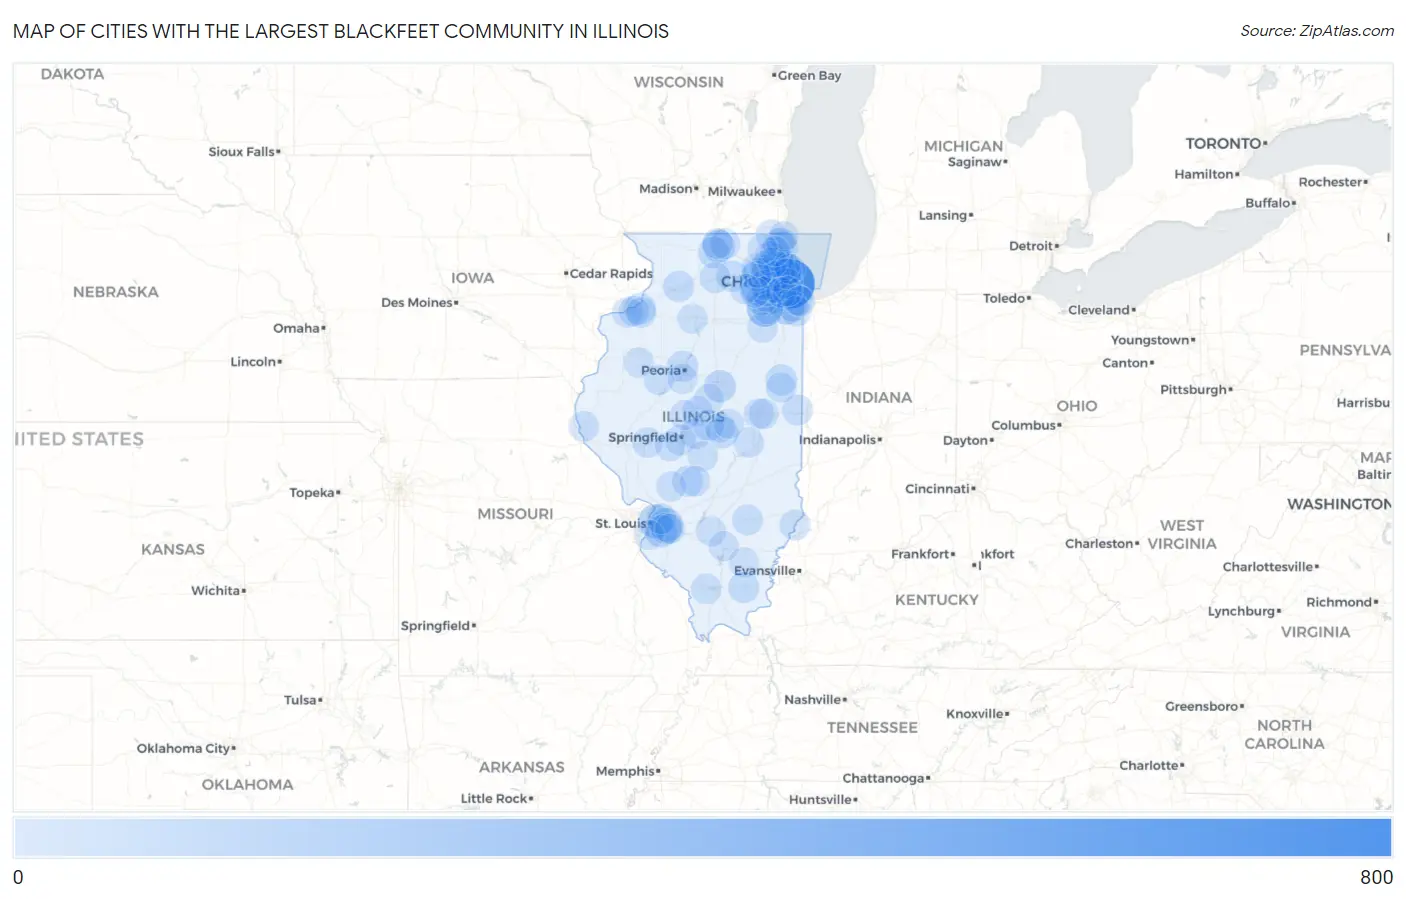
Map of Cities with the Largest Blackfeet Community in Illinois
0
800
Cities with the Largest Blackfeet Community in Illinois
| City | Blackfeet | vs State | vs National | |
| 1. | Chicago | 689 | 4,521(15.24%)#1 | 203,870(0.34%)#20 |
| 2. | Joliet | 211 | 4,521(4.67%)#2 | 203,870(0.10%)#130 |
| 3. | Frankfort Square | 142 | 4,521(3.14%)#3 | 203,870(0.07%)#212 |
| 4. | Fairmont City | 133 | 4,521(2.94%)#4 | 203,870(0.07%)#229 |
| 5. | O Fallon | 126 | 4,521(2.79%)#5 | 203,870(0.06%)#253 |
| 6. | Loves Park | 85 | 4,521(1.88%)#6 | 203,870(0.04%)#405 |
| 7. | Belleville | 81 | 4,521(1.79%)#7 | 203,870(0.04%)#427 |
| 8. | Bloomington | 76 | 4,521(1.68%)#8 | 203,870(0.04%)#456 |
| 9. | Romeoville | 75 | 4,521(1.66%)#9 | 203,870(0.04%)#467 |
| 10. | North Chicago | 58 | 4,521(1.28%)#10 | 203,870(0.03%)#605 |
| 11. | Morton Grove | 57 | 4,521(1.26%)#11 | 203,870(0.03%)#616 |
| 12. | Decatur | 55 | 4,521(1.22%)#12 | 203,870(0.03%)#640 |
| 13. | North Aurora | 54 | 4,521(1.19%)#13 | 203,870(0.03%)#658 |
| 14. | Buffalo Grove | 53 | 4,521(1.17%)#14 | 203,870(0.03%)#668 |
| 15. | Shiloh | 53 | 4,521(1.17%)#15 | 203,870(0.03%)#673 |
| 16. | Cissna Park | 51 | 4,521(1.13%)#16 | 203,870(0.03%)#704 |
| 17. | East Moline | 50 | 4,521(1.11%)#17 | 203,870(0.02%)#719 |
| 18. | Rockford | 49 | 4,521(1.08%)#18 | 203,870(0.02%)#729 |
| 19. | Sterling | 47 | 4,521(1.04%)#19 | 203,870(0.02%)#767 |
| 20. | Dekalb | 46 | 4,521(1.02%)#20 | 203,870(0.02%)#773 |
| 21. | Latham | 43 | 4,521(0.95%)#21 | 203,870(0.02%)#839 |
| 22. | Harrisburg | 42 | 4,521(0.93%)#22 | 203,870(0.02%)#854 |
| 23. | Butler | 40 | 4,521(0.88%)#23 | 203,870(0.02%)#896 |
| 24. | Peoria | 39 | 4,521(0.86%)#24 | 203,870(0.02%)#897 |
| 25. | Westmont | 36 | 4,521(0.80%)#25 | 203,870(0.02%)#980 |
| 26. | Aurora | 35 | 4,521(0.77%)#26 | 203,870(0.02%)#991 |
| 27. | Rochelle | 35 | 4,521(0.77%)#27 | 203,870(0.02%)#1,007 |
| 28. | Danville | 34 | 4,521(0.75%)#28 | 203,870(0.02%)#1,021 |
| 29. | Plainfield | 30 | 4,521(0.66%)#29 | 203,870(0.01%)#1,115 |
| 30. | Flora | 30 | 4,521(0.66%)#30 | 203,870(0.01%)#1,133 |
| 31. | St Francisville | 30 | 4,521(0.66%)#31 | 203,870(0.01%)#1,134 |
| 32. | Downers Grove | 29 | 4,521(0.64%)#32 | 203,870(0.01%)#1,140 |
| 33. | Stone Park | 29 | 4,521(0.64%)#33 | 203,870(0.01%)#1,154 |
| 34. | Elgin | 28 | 4,521(0.62%)#34 | 203,870(0.01%)#1,163 |
| 35. | Springfield | 27 | 4,521(0.60%)#35 | 203,870(0.01%)#1,188 |
| 36. | Schaumburg | 26 | 4,521(0.58%)#36 | 203,870(0.01%)#1,223 |
| 37. | Flossmoor | 26 | 4,521(0.58%)#37 | 203,870(0.01%)#1,239 |
| 38. | Hoffman Estates | 24 | 4,521(0.53%)#38 | 203,870(0.01%)#1,295 |
| 39. | Rock Island | 24 | 4,521(0.53%)#39 | 203,870(0.01%)#1,299 |
| 40. | Des Plaines | 23 | 4,521(0.51%)#40 | 203,870(0.01%)#1,332 |
| 41. | Quincy | 23 | 4,521(0.51%)#41 | 203,870(0.01%)#1,338 |
| 42. | Wheeling | 23 | 4,521(0.51%)#42 | 203,870(0.01%)#1,340 |
| 43. | Jacksonville | 23 | 4,521(0.51%)#43 | 203,870(0.01%)#1,347 |
| 44. | Candlewick Lake | 23 | 4,521(0.51%)#44 | 203,870(0.01%)#1,358 |
| 45. | Berwyn | 22 | 4,521(0.49%)#45 | 203,870(0.01%)#1,372 |
| 46. | Machesney Park | 21 | 4,521(0.46%)#46 | 203,870(0.01%)#1,429 |
| 47. | Antioch | 21 | 4,521(0.46%)#47 | 203,870(0.01%)#1,436 |
| 48. | Streamwood | 19 | 4,521(0.42%)#48 | 203,870(0.01%)#1,510 |
| 49. | Gurnee | 19 | 4,521(0.42%)#49 | 203,870(0.01%)#1,512 |
| 50. | Dolton | 19 | 4,521(0.42%)#50 | 203,870(0.01%)#1,518 |
| 51. | Lincoln | 19 | 4,521(0.42%)#51 | 203,870(0.01%)#1,523 |
| 52. | South Chicago Heights | 19 | 4,521(0.42%)#52 | 203,870(0.01%)#1,536 |
| 53. | Champaign | 18 | 4,521(0.40%)#53 | 203,870(0.01%)#1,561 |
| 54. | Hanover Park | 18 | 4,521(0.40%)#54 | 203,870(0.01%)#1,574 |
| 55. | Collinsville | 18 | 4,521(0.40%)#55 | 203,870(0.01%)#1,579 |
| 56. | Rockdale | 18 | 4,521(0.40%)#56 | 203,870(0.01%)#1,604 |
| 57. | Buffalo | 18 | 4,521(0.40%)#57 | 203,870(0.01%)#1,610 |
| 58. | Carbondale | 17 | 4,521(0.38%)#58 | 203,870(0.01%)#1,636 |
| 59. | Moline | 16 | 4,521(0.35%)#59 | 203,870(0.01%)#1,691 |
| 60. | Lake Zurich | 16 | 4,521(0.35%)#60 | 203,870(0.01%)#1,699 |
| 61. | Warrenville | 16 | 4,521(0.35%)#61 | 203,870(0.01%)#1,706 |
| 62. | Taylorville | 16 | 4,521(0.35%)#62 | 203,870(0.01%)#1,710 |
| 63. | Arthur | 16 | 4,521(0.35%)#63 | 203,870(0.01%)#1,739 |
| 64. | Irving | 16 | 4,521(0.35%)#64 | 203,870(0.01%)#1,747 |
| 65. | Urbana | 15 | 4,521(0.33%)#65 | 203,870(0.01%)#1,757 |
| 66. | St Charles | 15 | 4,521(0.33%)#66 | 203,870(0.01%)#1,761 |
| 67. | Canton | 15 | 4,521(0.33%)#67 | 203,870(0.01%)#1,770 |
| 68. | Middletown | 15 | 4,521(0.33%)#68 | 203,870(0.01%)#1,814 |
| 69. | Glenview | 14 | 4,521(0.31%)#69 | 203,870(0.01%)#1,836 |
| 70. | Centralia | 14 | 4,521(0.31%)#70 | 203,870(0.01%)#1,865 |
| 71. | Addison | 13 | 4,521(0.29%)#71 | 203,870(0.01%)#1,913 |
| 72. | Pekin | 13 | 4,521(0.29%)#72 | 203,870(0.01%)#1,916 |
| 73. | Harwood Heights | 13 | 4,521(0.29%)#73 | 203,870(0.01%)#1,937 |
| 74. | Columbia | 12 | 4,521(0.27%)#74 | 203,870(0.01%)#2,013 |
| 75. | Braidwood | 12 | 4,521(0.27%)#75 | 203,870(0.01%)#2,030 |
| 76. | Abingdon | 12 | 4,521(0.27%)#76 | 203,870(0.01%)#2,041 |
| 77. | Naperville | 11 | 4,521(0.24%)#77 | 203,870(0.01%)#2,072 |
| 78. | South Elgin | 11 | 4,521(0.24%)#78 | 203,870(0.01%)#2,096 |
| 79. | Willow Springs | 11 | 4,521(0.24%)#79 | 203,870(0.01%)#2,136 |
| 80. | Colona | 11 | 4,521(0.24%)#80 | 203,870(0.01%)#2,138 |
| 81. | Big Rock | 11 | 4,521(0.24%)#81 | 203,870(0.01%)#2,171 |
| 82. | Waukegan | 10 | 4,521(0.22%)#82 | 203,870(0.00%)#2,193 |
| 83. | Palatine | 10 | 4,521(0.22%)#83 | 203,870(0.00%)#2,195 |
| 84. | Zion | 10 | 4,521(0.22%)#84 | 203,870(0.00%)#2,215 |
| 85. | Scott Afb | 10 | 4,521(0.22%)#85 | 203,870(0.00%)#2,258 |
| 86. | Forsyth | 10 | 4,521(0.22%)#86 | 203,870(0.00%)#2,259 |
| 87. | Mcleansboro | 10 | 4,521(0.22%)#87 | 203,870(0.00%)#2,266 |
| 88. | Argenta | 10 | 4,521(0.22%)#88 | 203,870(0.00%)#2,285 |
| 89. | Rankin | 10 | 4,521(0.22%)#89 | 203,870(0.00%)#2,299 |
| 90. | Skokie | 9 | 4,521(0.20%)#90 | 203,870(0.00%)#2,310 |
| 91. | Calumet City | 9 | 4,521(0.20%)#91 | 203,870(0.00%)#2,322 |
| 92. | Mundelein | 9 | 4,521(0.20%)#92 | 203,870(0.00%)#2,326 |
| 93. | Burbank | 9 | 4,521(0.20%)#93 | 203,870(0.00%)#2,328 |
| 94. | Montgomery | 9 | 4,521(0.20%)#94 | 203,870(0.00%)#2,343 |
| 95. | Mount Vernon | 9 | 4,521(0.20%)#95 | 203,870(0.00%)#2,357 |
| 96. | Princeton | 9 | 4,521(0.20%)#96 | 203,870(0.00%)#2,375 |
| 97. | Gillespie | 9 | 4,521(0.20%)#97 | 203,870(0.00%)#2,394 |
| 98. | Loami | 9 | 4,521(0.20%)#98 | 203,870(0.00%)#2,427 |
| 99. | Mclean | 9 | 4,521(0.20%)#99 | 203,870(0.00%)#2,433 |
| 100. | Holiday Hills | 9 | 4,521(0.20%)#100 | 203,870(0.00%)#2,435 |
Common Questions
What are the Top 10 Cities with the Largest Blackfeet Community in Illinois?
Top 10 Cities with the Largest Blackfeet Community in Illinois are:
#1
689
#2
211
#3
142
#4
133
#5
126
#6
85
#7
81
#8
76
#9
75
#10
58
What city has the Largest Blackfeet Community in Illinois?
Chicago has the Largest Blackfeet Community in Illinois with 689.
What is the Total Blackfeet Population in the State of Illinois?
Total Blackfeet Population in Illinois is 4,521.
What is the Total Blackfeet Population in the United States?
Total Blackfeet Population in the United States is 203,870.