Cities with the Highest Percentage of Ugandan Population in the United States
RELATED REPORTS & OPTIONS
Ugandan
United States
Compare Cities
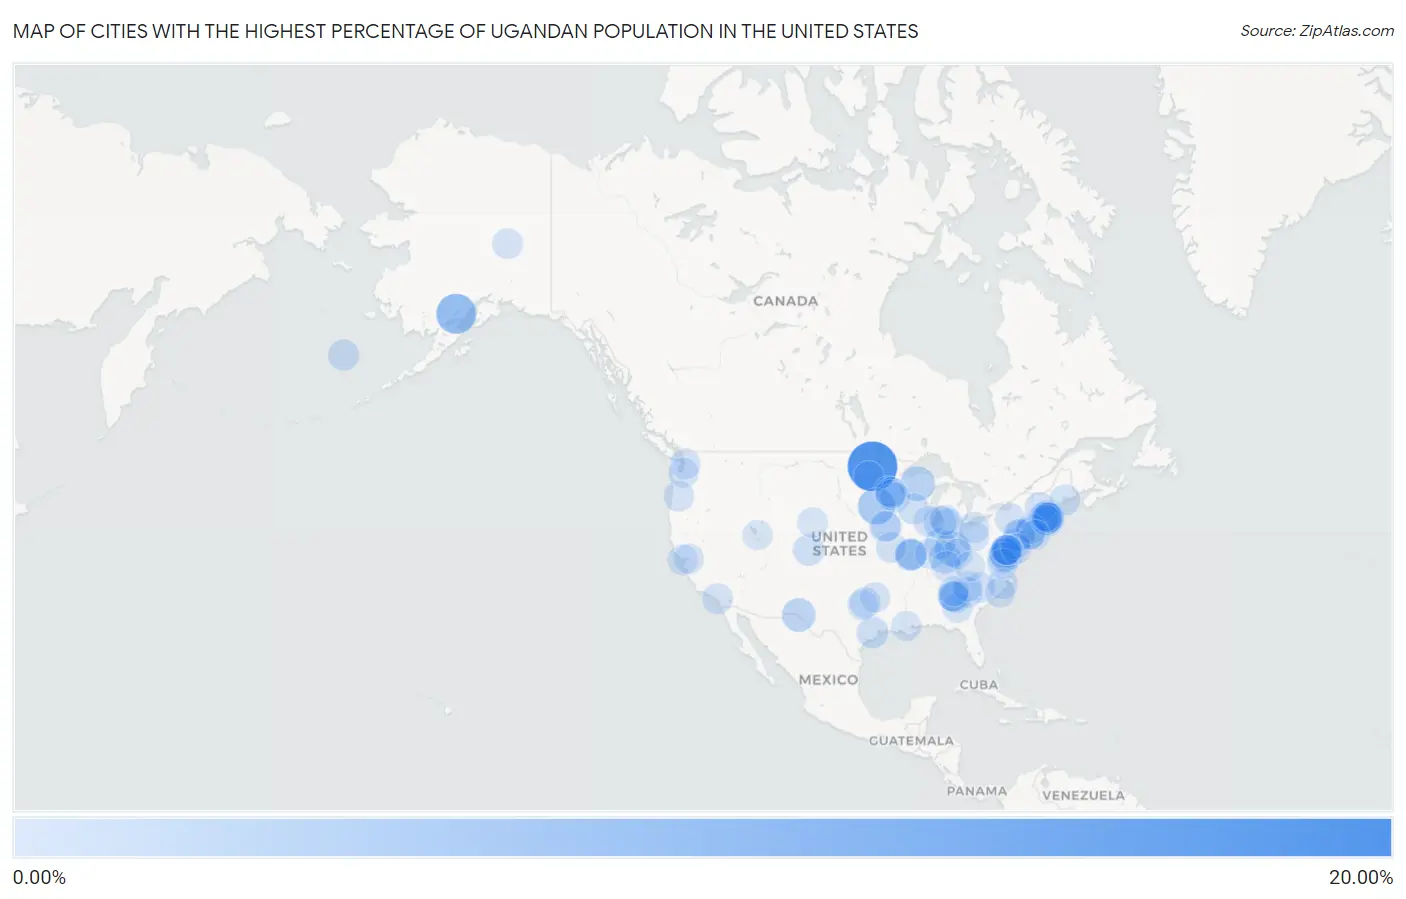
Map of Cities with the Highest Percentage of Ugandan Population in the United States
0.00%
20.00%
Cities with the Highest Percentage of Ugandan Population in the United States
| City | Ugandan | vs State | vs National | |
| 1. | Mcintosh | 15.32% | 0.015%(+15.3)#1 | 0.0076%(+15.3)#1 |
| 2. | Port Alsworth | 7.59% | 0.0039%(+7.59)#1 | 0.0076%(+7.59)#2 |
| 3. | New Orleans Station | 7.17% | 0.0071%(+7.17)#1 | 0.0076%(+7.16)#3 |
| 4. | Okabena | 5.00% | 0.015%(+4.99)#2 | 0.0076%(+4.99)#4 |
| 5. | Pleasant Hills | 4.05% | 0.0064%(+4.04)#1 | 0.0076%(+4.04)#5 |
| 6. | Sayner | 3.55% | 0.00087%(+3.55)#1 | 0.0076%(+3.54)#6 |
| 7. | Pinehurst | 3.30% | 0.062%(+3.24)#1 | 0.0076%(+3.29)#7 |
| 8. | Clint | 2.67% | 0.0067%(+2.67)#1 | 0.0076%(+2.67)#8 |
| 9. | Maryland Park | 2.42% | 0.019%(+2.41)#1 | 0.0076%(+2.42)#9 |
| 10. | Bensville | 2.36% | 0.019%(+2.34)#2 | 0.0076%(+2.35)#10 |
| 11. | Eau Claire | 1.99% | 0.0046%(+1.98)#1 | 0.0076%(+1.98)#11 |
| 12. | Wildwood | 1.68% | 0.0040%(+1.68)#1 | 0.0076%(+1.67)#12 |
| 13. | Pelham Manor | 1.60% | 0.0059%(+1.60)#1 | 0.0076%(+1.59)#13 |
| 14. | Folcroft Borough | 1.26% | 0.0055%(+1.25)#1 | 0.0076%(+1.25)#14 |
| 15. | Richmond | 1.18% | 0.0067%(+1.18)#2 | 0.0076%(+1.17)#15 |
| 16. | Phillipsburg | 1.17% | 0.0070%(+1.16)#1 | 0.0076%(+1.16)#16 |
| 17. | Woodmoor | 1.14% | 0.010%(+1.13)#1 | 0.0076%(+1.13)#17 |
| 18. | Clarkston | 1.12% | 0.016%(+1.10)#1 | 0.0076%(+1.11)#18 |
| 19. | Waltham | 1.10% | 0.062%(+1.03)#2 | 0.0076%(+1.09)#19 |
| 20. | Edgewater Borough | 1.08% | 0.0070%(+1.07)#2 | 0.0076%(+1.07)#20 |
| 21. | Fenton | 1.05% | 0.0069%(+1.04)#1 | 0.0076%(+1.04)#21 |
| 22. | Colmar Manor | 0.99% | 0.019%(+0.970)#3 | 0.0076%(+0.982)#22 |
| 23. | Leesylvania | 0.99% | 0.015%(+0.971)#1 | 0.0076%(+0.978)#23 |
| 24. | Clermont | 0.99% | 0.0011%(+0.984)#1 | 0.0076%(+0.978)#24 |
| 25. | Edmundson | 0.98% | 0.0069%(+0.974)#2 | 0.0076%(+0.973)#25 |
| 26. | Huntleigh | 0.93% | 0.0069%(+0.923)#3 | 0.0076%(+0.923)#26 |
| 27. | Dallas Center | 0.90% | 0.0038%(+0.900)#1 | 0.0076%(+0.896)#27 |
| 28. | St Paul | 0.86% | 0.0039%(+0.856)#2 | 0.0076%(+0.852)#28 |
| 29. | Loganville | 0.85% | 0.00087%(+0.847)#2 | 0.0076%(+0.840)#29 |
| 30. | Colon | 0.79% | 0.0046%(+0.786)#2 | 0.0076%(+0.783)#30 |
| 31. | Woburn | 0.79% | 0.062%(+0.726)#3 | 0.0076%(+0.780)#31 |
| 32. | Avondale Estates | 0.77% | 0.016%(+0.754)#2 | 0.0076%(+0.762)#32 |
| 33. | Roessleville | 0.72% | 0.0059%(+0.711)#2 | 0.0076%(+0.709)#33 |
| 34. | Mitchellville | 0.69% | 0.019%(+0.675)#4 | 0.0076%(+0.686)#34 |
| 35. | Walpole | 0.69% | 0.062%(+0.628)#4 | 0.0076%(+0.683)#35 |
| 36. | Cleveland Heights | 0.69% | 0.0064%(+0.680)#2 | 0.0076%(+0.679)#36 |
| 37. | Brass Castle | 0.68% | 0.0070%(+0.673)#3 | 0.0076%(+0.672)#37 |
| 38. | Castine | 0.65% | 0.0026%(+0.647)#1 | 0.0076%(+0.642)#38 |
| 39. | Little Elm | 0.65% | 0.0067%(+0.640)#3 | 0.0076%(+0.639)#39 |
| 40. | Lincolnia | 0.61% | 0.015%(+0.591)#2 | 0.0076%(+0.598)#40 |
| 41. | Mckees Rocks Borough | 0.59% | 0.0055%(+0.588)#2 | 0.0076%(+0.586)#41 |
| 42. | Brunswick | 0.58% | 0.0069%(+0.577)#4 | 0.0076%(+0.576)#42 |
| 43. | Bannockburn | 0.56% | 0.0045%(+0.559)#1 | 0.0076%(+0.556)#43 |
| 44. | Calverton | 0.56% | 0.019%(+0.543)#5 | 0.0076%(+0.554)#44 |
| 45. | Waxhaw | 0.55% | 0.0061%(+0.541)#1 | 0.0076%(+0.539)#45 |
| 46. | Woodbridge | 0.53% | 0.015%(+0.520)#3 | 0.0076%(+0.527)#46 |
| 47. | Due West | 0.52% | 0.0027%(+0.520)#1 | 0.0076%(+0.515)#47 |
| 48. | Fredericksburg | 0.51% | 0.015%(+0.491)#4 | 0.0076%(+0.498)#48 |
| 49. | Coto De Caza | 0.48% | 0.0063%(+0.473)#1 | 0.0076%(+0.472)#49 |
| 50. | Difficult Run | 0.47% | 0.015%(+0.455)#5 | 0.0076%(+0.462)#50 |
| 51. | Eielson Afb | 0.46% | 0.0039%(+0.452)#3 | 0.0076%(+0.448)#51 |
| 52. | Leominster | 0.45% | 0.062%(+0.392)#5 | 0.0076%(+0.446)#52 |
| 53. | Martha Lake | 0.45% | 0.017%(+0.434)#1 | 0.0076%(+0.444)#53 |
| 54. | Roslyn | 0.44% | 0.0059%(+0.438)#3 | 0.0076%(+0.436)#54 |
| 55. | Stonington Borough | 0.42% | 0.014%(+0.410)#1 | 0.0076%(+0.417)#55 |
| 56. | North Star | 0.42% | 0.0051%(+0.413)#1 | 0.0076%(+0.411)#56 |
| 57. | Lebanon | 0.41% | 0.0060%(+0.407)#1 | 0.0076%(+0.406)#57 |
| 58. | Kinston | 0.41% | 0.0061%(+0.405)#2 | 0.0076%(+0.403)#58 |
| 59. | Millersburg | 0.40% | 0.0052%(+0.400)#1 | 0.0076%(+0.397)#59 |
| 60. | Clayton | 0.40% | 0.0051%(+0.397)#2 | 0.0076%(+0.395)#60 |
| 61. | Mounds View | 0.39% | 0.015%(+0.375)#3 | 0.0076%(+0.382)#61 |
| 62. | Burlington | 0.37% | 0.062%(+0.312)#6 | 0.0076%(+0.367)#62 |
| 63. | Shoreview | 0.35% | 0.015%(+0.332)#4 | 0.0076%(+0.339)#63 |
| 64. | Northeast Ithaca | 0.34% | 0.0059%(+0.337)#4 | 0.0076%(+0.335)#64 |
| 65. | Fort Valley | 0.33% | 0.016%(+0.313)#3 | 0.0076%(+0.321)#65 |
| 66. | Haltom City | 0.33% | 0.0067%(+0.321)#4 | 0.0076%(+0.320)#66 |
| 67. | Dover | 0.31% | 0.0064%(+0.306)#3 | 0.0076%(+0.305)#67 |
| 68. | Larkspur | 0.31% | 0.0063%(+0.302)#2 | 0.0076%(+0.301)#68 |
| 69. | Torrington | 0.31% | 0.0062%(+0.302)#1 | 0.0076%(+0.301)#69 |
| 70. | Latham | 0.31% | 0.0059%(+0.302)#5 | 0.0076%(+0.300)#70 |
| 71. | Northchase | 0.31% | 0.0061%(+0.301)#3 | 0.0076%(+0.299)#71 |
| 72. | Maysville | 0.31% | 0.0040%(+0.302)#2 | 0.0076%(+0.298)#72 |
| 73. | Bridgeport | 0.30% | 0.0045%(+0.291)#2 | 0.0076%(+0.288)#73 |
| 74. | Campbellsville | 0.29% | 0.0040%(+0.285)#3 | 0.0076%(+0.281)#74 |
| 75. | Vinings | 0.29% | 0.016%(+0.270)#4 | 0.0076%(+0.278)#75 |
| 76. | Tigerville | 0.28% | 0.0027%(+0.280)#2 | 0.0076%(+0.275)#76 |
| 77. | Framingham | 0.28% | 0.062%(+0.220)#7 | 0.0076%(+0.275)#77 |
| 78. | Danbury | 0.27% | 0.014%(+0.252)#2 | 0.0076%(+0.258)#78 |
| 79. | State College Borough | 0.26% | 0.0055%(+0.254)#3 | 0.0076%(+0.252)#79 |
| 80. | Spanaway | 0.26% | 0.017%(+0.242)#2 | 0.0076%(+0.251)#80 |
| 81. | Bon Air | 0.26% | 0.015%(+0.243)#6 | 0.0076%(+0.250)#81 |
| 82. | Grundy | 0.26% | 0.015%(+0.242)#7 | 0.0076%(+0.250)#82 |
| 83. | Lowell | 0.26% | 0.062%(+0.195)#8 | 0.0076%(+0.249)#83 |
| 84. | North Druid Hills | 0.26% | 0.016%(+0.239)#5 | 0.0076%(+0.248)#84 |
| 85. | Danvers | 0.25% | 0.062%(+0.192)#9 | 0.0076%(+0.247)#85 |
| 86. | South Laurel | 0.25% | 0.019%(+0.231)#6 | 0.0076%(+0.242)#86 |
| 87. | South Salt Lake | 0.24% | 0.0068%(+0.236)#1 | 0.0076%(+0.236)#87 |
| 88. | East Patchogue | 0.24% | 0.0059%(+0.237)#6 | 0.0076%(+0.235)#88 |
| 89. | Kalamazoo | 0.24% | 0.0046%(+0.234)#3 | 0.0076%(+0.231)#89 |
| 90. | Dayton | 0.23% | 0.015%(+0.218)#5 | 0.0076%(+0.225)#90 |
| 91. | Red Wing | 0.23% | 0.015%(+0.214)#6 | 0.0076%(+0.221)#91 |
| 92. | Rio Vista | 0.23% | 0.0063%(+0.222)#3 | 0.0076%(+0.221)#92 |
| 93. | Village St George | 0.22% | 0.0071%(+0.217)#2 | 0.0076%(+0.217)#93 |
| 94. | Paris | 0.22% | 0.0067%(+0.217)#5 | 0.0076%(+0.216)#94 |
| 95. | Richfield | 0.22% | 0.015%(+0.208)#7 | 0.0076%(+0.215)#95 |
| 96. | Waukee | 0.22% | 0.0038%(+0.216)#2 | 0.0076%(+0.212)#96 |
| 97. | Barnesville | 0.22% | 0.015%(+0.202)#8 | 0.0076%(+0.209)#97 |
| 98. | Rutherford Borough | 0.21% | 0.0070%(+0.206)#4 | 0.0076%(+0.206)#98 |
| 99. | Fairland | 0.21% | 0.019%(+0.193)#7 | 0.0076%(+0.204)#99 |
| 100. | Nelson | 0.21% | 0.016%(+0.195)#6 | 0.0076%(+0.204)#100 |
Common Questions
What are the Top 10 Cities with the Highest Percentage of Ugandan Population in the United States?
Top 10 Cities with the Highest Percentage of Ugandan Population in the United States are:
What city has the Highest Percentage of Ugandan Population in the United States?
Mcintosh has the Highest Percentage of Ugandan Population in the United States with 15.32%.
What is the Percentage of Ugandan Population in the United States?
Percentage of Ugandan Population in the United States is 0.0076%.