Cities with the Highest Percentage of Ugandan Population in Maryland

RELATED REPORTS & OPTIONS

Ugandan
Population
Families and Households
Female Fertility
Female Fertility (Unmarried)
Race (Community Size)
Race (Percentage)
Ancestry (Community Size)
AfghanAfricanAlaska NativeAlaskan AthabascanAlbanianAleutAlsatianAmericanApacheArabArapahoArgentineanArmenianAssyrian / Chaldean / SyriacAustralianAustrianBahamianBangladeshiBarbadianBasqueBelgianBelizeanBermudanBhutaneseBlackfeetBolivianBrazilianBritishBritish West IndianBulgarianBurmeseCajunCambodianCanadianCape VerdeanCarpatho RusynCelticCentral AmericanCentral American IndianCherokeeCheyenneChickasawChileanChineseChippewaChoctawColombianColvilleComancheCosta RicanCreeCreekCroatianCrowCubanCypriotCzechCzechoslovakianDanishDelawareDominicanDutchDutch West IndianEastern EuropeanEcuadorianEgyptianEnglishEstonianEthiopianEuropeanFijianFilipinoFinnishFrenchFrench American IndianFrench CanadianGermanGerman RussianGhanaianGreekGuamanian / ChamorroGuatemalanGuyaneseHaitianHmongHonduranHopiHoumaHungarianIcelanderIndian (Asian)IndonesianInupiatIranianIraqiIrishIroquoisIsraeliItalianJamaicanJapaneseJordanianKenyanKiowaKoreanLaotianLatvianLebaneseLiberianLithuanianLumbeeLuxembourgerMacedonianMalaysianMalteseMarshalleseMenomineeMexicanMexican American IndianMongolianMoroccanNative HawaiianNavajoNepaleseNew ZealanderNicaraguanNigerianNorthern EuropeanNorwegianOkinawanOsageOttawaPaiutePakistaniPalestinianPanamanianParaguayanPennsylvania GermanPeruvianPimaPolishPortuguesePotawatomiPuebloPuerto RicanPuget Sound SalishRomanianRussianSalvadoranSamoanScandinavianScotch-IrishScottishSeminoleSenegaleseSerbianShoshoneSierra LeoneanSiouxSlavicSlovakSloveneSomaliSouth AfricanSouth AmericanSouth American IndianSoviet UnionSpaniardSpanishSpanish AmericanSpanish American IndianSri LankanSubsaharan AfricanSudaneseSwedishSwissSyrianTaiwaneseThaiTlingit-HaidaTohono O'OdhamTonganTrinidadian and TobagonianTsimshianTurkishU.S. Virgin IslanderUgandanUkrainianUruguayanUteVenezuelanVietnameseWelshWest IndianYakamaYaquiYugoslavianYumanYup'ikZimbabwean
Ancestry (Percentage)
AfghanAfricanAlaska NativeAlaskan AthabascanAlbanianAleutAlsatianAmericanApacheArabArapahoArgentineanArmenianAssyrian / Chaldean / SyriacAustralianAustrianBahamianBangladeshiBarbadianBasqueBelgianBelizeanBermudanBhutaneseBlackfeetBolivianBrazilianBritishBritish West IndianBulgarianBurmeseCajunCambodianCanadianCape VerdeanCarpatho RusynCelticCentral AmericanCentral American IndianCherokeeCheyenneChickasawChileanChineseChippewaChoctawColombianColvilleComancheCosta RicanCreeCreekCroatianCrowCubanCypriotCzechCzechoslovakianDanishDelawareDominicanDutchDutch West IndianEastern EuropeanEcuadorianEgyptianEnglishEstonianEthiopianEuropeanFijianFilipinoFinnishFrenchFrench American IndianFrench CanadianGermanGerman RussianGhanaianGreekGuamanian / ChamorroGuatemalanGuyaneseHaitianHmongHonduranHopiHoumaHungarianIcelanderIndian (Asian)IndonesianInupiatIranianIraqiIrishIroquoisIsraeliItalianJamaicanJapaneseJordanianKenyanKiowaKoreanLaotianLatvianLebaneseLiberianLithuanianLumbeeLuxembourgerMacedonianMalaysianMalteseMarshalleseMenomineeMexicanMexican American IndianMongolianMoroccanNative HawaiianNavajoNepaleseNew ZealanderNicaraguanNigerianNorthern EuropeanNorwegianOkinawanOsageOttawaPaiutePakistaniPalestinianPanamanianParaguayanPennsylvania GermanPeruvianPimaPolishPortuguesePotawatomiPuebloPuerto RicanPuget Sound SalishRomanianRussianSalvadoranSamoanScandinavianScotch-IrishScottishSeminoleSenegaleseSerbianShoshoneSierra LeoneanSiouxSlavicSlovakSloveneSomaliSouth AfricanSouth AmericanSouth American IndianSoviet UnionSpaniardSpanishSpanish AmericanSpanish American IndianSri LankanSubsaharan AfricanSudaneseSwedishSwissSyrianTaiwaneseThaiTlingit-HaidaTohono O'OdhamTonganTrinidadian and TobagonianTsimshianTurkishU.S. Virgin IslanderUgandanUkrainianUruguayanUteVenezuelanVietnameseWelshWest IndianYakamaYaquiYugoslavianYumanYup'ikZimbabwean
Immigrant Origin (Total)
AfghanistanAfricaAlbaniaArgentinaArmeniaAsiaAustraliaAustriaAzoresBahamasBangladeshBarbadosBelarusBelgiumBelizeBoliviaBosnia and HerzegovinaBrazilBulgariaBurma / MyanmarCabo VerdeCambodiaCameroonCanadaCaribbeanCentral AmericaChileChinaColombiaCongoCosta RicaCroatiaCubaCzechoslovakiaDenmarkDominicaDominican RepublicEastern AfricaEastern AsiaEastern EuropeEcuadorEgyptEl SalvadorEnglandEritreaEthiopiaEuropeFijiFranceGermanyGhanaGreeceGrenadaGuatemalaGuyanaHaitiHondurasHong KongHungaryIndiaIndonesiaIranIraqIrelandIsraelItalyJamaicaJapanJordanKazakhstanKenyaKoreaKuwaitLaosLatin AmericaLatviaLebanonLiberiaLithuaniaMalaysiaMexicoMicronesiaMiddle AfricaMoldovaMoroccoNepalNetherlandsNicaraguaNigeriaNorth MacedoniaNorthern AfricaNorthern EuropeNorwayOceaniaPakistanPanamaPeruPhilippinesPolandPortugalRomaniaRussiaSaudi ArabiaScotlandSenegalSerbiaSierra LeoneSingaporeSomaliaSouth AfricaSouth AmericaSouth Central AsiaSouth Eastern AsiaSouthern EuropeSpainSri LankaSt. Vincent and the GrenadinesSudanSwedenSwitzerlandSyriaTaiwanThailandTrinidad and TobagoTurkeyUgandaUkraineUruguayUzbekistanVenezuelaVietnamWest IndiesWestern AfricaWestern AsiaWestern EuropeYemenZaireZimbabwe
Immigrant Origin (Percentage)
AfghanistanAfricaAlbaniaArgentinaArmeniaAsiaAustraliaAustriaAzoresBahamasBangladeshBarbadosBelarusBelgiumBelizeBoliviaBosnia and HerzegovinaBrazilBulgariaBurma / MyanmarCabo VerdeCambodiaCameroonCanadaCaribbeanCentral AmericaChileChinaColombiaCongoCosta RicaCroatiaCubaCzechoslovakiaDenmarkDominicaDominican RepublicEastern AfricaEastern AsiaEastern EuropeEcuadorEgyptEl SalvadorEnglandEritreaEthiopiaEuropeFijiFranceGermanyGhanaGreeceGrenadaGuatemalaGuyanaHaitiHondurasHong KongHungaryIndiaIndonesiaIranIraqIrelandIsraelItalyJamaicaJapanJordanKazakhstanKenyaKoreaKuwaitLaosLatin AmericaLatviaLebanonLiberiaLithuaniaMalaysiaMexicoMicronesiaMiddle AfricaMoldovaMoroccoNepalNetherlandsNicaraguaNigeriaNorth MacedoniaNorthern AfricaNorthern EuropeNorwayOceaniaPakistanPanamaPeruPhilippinesPolandPortugalRomaniaRussiaSaudi ArabiaScotlandSenegalSerbiaSierra LeoneSingaporeSomaliaSouth AfricaSouth AmericaSouth Central AsiaSouth Eastern AsiaSouthern EuropeSpainSri LankaSt. Vincent and the GrenadinesSudanSwedenSwitzerlandSyriaTaiwanThailandTrinidad and TobagoTurkeyUgandaUkraineUruguayUzbekistanVenezuelaVietnamWest IndiesWestern AfricaWestern AsiaWestern EuropeYemenZaireZimbabwe
Income
Income (Families)
Income (Households)
Poverty
Poverty (Families)
Unemployment
Employment Occupations
Employment Industries
Employer Class
Commute Time
Commute Means
School Enrollment
Education by Degree Field
Occupancy
Finances
Physical Characteristics
Maryland
Compare Cities
Comparison Subject

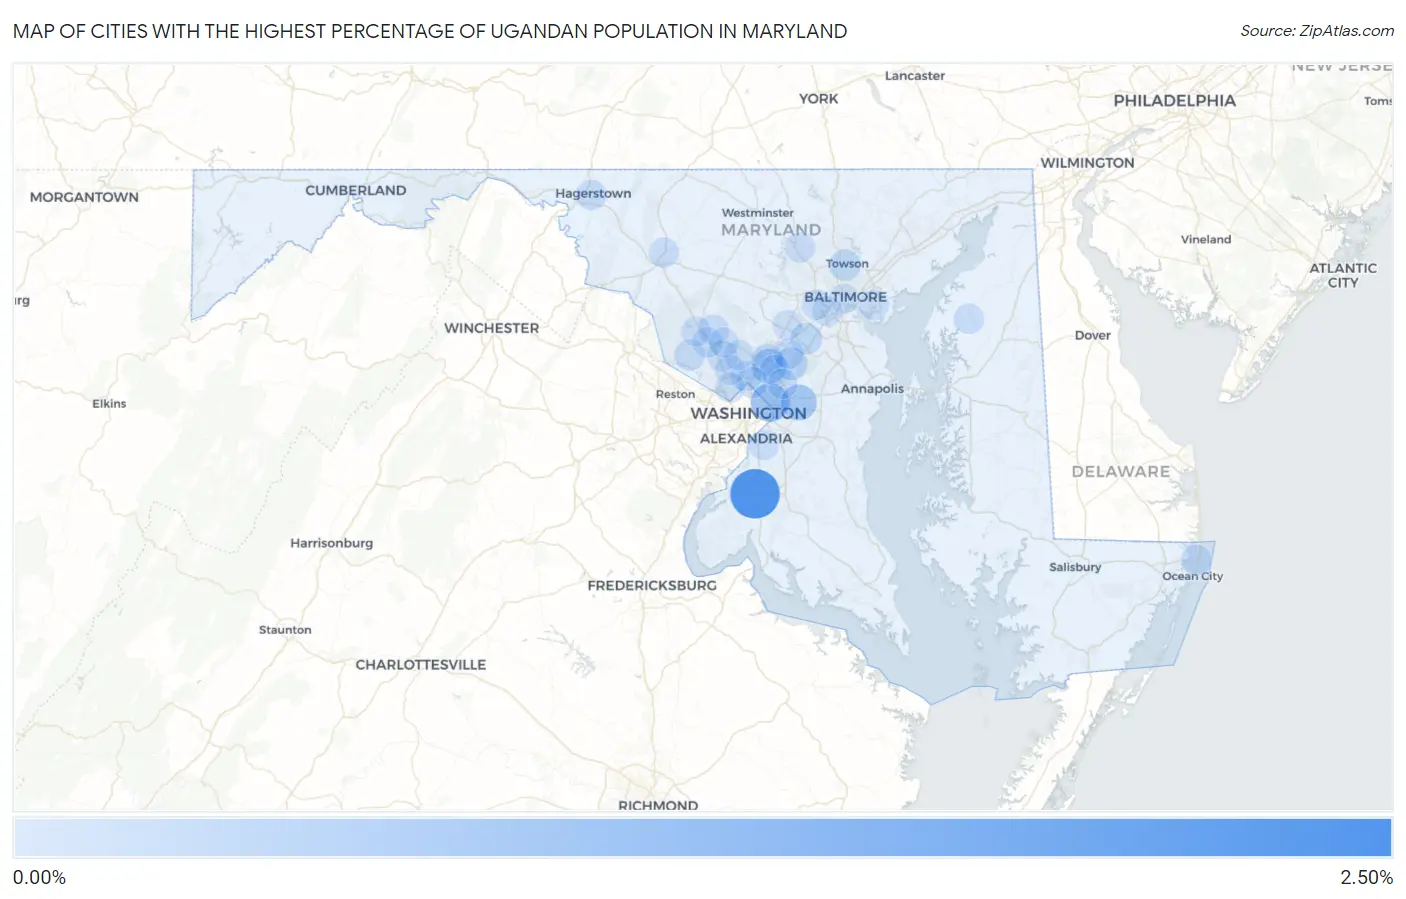
Map of Cities with the Highest Percentage of Ugandan Population in Maryland

0.00%
2.50%
Cities with the Highest Percentage of Ugandan Population in Maryland Map

Cities with the Highest Percentage of Ugandan Population in Maryland

City Ugandan vs State vs National
1.Maryland Park2.42%0.019%(+2.41)#10.0076%(+2.42)#9
2.Bensville2.36%0.019%(+2.34)#20.0076%(+2.35)#10
3.Colmar Manor0.99%0.019%(+0.970)#30.0076%(+0.982)#22
4.Mitchellville0.69%0.019%(+0.675)#40.0076%(+0.686)#34
5.Calverton0.56%0.019%(+0.543)#50.0076%(+0.554)#44
6.South Laurel0.25%0.019%(+0.231)#60.0076%(+0.242)#86
7.Fairland0.21%0.019%(+0.193)#70.0076%(+0.204)#99
8.Jessup0.20%0.019%(+0.179)#80.0076%(+0.190)#104
9.Towson0.18%0.019%(+0.161)#90.0076%(+0.173)#110
10.Silver Spring0.13%0.019%(+0.107)#100.0076%(+0.118)#127
11.Darnestown0.090%0.019%(+0.071)#110.0076%(+0.082)#151
12.Rockville0.069%0.019%(+0.049)#120.0076%(+0.061)#174
13.Ocean City0.058%0.019%(+0.039)#130.0076%(+0.051)#187
14.Beltsville0.051%0.019%(+0.032)#140.0076%(+0.043)#201
15.Laurel0.041%0.019%(+0.022)#150.0076%(+0.033)#221
16.Chestertown0.036%0.019%(+0.017)#160.0076%(+0.029)#228
17.Hagerstown0.035%0.019%(+0.016)#170.0076%(+0.027)#231
18.Montgomery Village0.032%0.019%(+0.013)#180.0076%(+0.024)#241
19.Forest Glen0.029%0.019%(+0.010)#190.0076%(+0.022)#250
20.Reisterstown0.029%0.019%(+0.010)#200.0076%(+0.021)#252
21.Gaithersburg0.026%0.019%(+0.007)#210.0076%(+0.018)#262
22.Greenbelt0.024%0.019%(+0.005)#220.0076%(+0.017)#271
23.Frederick0.024%0.019%(+0.005)#230.0076%(+0.017)#272
24.Columbia0.021%0.019%(+0.002)#240.0076%(+0.013)#281
25.Aspen Hill0.020%0.019%(+0.001)#250.0076%(+0.013)#284
26.Germantown0.019%0.019%(-0.000)#260.0076%(+0.011)#288
27.Bethesda0.015%0.019%(-0.004)#270.0076%(+0.007)#308
28.Arbutus0.015%0.019%(-0.004)#280.0076%(+0.007)#310
29.Baltimore0.0063%0.019%(-0.013)#290.0076%(-0.001)#364
30.North Bethesda0.0060%0.019%(-0.013)#300.0076%(-0.002)#366
31.Redland0.0055%0.019%(-0.014)#310.0076%(-0.002)#377
32.Oxon Hill0.0054%0.019%(-0.014)#320.0076%(-0.002)#378
33.Dundalk0.0030%0.019%(-0.016)#330.0076%(-0.005)#401
34.Catonsville0.0023%0.019%(-0.017)#340.0076%(-0.005)#405

Common Questions

What are the Top 10 Cities with the Highest Percentage of Ugandan Population in Maryland?
Top 10 Cities with the Highest Percentage of Ugandan Population in Maryland are:
#1
2.36%
#2
0.99%
#3
0.69%
#4
0.56%
#5
0.25%
#6
0.21%
#7
0.20%
#8
0.18%
#9
0.13%
#10
0.090%
What city has the Highest Percentage of Ugandan Population in Maryland?
Bensville has the Highest Percentage of Ugandan Population in Maryland with 2.36%.
What is the Percentage of Ugandan Population in the State of Maryland?
Percentage of Ugandan Population in Maryland is 0.019%.
What is the Percentage of Ugandan Population in the United States?
Percentage of Ugandan Population in the United States is 0.0076%.