Cities with the Highest Percentage of Dominican Population in Maryland
RELATED REPORTS & OPTIONS
Dominican
Maryland
Compare Cities
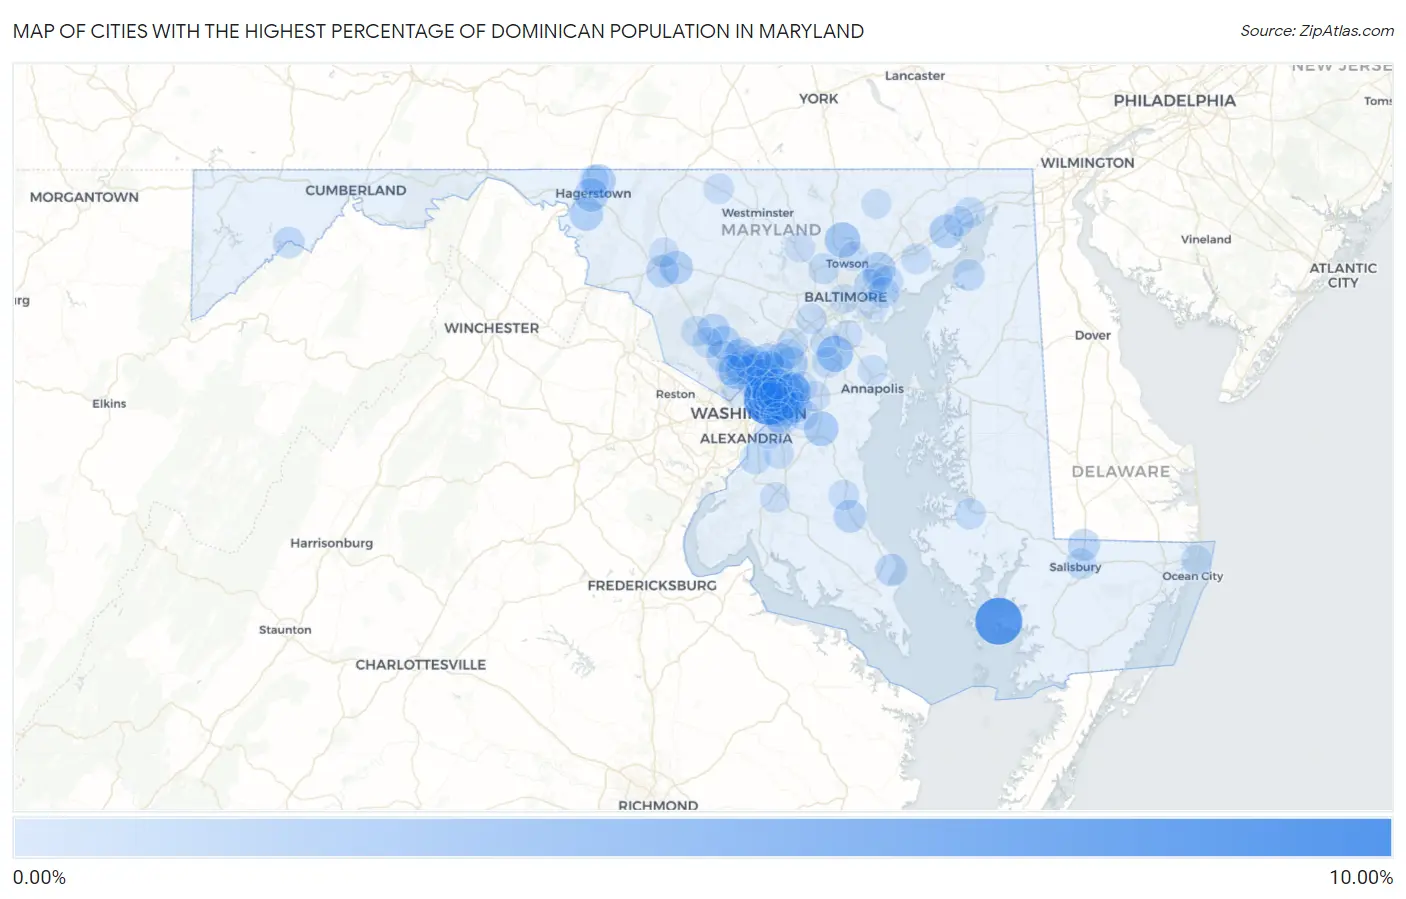
Map of Cities with the Highest Percentage of Dominican Population in Maryland
0.00%
10.00%
Cities with the Highest Percentage of Dominican Population in Maryland
| City | Dominican | vs State | vs National | |
| 1. | Cottage City | 9.42% | 0.46%(+8.96)#1 | 0.68%(+8.73)#85 |
| 2. | Chance | 8.24% | 0.46%(+7.78)#2 | 0.68%(+7.55)#105 |
| 3. | New Carrollton | 3.76% | 0.46%(+3.30)#3 | 0.68%(+3.08)#326 |
| 4. | Chillum | 3.51% | 0.46%(+3.05)#4 | 0.68%(+2.82)#361 |
| 5. | Lanham | 3.28% | 0.46%(+2.82)#5 | 0.68%(+2.59)#405 |
| 6. | Gambrills | 3.09% | 0.46%(+2.63)#6 | 0.68%(+2.40)#425 |
| 7. | Summerfield | 2.87% | 0.46%(+2.41)#7 | 0.68%(+2.18)#466 |
| 8. | White Oak | 2.80% | 0.46%(+2.34)#8 | 0.68%(+2.11)#480 |
| 9. | Cockeysville | 2.76% | 0.46%(+2.30)#9 | 0.68%(+2.08)#486 |
| 10. | Mount Rainier | 2.74% | 0.46%(+2.28)#10 | 0.68%(+2.05)#493 |
| 11. | Garrett Park | 2.70% | 0.46%(+2.24)#11 | 0.68%(+2.01)#500 |
| 12. | East Riverdale | 2.62% | 0.46%(+2.16)#12 | 0.68%(+1.94)#521 |
| 13. | Beltsville | 2.43% | 0.46%(+1.97)#13 | 0.68%(+1.75)#584 |
| 14. | Marlboro Meadows | 2.37% | 0.46%(+1.91)#14 | 0.68%(+1.68)#603 |
| 15. | Paramount Long Meadow | 2.11% | 0.46%(+1.65)#15 | 0.68%(+1.43)#675 |
| 16. | St James | 2.09% | 0.46%(+1.64)#16 | 0.68%(+1.41)#684 |
| 17. | Landover | 2.05% | 0.46%(+1.59)#17 | 0.68%(+1.37)#694 |
| 18. | Aberdeen | 2.04% | 0.46%(+1.58)#18 | 0.68%(+1.36)#697 |
| 19. | Hagerstown | 1.99% | 0.46%(+1.53)#19 | 0.68%(+1.30)#713 |
| 20. | Redland | 1.96% | 0.46%(+1.50)#20 | 0.68%(+1.27)#725 |
| 21. | Bartonsville | 1.90% | 0.46%(+1.44)#21 | 0.68%(+1.21)#751 |
| 22. | White Marsh | 1.88% | 0.46%(+1.42)#22 | 0.68%(+1.19)#761 |
| 23. | South Laurel | 1.87% | 0.46%(+1.41)#23 | 0.68%(+1.19)#763 |
| 24. | Seabrook | 1.83% | 0.46%(+1.37)#24 | 0.68%(+1.15)#778 |
| 25. | Fairland | 1.82% | 0.46%(+1.36)#25 | 0.68%(+1.13)#789 |
| 26. | Wheaton | 1.70% | 0.46%(+1.24)#26 | 0.68%(+1.01)#845 |
| 27. | Prince Frederick | 1.61% | 0.46%(+1.15)#27 | 0.68%(+0.921)#878 |
| 28. | North Brentwood | 1.57% | 0.46%(+1.11)#28 | 0.68%(+0.882)#900 |
| 29. | Bladensburg | 1.51% | 0.46%(+1.06)#29 | 0.68%(+0.830)#932 |
| 30. | Adelphi | 1.50% | 0.46%(+1.05)#30 | 0.68%(+0.820)#935 |
| 31. | Ballenger Creek | 1.50% | 0.46%(+1.05)#31 | 0.68%(+0.820)#937 |
| 32. | Walker Mill | 1.45% | 0.46%(+0.996)#32 | 0.68%(+0.769)#967 |
| 33. | Montgomery Village | 1.45% | 0.46%(+0.995)#33 | 0.68%(+0.769)#969 |
| 34. | Woodlawn Cdp Prince George S County | 1.42% | 0.46%(+0.965)#34 | 0.68%(+0.739)#982 |
| 35. | Glenmont | 1.39% | 0.46%(+0.936)#35 | 0.68%(+0.710)#1,002 |
| 36. | Brentwood | 1.37% | 0.46%(+0.917)#36 | 0.68%(+0.690)#1,007 |
| 37. | Landover Hills | 1.37% | 0.46%(+0.911)#37 | 0.68%(+0.684)#1,016 |
| 38. | Kemp Mill | 1.35% | 0.46%(+0.896)#38 | 0.68%(+0.670)#1,028 |
| 39. | Chesapeake Ranch Estates | 1.33% | 0.46%(+0.870)#39 | 0.68%(+0.643)#1,047 |
| 40. | Delmar | 1.31% | 0.46%(+0.850)#40 | 0.68%(+0.624)#1,064 |
| 41. | Hillandale | 1.22% | 0.46%(+0.761)#41 | 0.68%(+0.535)#1,120 |
| 42. | Rockville | 1.22% | 0.46%(+0.760)#42 | 0.68%(+0.534)#1,121 |
| 43. | Ten Mile Creek | 1.21% | 0.46%(+0.753)#43 | 0.68%(+0.526)#1,124 |
| 44. | Rosedale | 1.17% | 0.46%(+0.708)#44 | 0.68%(+0.482)#1,160 |
| 45. | Betterton | 1.10% | 0.46%(+0.644)#45 | 0.68%(+0.417)#1,203 |
| 46. | Fairmount Heights | 1.07% | 0.46%(+0.615)#46 | 0.68%(+0.389)#1,224 |
| 47. | Luke | 1.06% | 0.46%(+0.605)#47 | 0.68%(+0.379)#1,230 |
| 48. | Middle River | 1.00% | 0.46%(+0.540)#48 | 0.68%(+0.313)#1,294 |
| 49. | Calverton | 0.96% | 0.46%(+0.497)#49 | 0.68%(+0.270)#1,326 |
| 50. | Fort Washington | 0.91% | 0.46%(+0.452)#50 | 0.68%(+0.225)#1,370 |
| 51. | Glenarden | 0.90% | 0.46%(+0.441)#51 | 0.68%(+0.215)#1,379 |
| 52. | Cambridge | 0.89% | 0.46%(+0.430)#52 | 0.68%(+0.204)#1,389 |
| 53. | Konterra | 0.87% | 0.46%(+0.411)#53 | 0.68%(+0.185)#1,413 |
| 54. | Essex | 0.87% | 0.46%(+0.411)#54 | 0.68%(+0.184)#1,415 |
| 55. | Silver Spring | 0.86% | 0.46%(+0.403)#55 | 0.68%(+0.177)#1,421 |
| 56. | Langley Park | 0.82% | 0.46%(+0.359)#56 | 0.68%(+0.133)#1,466 |
| 57. | Pikesville | 0.81% | 0.46%(+0.354)#57 | 0.68%(+0.128)#1,473 |
| 58. | North Laurel | 0.81% | 0.46%(+0.349)#58 | 0.68%(+0.122)#1,486 |
| 59. | Hyattsville | 0.81% | 0.46%(+0.347)#59 | 0.68%(+0.121)#1,490 |
| 60. | Edmonston | 0.80% | 0.46%(+0.341)#60 | 0.68%(+0.115)#1,498 |
| 61. | Salisbury | 0.79% | 0.46%(+0.336)#61 | 0.68%(+0.110)#1,505 |
| 62. | Perryville | 0.75% | 0.46%(+0.292)#62 | 0.68%(+0.066)#1,570 |
| 63. | North Kensington | 0.71% | 0.46%(+0.250)#63 | 0.68%(+0.023)#1,608 |
| 64. | Flower Hill | 0.70% | 0.46%(+0.246)#64 | 0.68%(+0.019)#1,616 |
| 65. | Aspen Hill | 0.70% | 0.46%(+0.240)#65 | 0.68%(+0.014)#1,623 |
| 66. | Kettering | 0.69% | 0.46%(+0.234)#66 | 0.68%(+0.007)#1,629 |
| 67. | Leisure World | 0.69% | 0.46%(+0.232)#67 | 0.68%(+0.006)#1,633 |
| 68. | Ilchester | 0.69% | 0.46%(+0.230)#68 | 0.68%(+0.004)#1,637 |
| 69. | Odenton | 0.68% | 0.46%(+0.217)#69 | 0.68%(-0.010)#1,655 |
| 70. | Huntingtown | 0.67% | 0.46%(+0.214)#70 | 0.68%(-0.013)#1,662 |
| 71. | Lake Arbor | 0.66% | 0.46%(+0.206)#71 | 0.68%(-0.020)#1,673 |
| 72. | Berwyn Heights | 0.66% | 0.46%(+0.206)#72 | 0.68%(-0.020)#1,674 |
| 73. | Gaithersburg | 0.65% | 0.46%(+0.188)#73 | 0.68%(-0.039)#1,702 |
| 74. | Edgewood | 0.63% | 0.46%(+0.175)#74 | 0.68%(-0.052)#1,719 |
| 75. | Germantown | 0.60% | 0.46%(+0.146)#75 | 0.68%(-0.081)#1,768 |
| 76. | Havre De Grace | 0.59% | 0.46%(+0.132)#76 | 0.68%(-0.095)#1,785 |
| 77. | Bowie | 0.59% | 0.46%(+0.130)#77 | 0.68%(-0.096)#1,786 |
| 78. | Taneytown | 0.58% | 0.46%(+0.122)#78 | 0.68%(-0.104)#1,793 |
| 79. | Waldorf | 0.58% | 0.46%(+0.120)#79 | 0.68%(-0.106)#1,803 |
| 80. | Fountainhead Orchard Hills | 0.50% | 0.46%(+0.042)#80 | 0.68%(-0.185)#1,948 |
| 81. | Reisterstown | 0.50% | 0.46%(+0.038)#81 | 0.68%(-0.189)#1,955 |
| 82. | Clinton | 0.49% | 0.46%(+0.031)#82 | 0.68%(-0.195)#1,974 |
| 83. | Ocean City | 0.48% | 0.46%(+0.021)#83 | 0.68%(-0.205)#2,002 |
| 84. | Severn | 0.46% | 0.46%(+0.006)#84 | 0.68%(-0.221)#2,025 |
| 85. | Arnold | 0.45% | 0.46%(-0.011)#85 | 0.68%(-0.238)#2,060 |
| 86. | Laurel | 0.44% | 0.46%(-0.022)#86 | 0.68%(-0.249)#2,083 |
| 87. | Friendship Heights Village | 0.42% | 0.46%(-0.041)#87 | 0.68%(-0.268)#2,117 |
| 88. | Dundalk | 0.42% | 0.46%(-0.042)#88 | 0.68%(-0.269)#2,120 |
| 89. | Rossville | 0.41% | 0.46%(-0.046)#89 | 0.68%(-0.272)#2,128 |
| 90. | Riverdale Park | 0.41% | 0.46%(-0.047)#90 | 0.68%(-0.273)#2,132 |
| 91. | Colesville | 0.40% | 0.46%(-0.057)#91 | 0.68%(-0.283)#2,149 |
| 92. | Capitol Heights | 0.40% | 0.46%(-0.062)#92 | 0.68%(-0.288)#2,158 |
| 93. | Hampton | 0.39% | 0.46%(-0.065)#93 | 0.68%(-0.291)#2,165 |
| 94. | North Bethesda | 0.39% | 0.46%(-0.069)#94 | 0.68%(-0.295)#2,174 |
| 95. | Glen Burnie | 0.39% | 0.46%(-0.071)#95 | 0.68%(-0.297)#2,177 |
| 96. | Glenn Dale | 0.39% | 0.46%(-0.071)#96 | 0.68%(-0.298)#2,179 |
| 97. | Baltimore | 0.38% | 0.46%(-0.077)#97 | 0.68%(-0.303)#2,194 |
| 98. | Jarrettsville | 0.37% | 0.46%(-0.085)#98 | 0.68%(-0.311)#2,217 |
| 99. | Frederick | 0.37% | 0.46%(-0.086)#99 | 0.68%(-0.312)#2,219 |
| 100. | Marlow Heights | 0.37% | 0.46%(-0.091)#100 | 0.68%(-0.317)#2,233 |
Common Questions
What are the Top 10 Cities with the Highest Percentage of Dominican Population in Maryland?
Top 10 Cities with the Highest Percentage of Dominican Population in Maryland are:
#1
9.42%
#2
8.24%
#3
3.76%
#4
3.51%
#5
3.28%
#6
3.09%
#7
2.87%
#8
2.80%
#9
2.76%
#10
2.74%
What city has the Highest Percentage of Dominican Population in Maryland?
Cottage City has the Highest Percentage of Dominican Population in Maryland with 9.42%.
What is the Percentage of Dominican Population in the State of Maryland?
Percentage of Dominican Population in Maryland is 0.46%.
What is the Percentage of Dominican Population in the United States?
Percentage of Dominican Population in the United States is 0.68%.