Cities with the Highest Percentage of Dominican Population in Virginia
RELATED REPORTS & OPTIONS
Dominican
Virginia
Compare Cities
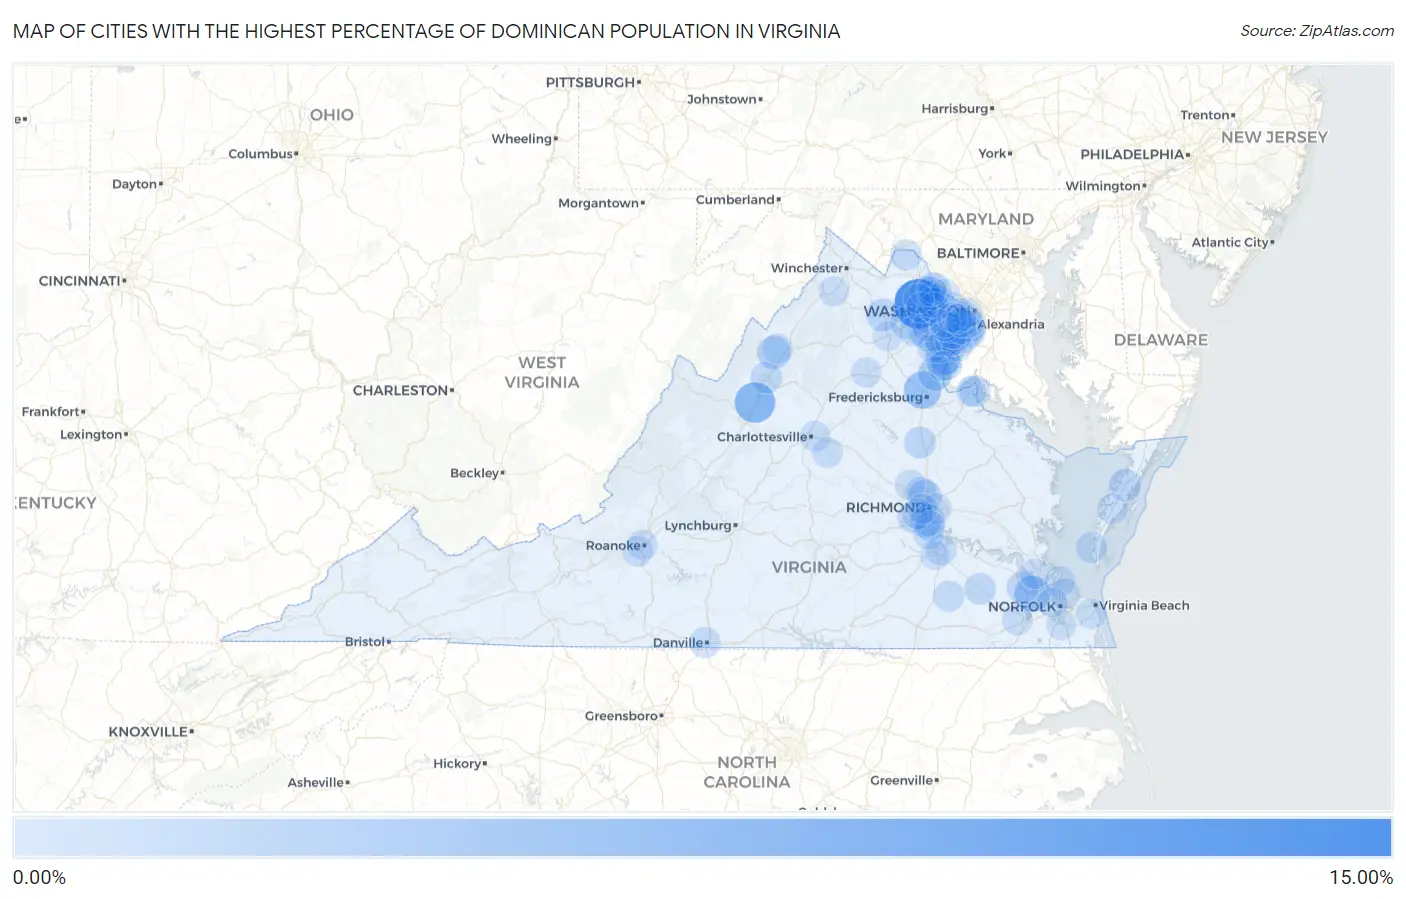
Map of Cities with the Highest Percentage of Dominican Population in Virginia
0.00%
15.00%
Cities with the Highest Percentage of Dominican Population in Virginia
| City | Dominican | vs State | vs National | |
| 1. | Arcola | 11.86% | 0.20%(+11.7)#1 | 0.68%(+11.2)#57 |
| 2. | Mount Sidney | 6.26% | 0.20%(+6.07)#2 | 0.68%(+5.58)#164 |
| 3. | Southern Gateway | 4.43% | 0.20%(+4.23)#3 | 0.68%(+3.74)#264 |
| 4. | Carrollton | 3.57% | 0.20%(+3.38)#4 | 0.68%(+2.89)#350 |
| 5. | Dumfries | 2.63% | 0.20%(+2.44)#5 | 0.68%(+1.95)#518 |
| 6. | Camp Barrett | 2.39% | 0.20%(+2.19)#6 | 0.68%(+1.71)#597 |
| 7. | Aquia Harbour | 2.30% | 0.20%(+2.11)#7 | 0.68%(+1.62)#621 |
| 8. | Broadway | 2.13% | 0.20%(+1.94)#8 | 0.68%(+1.45)#668 |
| 9. | Lakeside | 1.95% | 0.20%(+1.76)#9 | 0.68%(+1.27)#726 |
| 10. | Moorefield | 1.62% | 0.20%(+1.42)#10 | 0.68%(+0.936)#873 |
| 11. | Marshall | 1.55% | 0.20%(+1.35)#11 | 0.68%(+0.865)#907 |
| 12. | Onley | 1.37% | 0.20%(+1.17)#12 | 0.68%(+0.687)#1,012 |
| 13. | Buckhall | 1.31% | 0.20%(+1.12)#13 | 0.68%(+0.629)#1,058 |
| 14. | Bensley | 1.29% | 0.20%(+1.10)#14 | 0.68%(+0.608)#1,076 |
| 15. | Lake Caroline | 1.21% | 0.20%(+1.01)#15 | 0.68%(+0.522)#1,130 |
| 16. | Cherry Hill | 1.16% | 0.20%(+0.958)#16 | 0.68%(+0.471)#1,168 |
| 17. | Haymarket | 1.15% | 0.20%(+0.947)#17 | 0.68%(+0.460)#1,180 |
| 18. | Fort Belvoir | 1.13% | 0.20%(+0.928)#18 | 0.68%(+0.441)#1,189 |
| 19. | Smithfield | 1.12% | 0.20%(+0.927)#19 | 0.68%(+0.440)#1,191 |
| 20. | Harrisonburg | 1.07% | 0.20%(+0.876)#20 | 0.68%(+0.389)#1,225 |
| 21. | Wakefield | 1.01% | 0.20%(+0.813)#21 | 0.68%(+0.326)#1,281 |
| 22. | Dahlgren Center | 0.97% | 0.20%(+0.770)#22 | 0.68%(+0.283)#1,316 |
| 23. | Reston | 0.91% | 0.20%(+0.717)#23 | 0.68%(+0.230)#1,364 |
| 24. | Lovettsville | 0.75% | 0.20%(+0.552)#24 | 0.68%(+0.065)#1,571 |
| 25. | Woodlawn Cdp Fairfax County | 0.74% | 0.20%(+0.538)#25 | 0.68%(+0.051)#1,584 |
| 26. | Danville | 0.71% | 0.20%(+0.515)#26 | 0.68%(+0.028)#1,604 |
| 27. | Sussex | 0.69% | 0.20%(+0.492)#27 | 0.68%(+0.005)#1,635 |
| 28. | Cascades | 0.68% | 0.20%(+0.480)#28 | 0.68%(-0.007)#1,649 |
| 29. | Cape Charles | 0.68% | 0.20%(+0.478)#29 | 0.68%(-0.008)#1,652 |
| 30. | Chester | 0.65% | 0.20%(+0.457)#30 | 0.68%(-0.030)#1,684 |
| 31. | Laurel | 0.62% | 0.20%(+0.419)#31 | 0.68%(-0.068)#1,748 |
| 32. | Groveton | 0.61% | 0.20%(+0.411)#32 | 0.68%(-0.076)#1,760 |
| 33. | Dale City | 0.60% | 0.20%(+0.404)#33 | 0.68%(-0.083)#1,771 |
| 34. | Meadowbrook | 0.60% | 0.20%(+0.401)#34 | 0.68%(-0.086)#1,775 |
| 35. | Manassas | 0.58% | 0.20%(+0.382)#35 | 0.68%(-0.105)#1,797 |
| 36. | Timberville | 0.57% | 0.20%(+0.375)#36 | 0.68%(-0.112)#1,809 |
| 37. | Seven Corners | 0.57% | 0.20%(+0.371)#37 | 0.68%(-0.116)#1,820 |
| 38. | Yorkshire | 0.56% | 0.20%(+0.361)#38 | 0.68%(-0.126)#1,838 |
| 39. | Quantico | 0.55% | 0.20%(+0.355)#39 | 0.68%(-0.132)#1,849 |
| 40. | Suffolk | 0.52% | 0.20%(+0.322)#40 | 0.68%(-0.165)#1,912 |
| 41. | Lake Ridge | 0.51% | 0.20%(+0.308)#41 | 0.68%(-0.179)#1,942 |
| 42. | Huntington | 0.50% | 0.20%(+0.298)#42 | 0.68%(-0.189)#1,956 |
| 43. | Fort Lee | 0.49% | 0.20%(+0.291)#43 | 0.68%(-0.196)#1,976 |
| 44. | Hybla Valley | 0.48% | 0.20%(+0.283)#44 | 0.68%(-0.204)#1,999 |
| 45. | Montrose | 0.48% | 0.20%(+0.281)#45 | 0.68%(-0.206)#2,004 |
| 46. | Rockwood | 0.47% | 0.20%(+0.273)#46 | 0.68%(-0.214)#2,017 |
| 47. | Pantops | 0.45% | 0.20%(+0.256)#47 | 0.68%(-0.231)#2,044 |
| 48. | Lake Monticello | 0.45% | 0.20%(+0.254)#48 | 0.68%(-0.232)#2,045 |
| 49. | County Center | 0.45% | 0.20%(+0.250)#49 | 0.68%(-0.237)#2,059 |
| 50. | Herndon | 0.44% | 0.20%(+0.244)#50 | 0.68%(-0.243)#2,067 |
| 51. | Norfolk | 0.44% | 0.20%(+0.241)#51 | 0.68%(-0.246)#2,073 |
| 52. | Wyndham | 0.44% | 0.20%(+0.240)#52 | 0.68%(-0.247)#2,078 |
| 53. | Newington | 0.43% | 0.20%(+0.230)#53 | 0.68%(-0.257)#2,102 |
| 54. | Manchester | 0.43% | 0.20%(+0.230)#54 | 0.68%(-0.257)#2,103 |
| 55. | Cave Spring | 0.43% | 0.20%(+0.229)#55 | 0.68%(-0.258)#2,104 |
| 56. | Burke | 0.40% | 0.20%(+0.202)#56 | 0.68%(-0.285)#2,153 |
| 57. | Hampton | 0.39% | 0.20%(+0.196)#57 | 0.68%(-0.290)#2,162 |
| 58. | West Springfield | 0.37% | 0.20%(+0.174)#58 | 0.68%(-0.312)#2,220 |
| 59. | Dahlgren | 0.34% | 0.20%(+0.143)#59 | 0.68%(-0.344)#2,300 |
| 60. | Leesylvania | 0.33% | 0.20%(+0.128)#60 | 0.68%(-0.359)#2,340 |
| 61. | Independent Hill | 0.32% | 0.20%(+0.127)#61 | 0.68%(-0.360)#2,342 |
| 62. | Bellwood | 0.32% | 0.20%(+0.123)#62 | 0.68%(-0.364)#2,349 |
| 63. | Middletown | 0.32% | 0.20%(+0.123)#63 | 0.68%(-0.364)#2,351 |
| 64. | Lorton | 0.31% | 0.20%(+0.115)#64 | 0.68%(-0.372)#2,376 |
| 65. | Mason Neck | 0.31% | 0.20%(+0.113)#65 | 0.68%(-0.374)#2,386 |
| 66. | Roanoke | 0.30% | 0.20%(+0.106)#66 | 0.68%(-0.381)#2,412 |
| 67. | Centreville | 0.30% | 0.20%(+0.101)#67 | 0.68%(-0.386)#2,427 |
| 68. | Culpeper | 0.29% | 0.20%(+0.096)#68 | 0.68%(-0.391)#2,445 |
| 69. | Sterling | 0.29% | 0.20%(+0.095)#69 | 0.68%(-0.392)#2,447 |
| 70. | Mcnair | 0.29% | 0.20%(+0.091)#70 | 0.68%(-0.396)#2,462 |
| 71. | Exmore | 0.29% | 0.20%(+0.089)#71 | 0.68%(-0.398)#2,468 |
| 72. | Occoquan | 0.28% | 0.20%(+0.082)#72 | 0.68%(-0.405)#2,497 |
| 73. | Franconia | 0.26% | 0.20%(+0.065)#73 | 0.68%(-0.422)#2,559 |
| 74. | Newington Forest | 0.26% | 0.20%(+0.063)#74 | 0.68%(-0.424)#2,563 |
| 75. | Virginia Beach | 0.25% | 0.20%(+0.048)#75 | 0.68%(-0.439)#2,612 |
| 76. | Newport News | 0.24% | 0.20%(+0.047)#76 | 0.68%(-0.440)#2,613 |
| 77. | Alexandria | 0.23% | 0.20%(+0.027)#77 | 0.68%(-0.459)#2,677 |
| 78. | Chesapeake | 0.22% | 0.20%(+0.018)#78 | 0.68%(-0.469)#2,717 |
| 79. | Burke Centre | 0.21% | 0.20%(+0.014)#79 | 0.68%(-0.473)#2,731 |
| 80. | Arlington | 0.20% | 0.20%(+0.007)#80 | 0.68%(-0.480)#2,747 |
| 81. | Quantico Base | 0.20% | 0.20%(+0.007)#81 | 0.68%(-0.480)#2,748 |
| 82. | Tysons | 0.20% | 0.20%(+0.001)#82 | 0.68%(-0.486)#2,775 |
| 83. | Richmond | 0.18% | 0.20%(-0.019)#83 | 0.68%(-0.506)#2,856 |
| 84. | Ashburn | 0.18% | 0.20%(-0.022)#84 | 0.68%(-0.509)#2,865 |
| 85. | Warrenton | 0.17% | 0.20%(-0.030)#85 | 0.68%(-0.517)#2,899 |
| 86. | Countryside | 0.17% | 0.20%(-0.032)#86 | 0.68%(-0.519)#2,907 |
| 87. | Portsmouth | 0.16% | 0.20%(-0.036)#87 | 0.68%(-0.522)#2,923 |
| 88. | Lake Barcroft | 0.16% | 0.20%(-0.037)#88 | 0.68%(-0.524)#2,936 |
| 89. | Kings Park West | 0.16% | 0.20%(-0.039)#89 | 0.68%(-0.526)#2,949 |
| 90. | Linton Hall | 0.15% | 0.20%(-0.050)#90 | 0.68%(-0.537)#2,992 |
| 91. | Franklin Farm | 0.14% | 0.20%(-0.055)#91 | 0.68%(-0.542)#3,022 |
| 92. | Great Falls | 0.13% | 0.20%(-0.064)#92 | 0.68%(-0.551)#3,076 |
| 93. | Rose Hill Cdp Fairfax County | 0.13% | 0.20%(-0.070)#93 | 0.68%(-0.557)#3,107 |
| 94. | South Riding | 0.13% | 0.20%(-0.072)#94 | 0.68%(-0.559)#3,118 |
| 95. | Woodburn | 0.12% | 0.20%(-0.077)#95 | 0.68%(-0.564)#3,144 |
| 96. | Dulles Town Center | 0.12% | 0.20%(-0.079)#96 | 0.68%(-0.566)#3,153 |
| 97. | Brambleton | 0.12% | 0.20%(-0.079)#97 | 0.68%(-0.566)#3,162 |
| 98. | Petersburg | 0.12% | 0.20%(-0.081)#98 | 0.68%(-0.567)#3,168 |
| 99. | Lincolnia | 0.11% | 0.20%(-0.087)#99 | 0.68%(-0.574)#3,199 |
| 100. | Annandale | 0.11% | 0.20%(-0.087)#100 | 0.68%(-0.574)#3,200 |
Common Questions
What are the Top 10 Cities with the Highest Percentage of Dominican Population in Virginia?
Top 10 Cities with the Highest Percentage of Dominican Population in Virginia are:
#1
11.86%
#2
6.26%
#3
4.43%
#4
3.57%
#5
2.63%
#6
2.30%
#7
2.13%
#8
1.95%
#9
1.55%
#10
1.37%
What city has the Highest Percentage of Dominican Population in Virginia?
Arcola has the Highest Percentage of Dominican Population in Virginia with 11.86%.
What is the Percentage of Dominican Population in the State of Virginia?
Percentage of Dominican Population in Virginia is 0.20%.
What is the Percentage of Dominican Population in the United States?
Percentage of Dominican Population in the United States is 0.68%.