Cities with the Highest Percentage of Dominican Population in the United States
RELATED REPORTS & OPTIONS
Dominican
United States
Compare Cities
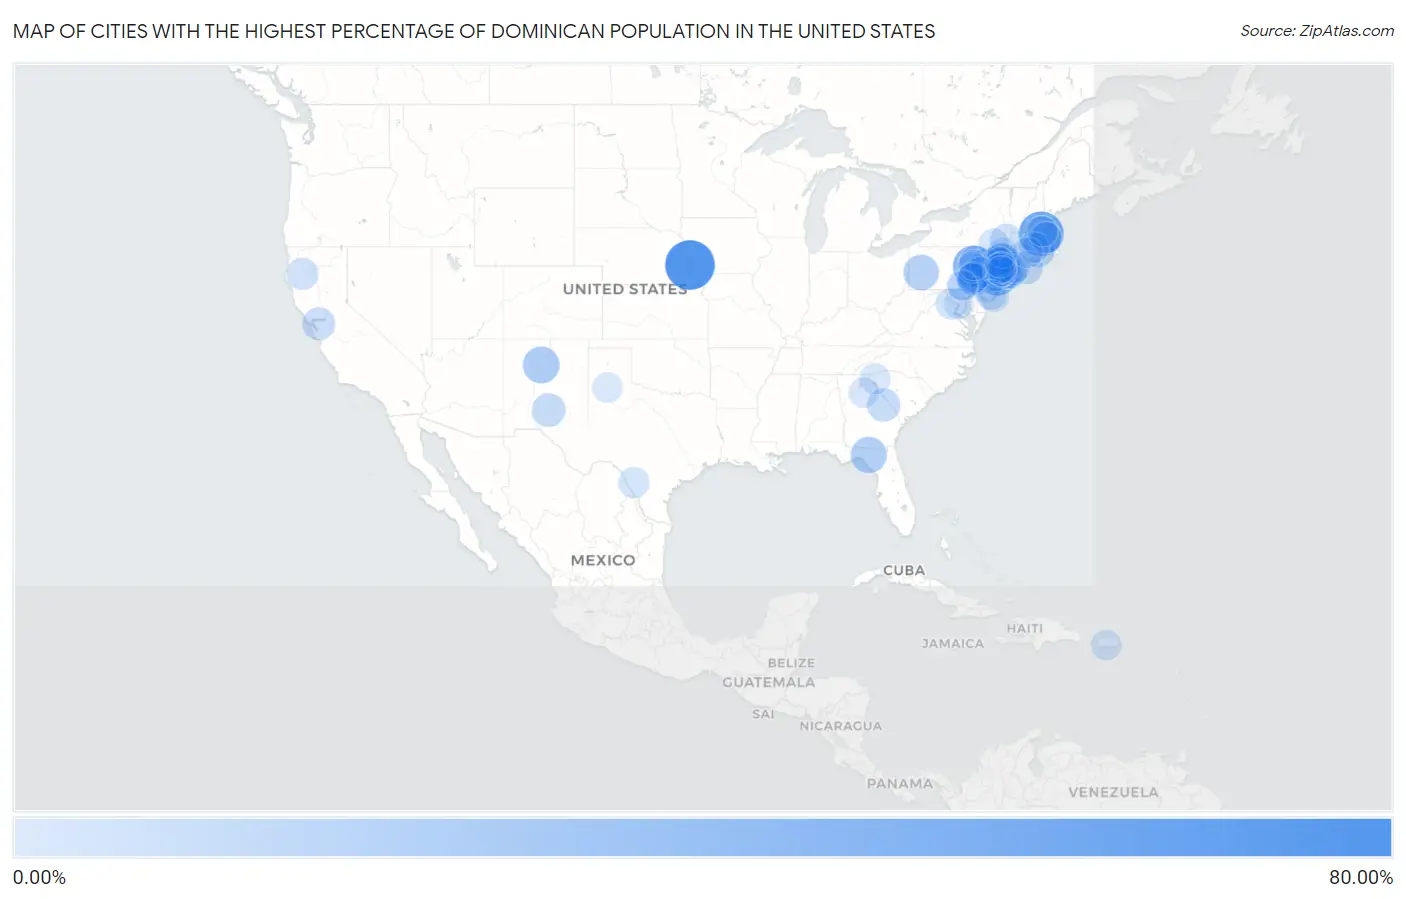
Map of Cities with the Highest Percentage of Dominican Population in the United States
0.00%
80.00%
Cities with the Highest Percentage of Dominican Population in the United States
| City | Dominican | vs State | vs National | |
| 1. | La Platte | 67.55% | 0.062%(+67.5)#1 | 0.68%(+66.9)#1 |
| 2. | Lawrence | 52.39% | 2.49%(+49.9)#1 | 0.68%(+51.7)#2 |
| 3. | West Hazleton Borough | 42.63% | 1.21%(+41.4)#1 | 0.68%(+41.9)#3 |
| 4. | Hazleton | 42.59% | 1.21%(+41.4)#2 | 0.68%(+41.9)#4 |
| 5. | Perth Amboy | 40.92% | 3.84%(+37.1)#1 | 0.68%(+40.2)#5 |
| 6. | Valle Hill | 40.17% | 1.71%(+38.5)#1 | 0.68%(+39.5)#6 |
| 7. | Keasbey | 39.34% | 3.84%(+35.5)#2 | 0.68%(+38.7)#7 |
| 8. | Jamestown | 33.62% | 0.12%(+33.5)#1 | 0.68%(+32.9)#8 |
| 9. | Villa Hugo Ii | 33.55% | 1.71%(+31.8)#2 | 0.68%(+32.9)#9 |
| 10. | Caño Martin Peña | 32.02% | 1.71%(+30.3)#3 | 0.68%(+31.3)#10 |
| 11. | Haverstraw | 31.23% | 4.55%(+26.7)#1 | 0.68%(+30.5)#11 |
| 12. | Paterson | 29.40% | 3.84%(+25.6)#3 | 0.68%(+28.7)#12 |
| 13. | Villa Hugo I | 28.39% | 1.71%(+26.7)#4 | 0.68%(+27.7)#13 |
| 14. | Santo Domingo Pueblo | 27.71% | 0.12%(+27.6)#2 | 0.68%(+27.0)#14 |
| 15. | Day | 25.76% | 1.23%(+24.5)#1 | 0.68%(+25.1)#15 |
| 16. | East Franklin | 25.15% | 3.84%(+21.3)#4 | 0.68%(+24.5)#16 |
| 17. | Hyde Park | 24.10% | 1.21%(+22.9)#3 | 0.68%(+23.4)#17 |
| 18. | Passaic | 23.26% | 3.84%(+19.4)#5 | 0.68%(+22.6)#18 |
| 19. | Medanales | 22.94% | 0.12%(+22.8)#3 | 0.68%(+22.3)#19 |
| 20. | West Haverstraw | 22.35% | 4.55%(+17.8)#2 | 0.68%(+21.7)#20 |
| 21. | Stony Creek Mills | 20.92% | 1.21%(+19.7)#4 | 0.68%(+20.2)#21 |
| 22. | Providence | 20.79% | 5.36%(+15.4)#1 | 0.68%(+20.1)#22 |
| 23. | Bear Creek Village Borough | 20.55% | 1.21%(+19.3)#5 | 0.68%(+19.9)#23 |
| 24. | Sleepy Hollow | 19.87% | 4.55%(+15.3)#3 | 0.68%(+19.2)#24 |
| 25. | Guttenberg | 19.64% | 3.84%(+15.8)#6 | 0.68%(+19.0)#25 |
| 26. | Bogota Borough | 19.32% | 3.84%(+15.5)#7 | 0.68%(+18.6)#26 |
| 27. | Mcadoo Borough | 19.28% | 1.21%(+18.1)#6 | 0.68%(+18.6)#27 |
| 28. | Ridgefield Park | 18.98% | 3.84%(+15.1)#8 | 0.68%(+18.3)#28 |
| 29. | Volcano Golf Course | 18.27% | 0.10%(+18.2)#1 | 0.68%(+17.6)#29 |
| 30. | High Rolls | 18.13% | 0.12%(+18.0)#4 | 0.68%(+17.4)#30 |
| 31. | Campanillas | 18.08% | 1.71%(+16.4)#5 | 0.68%(+17.4)#31 |
| 32. | Union City | 17.98% | 3.84%(+14.1)#9 | 0.68%(+17.3)#32 |
| 33. | Voorhees | 17.85% | 3.84%(+14.0)#10 | 0.68%(+17.2)#33 |
| 34. | Reading | 17.66% | 1.21%(+16.5)#7 | 0.68%(+17.0)#34 |
| 35. | Sagaponack | 17.44% | 4.55%(+12.9)#4 | 0.68%(+16.8)#35 |
| 36. | Keysville | 17.12% | 0.27%(+16.9)#1 | 0.68%(+16.4)#36 |
| 37. | Allentown | 16.99% | 1.21%(+15.8)#8 | 0.68%(+16.3)#37 |
| 38. | Methuen Town | 16.60% | 2.49%(+14.1)#2 | 0.68%(+15.9)#38 |
| 39. | Diablo | 16.06% | 0.058%(+16.0)#1 | 0.68%(+15.4)#39 |
| 40. | Copiague | 15.80% | 4.55%(+11.3)#5 | 0.68%(+15.1)#40 |
| 41. | Freeport | 15.70% | 4.55%(+11.1)#6 | 0.68%(+15.0)#41 |
| 42. | Yonkers | 15.27% | 4.55%(+10.7)#7 | 0.68%(+14.6)#42 |
| 43. | West New York | 15.17% | 3.84%(+11.3)#11 | 0.68%(+14.5)#43 |
| 44. | Lynn | 14.94% | 2.49%(+12.4)#3 | 0.68%(+14.3)#44 |
| 45. | Ghent | 14.47% | 4.55%(+9.91)#8 | 0.68%(+13.8)#45 |
| 46. | Prospect Park Borough | 14.22% | 3.84%(+10.4)#12 | 0.68%(+13.5)#46 |
| 47. | Lakeview | 13.73% | 4.55%(+9.17)#9 | 0.68%(+13.0)#47 |
| 48. | New Village | 13.71% | 3.84%(+9.87)#13 | 0.68%(+13.0)#48 |
| 49. | Garfield | 13.50% | 3.84%(+9.66)#14 | 0.68%(+12.8)#49 |
| 50. | Shenandoah Borough | 13.34% | 1.21%(+12.1)#9 | 0.68%(+12.7)#50 |
| 51. | Hayfork | 13.05% | 0.058%(+13.0)#2 | 0.68%(+12.4)#51 |
| 52. | West Wyomissing | 12.58% | 1.21%(+11.4)#10 | 0.68%(+11.9)#52 |
| 53. | Camden | 12.15% | 3.84%(+8.31)#15 | 0.68%(+11.5)#53 |
| 54. | West York Borough | 12.13% | 1.21%(+10.9)#11 | 0.68%(+11.4)#54 |
| 55. | Highland Falls | 12.10% | 4.55%(+7.55)#10 | 0.68%(+11.4)#55 |
| 56. | Pleasantville | 11.93% | 3.84%(+8.09)#16 | 0.68%(+11.2)#56 |
| 57. | Arcola | 11.86% | 0.20%(+11.7)#1 | 0.68%(+11.2)#57 |
| 58. | Saw Creek | 11.77% | 1.21%(+10.6)#12 | 0.68%(+11.1)#58 |
| 59. | New Brunswick | 11.62% | 3.84%(+7.78)#17 | 0.68%(+10.9)#59 |
| 60. | Manchester Borough | 11.60% | 1.21%(+10.4)#13 | 0.68%(+10.9)#60 |
| 61. | Carrizo Springs | 11.25% | 0.11%(+11.1)#1 | 0.68%(+10.6)#61 |
| 62. | Fullerton | 11.01% | 1.21%(+9.80)#14 | 0.68%(+10.3)#62 |
| 63. | Haledon Borough | 10.98% | 3.84%(+7.14)#18 | 0.68%(+10.3)#63 |
| 64. | Lodi Borough | 10.84% | 3.84%(+7.00)#19 | 0.68%(+10.2)#64 |
| 65. | Hackensack | 10.77% | 3.84%(+6.93)#20 | 0.68%(+10.1)#65 |
| 66. | Macopin | 10.62% | 3.84%(+6.78)#21 | 0.68%(+9.94)#66 |
| 67. | Newry | 10.56% | 0.11%(+10.4)#1 | 0.68%(+9.87)#67 |
| 68. | Salem | 10.52% | 2.49%(+8.02)#4 | 0.68%(+9.83)#68 |
| 69. | Brentwood | 10.45% | 4.55%(+5.90)#11 | 0.68%(+9.76)#69 |
| 70. | Wilkes Barre | 10.29% | 1.21%(+9.08)#15 | 0.68%(+9.60)#70 |
| 71. | Pascoag | 10.27% | 5.36%(+4.91)#2 | 0.68%(+9.59)#71 |
| 72. | Terryville | 10.14% | 4.55%(+5.59)#12 | 0.68%(+9.45)#72 |
| 73. | Woodlynne Borough | 10.06% | 3.84%(+6.22)#22 | 0.68%(+9.37)#73 |
| 74. | Lincoln Park | 10.03% | 1.21%(+8.83)#16 | 0.68%(+9.35)#74 |
| 75. | Fountain Hill Borough | 10.02% | 1.21%(+8.82)#17 | 0.68%(+9.34)#75 |
| 76. | Fleischmanns | 10.00% | 4.55%(+5.45)#13 | 0.68%(+9.32)#76 |
| 77. | South Windham | 9.99% | 1.47%(+8.51)#1 | 0.68%(+9.30)#77 |
| 78. | Elmwood Park Borough | 9.71% | 3.84%(+5.87)#23 | 0.68%(+9.03)#78 |
| 79. | Elizabeth | 9.68% | 3.84%(+5.84)#24 | 0.68%(+9.00)#79 |
| 80. | Seth Ward | 9.68% | 0.11%(+9.57)#2 | 0.68%(+9.00)#80 |
| 81. | Greenwood Lake | 9.68% | 4.55%(+5.13)#14 | 0.68%(+8.99)#81 |
| 82. | Tibes | 9.66% | 1.71%(+7.95)#6 | 0.68%(+8.97)#82 |
| 83. | Bethlehem | 9.53% | 0.27%(+9.27)#2 | 0.68%(+8.85)#83 |
| 84. | Arlington | 9.48% | 4.55%(+4.93)#15 | 0.68%(+8.80)#84 |
| 85. | Cottage City | 9.42% | 0.46%(+8.96)#1 | 0.68%(+8.73)#85 |
| 86. | South Temple | 9.28% | 1.21%(+8.08)#18 | 0.68%(+8.60)#86 |
| 87. | Clifton | 9.24% | 3.84%(+5.40)#25 | 0.68%(+8.55)#87 |
| 88. | Haverhill | 9.23% | 2.49%(+6.74)#5 | 0.68%(+8.55)#88 |
| 89. | Englewood | 9.20% | 3.84%(+5.36)#26 | 0.68%(+8.52)#89 |
| 90. | York | 9.15% | 1.21%(+7.95)#19 | 0.68%(+8.47)#90 |
| 91. | Kelayres | 9.03% | 1.21%(+7.82)#20 | 0.68%(+8.35)#91 |
| 92. | Queens Gate | 8.90% | 1.21%(+7.69)#21 | 0.68%(+8.21)#92 |
| 93. | Little Ferry Borough | 8.86% | 3.84%(+5.02)#27 | 0.68%(+8.18)#93 |
| 94. | Beech Mountain Lakes | 8.76% | 1.21%(+7.56)#22 | 0.68%(+8.08)#94 |
| 95. | Sleepy Hollow Lake | 8.74% | 4.55%(+4.19)#16 | 0.68%(+8.06)#95 |
| 96. | New Hempstead | 8.66% | 4.55%(+4.11)#17 | 0.68%(+7.98)#96 |
| 97. | Mays Landing | 8.60% | 3.84%(+4.76)#28 | 0.68%(+7.92)#97 |
| 98. | Ave Maria | 8.57% | 1.23%(+7.33)#2 | 0.68%(+7.88)#98 |
| 99. | New York | 8.55% | 4.55%(+4.00)#18 | 0.68%(+7.87)#99 |
| 100. | South Toms River Borough | 8.49% | 3.84%(+4.65)#29 | 0.68%(+7.81)#100 |
Common Questions
What are the Top 10 Cities with the Highest Percentage of Dominican Population in the United States?
Top 10 Cities with the Highest Percentage of Dominican Population in the United States are:
#1
67.55%
#2
52.39%
#3
42.59%
#4
40.92%
#5
31.23%
#6
29.40%
#7
27.71%
#8
25.76%
#9
25.15%
#10
24.10%
What city has the Highest Percentage of Dominican Population in the United States?
La Platte has the Highest Percentage of Dominican Population in the United States with 67.55%.
What is the Percentage of Dominican Population in the United States?
Percentage of Dominican Population in the United States is 0.68%.