Cities with the Largest Costa Rican Community in New York
RELATED REPORTS & OPTIONS
Costa Rican
New York
Compare Cities
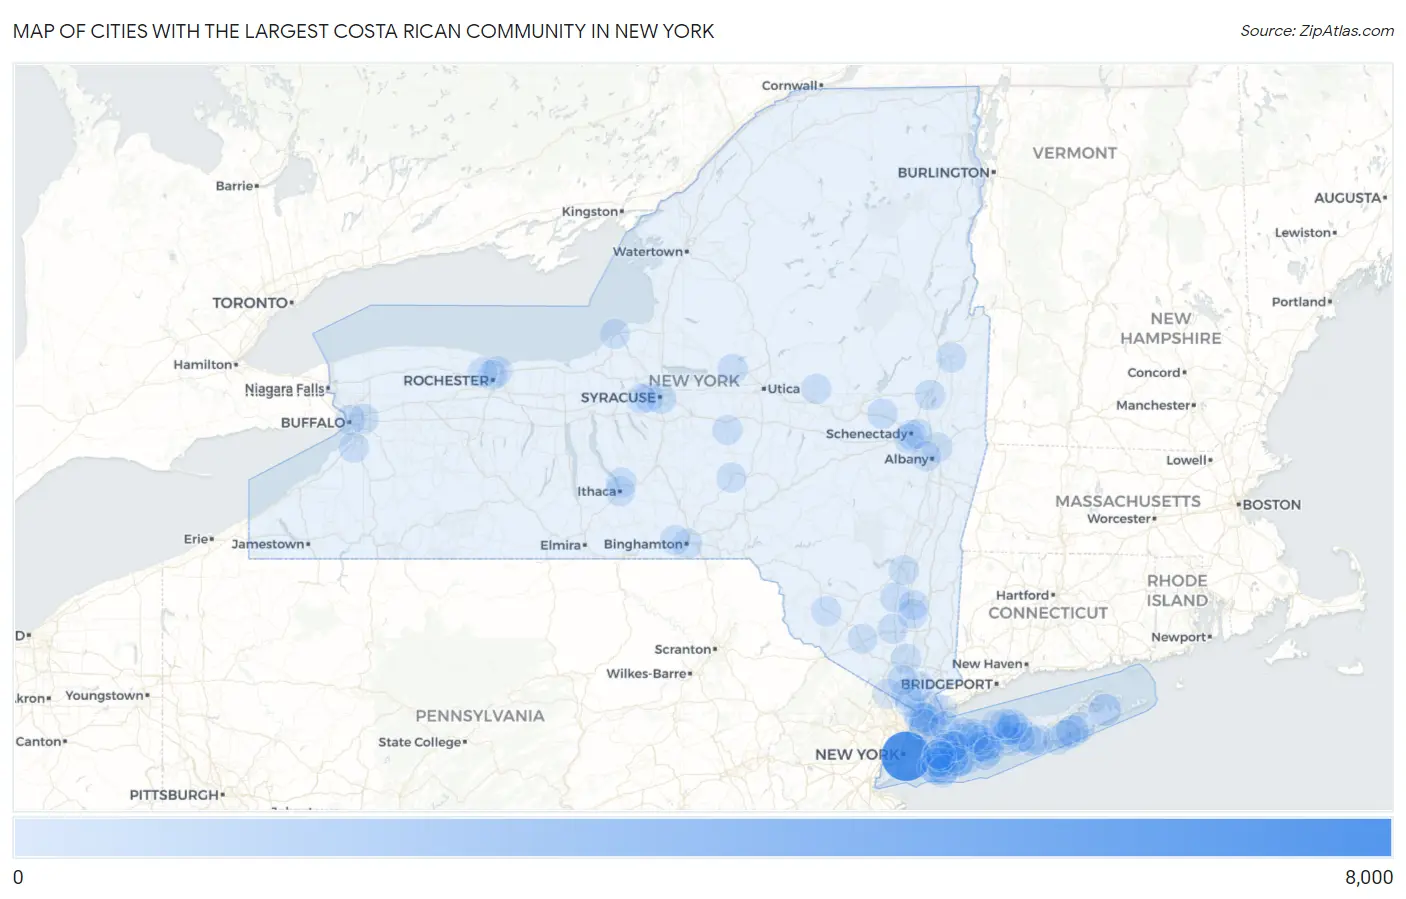
Map of Cities with the Largest Costa Rican Community in New York
0
8,000
Cities with the Largest Costa Rican Community in New York
| City | Costa Rican | vs State | vs National | |
| 1. | New York | 6,614 | 12,733(51.94%)#1 | 173,375(3.81%)#1 |
| 2. | Northwest Harbor | 706 | 12,733(5.54%)#2 | 173,375(0.41%)#18 |
| 3. | Hampton Bays | 671 | 12,733(5.27%)#3 | 173,375(0.39%)#21 |
| 4. | Brentwood | 266 | 12,733(2.09%)#4 | 173,375(0.15%)#87 |
| 5. | Selden | 183 | 12,733(1.44%)#5 | 173,375(0.11%)#159 |
| 6. | East Massapequa | 157 | 12,733(1.23%)#6 | 173,375(0.09%)#194 |
| 7. | Yonkers | 142 | 12,733(1.12%)#7 | 173,375(0.08%)#235 |
| 8. | Freeport | 134 | 12,733(1.05%)#8 | 173,375(0.08%)#255 |
| 9. | Huntington Station | 126 | 12,733(0.99%)#9 | 173,375(0.07%)#274 |
| 10. | Saratoga Springs | 108 | 12,733(0.85%)#10 | 173,375(0.06%)#326 |
| 11. | Sands Point | 106 | 12,733(0.83%)#11 | 173,375(0.06%)#333 |
| 12. | Hempstead | 104 | 12,733(0.82%)#12 | 173,375(0.06%)#339 |
| 13. | Syracuse | 86 | 12,733(0.68%)#13 | 173,375(0.05%)#404 |
| 14. | Bardonia | 81 | 12,733(0.64%)#14 | 173,375(0.05%)#435 |
| 15. | Bethpage | 78 | 12,733(0.61%)#15 | 173,375(0.04%)#454 |
| 16. | Inwood | 70 | 12,733(0.55%)#16 | 173,375(0.04%)#498 |
| 17. | Amsterdam | 68 | 12,733(0.53%)#17 | 173,375(0.04%)#507 |
| 18. | West Islip | 63 | 12,733(0.49%)#18 | 173,375(0.04%)#535 |
| 19. | Suffern | 62 | 12,733(0.49%)#19 | 173,375(0.04%)#548 |
| 20. | New Rochelle | 58 | 12,733(0.46%)#20 | 173,375(0.03%)#570 |
| 21. | Orange Lake | 58 | 12,733(0.46%)#21 | 173,375(0.03%)#575 |
| 22. | Schenectady | 57 | 12,733(0.45%)#22 | 173,375(0.03%)#579 |
| 23. | White Plains | 57 | 12,733(0.45%)#23 | 173,375(0.03%)#581 |
| 24. | Moriches | 57 | 12,733(0.45%)#24 | 173,375(0.03%)#584 |
| 25. | Loudonville | 55 | 12,733(0.43%)#25 | 173,375(0.03%)#607 |
| 26. | Baywood | 55 | 12,733(0.43%)#26 | 173,375(0.03%)#608 |
| 27. | Fort Montgomery | 54 | 12,733(0.42%)#27 | 173,375(0.03%)#616 |
| 28. | Rockville Centre | 53 | 12,733(0.42%)#28 | 173,375(0.03%)#627 |
| 29. | Commack | 49 | 12,733(0.38%)#29 | 173,375(0.03%)#665 |
| 30. | Holbrook | 49 | 12,733(0.38%)#30 | 173,375(0.03%)#666 |
| 31. | Westbury | 49 | 12,733(0.38%)#31 | 173,375(0.03%)#668 |
| 32. | Hudson Falls | 49 | 12,733(0.38%)#32 | 173,375(0.03%)#671 |
| 33. | Hicksville | 46 | 12,733(0.36%)#33 | 173,375(0.03%)#705 |
| 34. | Watervliet | 44 | 12,733(0.35%)#34 | 173,375(0.03%)#728 |
| 35. | Hastings On Hudson | 44 | 12,733(0.35%)#35 | 173,375(0.03%)#729 |
| 36. | Port Chester | 43 | 12,733(0.34%)#36 | 173,375(0.02%)#737 |
| 37. | Irondequoit | 41 | 12,733(0.32%)#37 | 173,375(0.02%)#771 |
| 38. | Rotterdam | 39 | 12,733(0.31%)#38 | 173,375(0.02%)#806 |
| 39. | Syosset | 39 | 12,733(0.31%)#39 | 173,375(0.02%)#807 |
| 40. | Monticello | 39 | 12,733(0.31%)#40 | 173,375(0.02%)#811 |
| 41. | Tuckahoe | 36 | 12,733(0.28%)#41 | 173,375(0.02%)#841 |
| 42. | Albany | 30 | 12,733(0.24%)#42 | 173,375(0.02%)#936 |
| 43. | Norwich | 29 | 12,733(0.23%)#43 | 173,375(0.02%)#959 |
| 44. | Mount Vernon | 28 | 12,733(0.22%)#44 | 173,375(0.02%)#974 |
| 45. | Yaphank | 28 | 12,733(0.22%)#45 | 173,375(0.02%)#988 |
| 46. | Rochester | 26 | 12,733(0.20%)#46 | 173,375(0.01%)#1,009 |
| 47. | New Paltz | 26 | 12,733(0.20%)#47 | 173,375(0.01%)#1,031 |
| 48. | Shirley | 24 | 12,733(0.19%)#48 | 173,375(0.01%)#1,066 |
| 49. | Albertson | 24 | 12,733(0.19%)#49 | 173,375(0.01%)#1,079 |
| 50. | Crown Heights | 24 | 12,733(0.19%)#50 | 173,375(0.01%)#1,081 |
| 51. | Buffalo | 22 | 12,733(0.17%)#51 | 173,375(0.01%)#1,110 |
| 52. | Glen Cove | 22 | 12,733(0.17%)#52 | 173,375(0.01%)#1,123 |
| 53. | Lansing | 22 | 12,733(0.17%)#53 | 173,375(0.01%)#1,131 |
| 54. | Coram | 21 | 12,733(0.16%)#54 | 173,375(0.01%)#1,144 |
| 55. | Elmont | 21 | 12,733(0.16%)#55 | 173,375(0.01%)#1,145 |
| 56. | Long Beach | 21 | 12,733(0.16%)#56 | 173,375(0.01%)#1,148 |
| 57. | Poughkeepsie | 21 | 12,733(0.16%)#57 | 173,375(0.01%)#1,149 |
| 58. | Orangeburg | 21 | 12,733(0.16%)#58 | 173,375(0.01%)#1,166 |
| 59. | Dix Hills | 20 | 12,733(0.16%)#59 | 173,375(0.01%)#1,188 |
| 60. | Bellmore | 20 | 12,733(0.16%)#60 | 173,375(0.01%)#1,195 |
| 61. | South Huntington | 20 | 12,733(0.16%)#61 | 173,375(0.01%)#1,197 |
| 62. | Mineola | 19 | 12,733(0.15%)#62 | 173,375(0.01%)#1,222 |
| 63. | Fairmount | 18 | 12,733(0.14%)#63 | 173,375(0.01%)#1,264 |
| 64. | Hamburg | 17 | 12,733(0.13%)#64 | 173,375(0.01%)#1,295 |
| 65. | Cheektowaga | 16 | 12,733(0.13%)#65 | 173,375(0.01%)#1,306 |
| 66. | Wantagh | 16 | 12,733(0.13%)#66 | 173,375(0.01%)#1,322 |
| 67. | Deer Park | 15 | 12,733(0.12%)#67 | 173,375(0.01%)#1,352 |
| 68. | Binghamton | 14 | 12,733(0.11%)#68 | 173,375(0.01%)#1,388 |
| 69. | Medford | 14 | 12,733(0.11%)#69 | 173,375(0.01%)#1,394 |
| 70. | Kingston | 14 | 12,733(0.11%)#70 | 173,375(0.01%)#1,396 |
| 71. | Lake Ronkonkoma | 14 | 12,733(0.11%)#71 | 173,375(0.01%)#1,400 |
| 72. | Suny Oswego | 14 | 12,733(0.11%)#72 | 173,375(0.01%)#1,414 |
| 73. | Ossining | 13 | 12,733(0.10%)#73 | 173,375(0.01%)#1,436 |
| 74. | Shinnecock Hills | 13 | 12,733(0.10%)#74 | 173,375(0.01%)#1,463 |
| 75. | Laurel Hollow | 13 | 12,733(0.10%)#75 | 173,375(0.01%)#1,464 |
| 76. | Centereach | 12 | 12,733(0.09%)#76 | 173,375(0.01%)#1,480 |
| 77. | Ithaca | 12 | 12,733(0.09%)#77 | 173,375(0.01%)#1,481 |
| 78. | Bay Shore | 12 | 12,733(0.09%)#78 | 173,375(0.01%)#1,482 |
| 79. | Niskayuna | 12 | 12,733(0.09%)#79 | 173,375(0.01%)#1,487 |
| 80. | Greece | 12 | 12,733(0.09%)#80 | 173,375(0.01%)#1,495 |
| 81. | Endwell | 12 | 12,733(0.09%)#81 | 173,375(0.01%)#1,498 |
| 82. | Lawrence | 12 | 12,733(0.09%)#82 | 173,375(0.01%)#1,504 |
| 83. | Thiells | 12 | 12,733(0.09%)#83 | 173,375(0.01%)#1,506 |
| 84. | Westhampton Beach | 12 | 12,733(0.09%)#84 | 173,375(0.01%)#1,509 |
| 85. | Nissequogue | 12 | 12,733(0.09%)#85 | 173,375(0.01%)#1,511 |
| 86. | Lynbrook | 11 | 12,733(0.09%)#86 | 173,375(0.01%)#1,535 |
| 87. | North Merrick | 11 | 12,733(0.09%)#87 | 173,375(0.01%)#1,543 |
| 88. | Terryville | 11 | 12,733(0.09%)#88 | 173,375(0.01%)#1,548 |
| 89. | Stony Brook University | 11 | 12,733(0.09%)#89 | 173,375(0.01%)#1,553 |
| 90. | New Cassel | 10 | 12,733(0.08%)#90 | 173,375(0.01%)#1,588 |
| 91. | South Valley Stream | 10 | 12,733(0.08%)#91 | 173,375(0.01%)#1,598 |
| 92. | East Quogue | 10 | 12,733(0.08%)#92 | 173,375(0.01%)#1,599 |
| 93. | Island Park | 10 | 12,733(0.08%)#93 | 173,375(0.01%)#1,601 |
| 94. | Hamilton | 10 | 12,733(0.08%)#94 | 173,375(0.01%)#1,604 |
| 95. | Dolgeville | 10 | 12,733(0.08%)#95 | 173,375(0.01%)#1,613 |
| 96. | South Floral Park | 10 | 12,733(0.08%)#96 | 173,375(0.01%)#1,616 |
| 97. | Rome | 9 | 12,733(0.07%)#97 | 173,375(0.01%)#1,634 |
| 98. | Franklin Square | 9 | 12,733(0.07%)#98 | 173,375(0.01%)#1,635 |
| 99. | Scotchtown | 9 | 12,733(0.07%)#99 | 173,375(0.01%)#1,656 |
| 100. | Camillus | 9 | 12,733(0.07%)#100 | 173,375(0.01%)#1,669 |
Common Questions
What are the Top 10 Cities with the Largest Costa Rican Community in New York?
Top 10 Cities with the Largest Costa Rican Community in New York are:
#1
6,614
#2
706
#3
671
#4
266
#5
183
#6
157
#7
142
#8
134
#9
126
#10
108
What city has the Largest Costa Rican Community in New York?
New York has the Largest Costa Rican Community in New York with 6,614.
What is the Total Costa Rican Population in the State of New York?
Total Costa Rican Population in New York is 12,733.
What is the Total Costa Rican Population in the United States?
Total Costa Rican Population in the United States is 173,375.