Cities with the Largest Central American Community in New York
RELATED REPORTS & OPTIONS
Central American
New York
Compare Cities
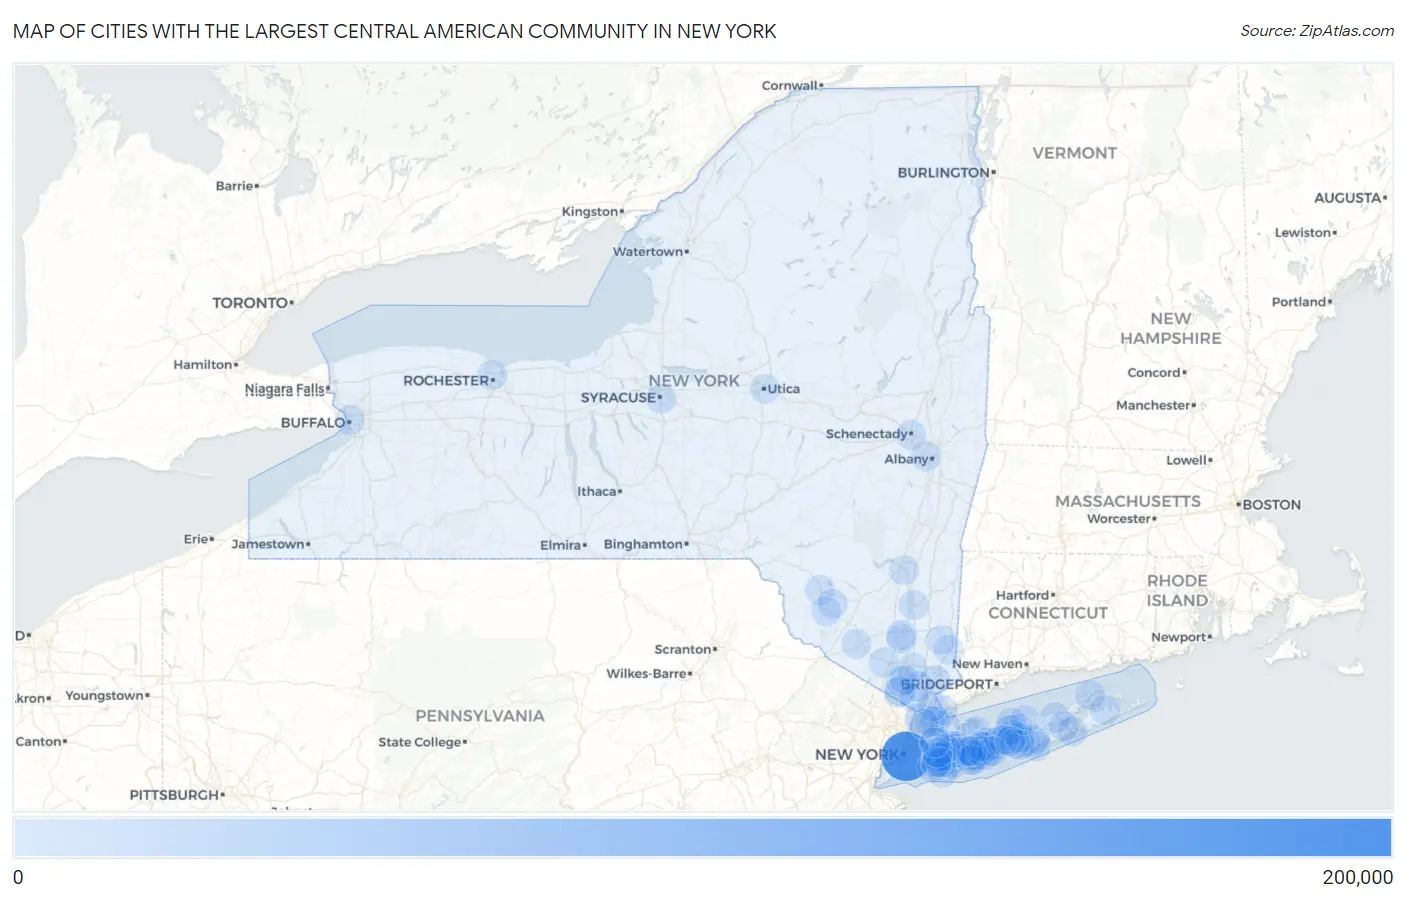
Map of Cities with the Largest Central American Community in New York
0
200,000
Cities with the Largest Central American Community in New York
| City | Central American | vs State | vs National | |
| 1. | New York | 185,520 | 433,134(42.83%)#1 | 6,002,595(3.09%)#3 |
| 2. | Brentwood | 21,006 | 433,134(4.85%)#2 | 6,002,595(0.35%)#19 |
| 3. | Hempstead | 17,737 | 433,134(4.10%)#3 | 6,002,595(0.30%)#24 |
| 4. | Central Islip | 12,145 | 433,134(2.80%)#4 | 6,002,595(0.20%)#50 |
| 5. | Uniondale | 8,497 | 433,134(1.96%)#5 | 6,002,595(0.14%)#90 |
| 6. | Freeport | 7,166 | 433,134(1.65%)#6 | 6,002,595(0.12%)#118 |
| 7. | North Bay Shore | 6,722 | 433,134(1.55%)#7 | 6,002,595(0.11%)#127 |
| 8. | Yonkers | 6,337 | 433,134(1.46%)#8 | 6,002,595(0.11%)#133 |
| 9. | Huntington Station | 5,935 | 433,134(1.37%)#9 | 6,002,595(0.10%)#140 |
| 10. | New Cassel | 5,542 | 433,134(1.28%)#10 | 6,002,595(0.09%)#156 |
| 11. | Roosevelt | 5,512 | 433,134(1.27%)#11 | 6,002,595(0.09%)#157 |
| 12. | Glen Cove | 4,430 | 433,134(1.02%)#12 | 6,002,595(0.07%)#209 |
| 13. | Port Chester | 4,107 | 433,134(0.95%)#13 | 6,002,595(0.07%)#224 |
| 14. | North Amityville | 4,009 | 433,134(0.93%)#14 | 6,002,595(0.07%)#230 |
| 15. | Inwood | 4,004 | 433,134(0.92%)#15 | 6,002,595(0.07%)#231 |
| 16. | Elmont | 2,986 | 433,134(0.69%)#16 | 6,002,595(0.05%)#318 |
| 17. | Riverhead | 2,835 | 433,134(0.65%)#17 | 6,002,595(0.05%)#334 |
| 18. | New Rochelle | 2,802 | 433,134(0.65%)#18 | 6,002,595(0.05%)#338 |
| 19. | Wyandanch | 2,598 | 433,134(0.60%)#19 | 6,002,595(0.04%)#362 |
| 20. | Spring Valley | 2,485 | 433,134(0.57%)#20 | 6,002,595(0.04%)#383 |
| 21. | Newburgh | 2,361 | 433,134(0.55%)#21 | 6,002,595(0.04%)#401 |
| 22. | Copiague | 2,284 | 433,134(0.53%)#22 | 6,002,595(0.04%)#411 |
| 23. | Mount Kisco | 2,094 | 433,134(0.48%)#23 | 6,002,595(0.03%)#445 |
| 24. | Hicksville | 2,083 | 433,134(0.48%)#24 | 6,002,595(0.03%)#449 |
| 25. | Westbury | 2,041 | 433,134(0.47%)#25 | 6,002,595(0.03%)#459 |
| 26. | Mamaroneck | 1,917 | 433,134(0.44%)#26 | 6,002,595(0.03%)#490 |
| 27. | West Babylon | 1,837 | 433,134(0.42%)#27 | 6,002,595(0.03%)#508 |
| 28. | Shirley | 1,787 | 433,134(0.41%)#28 | 6,002,595(0.03%)#519 |
| 29. | Baldwin | 1,741 | 433,134(0.40%)#29 | 6,002,595(0.03%)#532 |
| 30. | North Bellport | 1,656 | 433,134(0.38%)#30 | 6,002,595(0.03%)#556 |
| 31. | Hampton Bays | 1,592 | 433,134(0.37%)#31 | 6,002,595(0.03%)#579 |
| 32. | Valley Stream | 1,565 | 433,134(0.36%)#32 | 6,002,595(0.03%)#587 |
| 33. | Mastic | 1,436 | 433,134(0.33%)#33 | 6,002,595(0.02%)#617 |
| 34. | White Plains | 1,408 | 433,134(0.33%)#34 | 6,002,595(0.02%)#636 |
| 35. | Levittown | 1,388 | 433,134(0.32%)#35 | 6,002,595(0.02%)#647 |
| 36. | West Hempstead | 1,362 | 433,134(0.31%)#36 | 6,002,595(0.02%)#652 |
| 37. | Flanders | 1,343 | 433,134(0.31%)#37 | 6,002,595(0.02%)#664 |
| 38. | Peekskill | 1,260 | 433,134(0.29%)#38 | 6,002,595(0.02%)#701 |
| 39. | Hillcrest | 1,227 | 433,134(0.28%)#39 | 6,002,595(0.02%)#712 |
| 40. | Bay Shore | 1,118 | 433,134(0.26%)#40 | 6,002,595(0.02%)#767 |
| 41. | Albany | 1,074 | 433,134(0.25%)#41 | 6,002,595(0.02%)#788 |
| 42. | Coram | 1,022 | 433,134(0.24%)#42 | 6,002,595(0.02%)#818 |
| 43. | Brewster | 1,022 | 433,134(0.24%)#43 | 6,002,595(0.02%)#819 |
| 44. | Liberty | 1,002 | 433,134(0.23%)#44 | 6,002,595(0.02%)#826 |
| 45. | Schenectady | 987 | 433,134(0.23%)#45 | 6,002,595(0.02%)#836 |
| 46. | Baywood | 974 | 433,134(0.22%)#46 | 6,002,595(0.02%)#845 |
| 47. | Ossining | 954 | 433,134(0.22%)#47 | 6,002,595(0.02%)#860 |
| 48. | Salisbury | 934 | 433,134(0.22%)#48 | 6,002,595(0.02%)#873 |
| 49. | East Meadow | 905 | 433,134(0.21%)#49 | 6,002,595(0.02%)#895 |
| 50. | North Lindenhurst | 884 | 433,134(0.20%)#50 | 6,002,595(0.01%)#905 |
| 51. | Great Neck | 857 | 433,134(0.20%)#51 | 6,002,595(0.01%)#930 |
| 52. | Mount Vernon | 852 | 433,134(0.20%)#52 | 6,002,595(0.01%)#934 |
| 53. | Franklin Square | 828 | 433,134(0.19%)#53 | 6,002,595(0.01%)#963 |
| 54. | Rochester | 826 | 433,134(0.19%)#54 | 6,002,595(0.01%)#966 |
| 55. | Long Beach | 825 | 433,134(0.19%)#55 | 6,002,595(0.01%)#968 |
| 56. | Lindenhurst | 821 | 433,134(0.19%)#56 | 6,002,595(0.01%)#976 |
| 57. | West Islip | 769 | 433,134(0.18%)#57 | 6,002,595(0.01%)#1,038 |
| 58. | Holtsville | 748 | 433,134(0.17%)#58 | 6,002,595(0.01%)#1,060 |
| 59. | Mineola | 743 | 433,134(0.17%)#59 | 6,002,595(0.01%)#1,066 |
| 60. | South Fallsburg | 738 | 433,134(0.17%)#60 | 6,002,595(0.01%)#1,073 |
| 61. | Northwest Harbor | 726 | 433,134(0.17%)#61 | 6,002,595(0.01%)#1,079 |
| 62. | Selden | 715 | 433,134(0.17%)#62 | 6,002,595(0.01%)#1,093 |
| 63. | Buffalo | 711 | 433,134(0.16%)#63 | 6,002,595(0.01%)#1,098 |
| 64. | Kingston | 702 | 433,134(0.16%)#64 | 6,002,595(0.01%)#1,105 |
| 65. | Greenlawn | 670 | 433,134(0.15%)#65 | 6,002,595(0.01%)#1,144 |
| 66. | Syracuse | 664 | 433,134(0.15%)#66 | 6,002,595(0.01%)#1,152 |
| 67. | North Babylon | 634 | 433,134(0.15%)#67 | 6,002,595(0.01%)#1,181 |
| 68. | Port Jefferson Station | 614 | 433,134(0.14%)#68 | 6,002,595(0.01%)#1,210 |
| 69. | Mastic Beach | 609 | 433,134(0.14%)#69 | 6,002,595(0.01%)#1,218 |
| 70. | Farmingville | 598 | 433,134(0.14%)#70 | 6,002,595(0.01%)#1,229 |
| 71. | Middletown | 589 | 433,134(0.14%)#71 | 6,002,595(0.01%)#1,242 |
| 72. | Medford | 589 | 433,134(0.14%)#72 | 6,002,595(0.01%)#1,243 |
| 73. | Poughkeepsie | 572 | 433,134(0.13%)#73 | 6,002,595(0.01%)#1,273 |
| 74. | Centereach | 571 | 433,134(0.13%)#74 | 6,002,595(0.01%)#1,275 |
| 75. | Lake Carmel | 566 | 433,134(0.13%)#75 | 6,002,595(0.01%)#1,283 |
| 76. | Mount Ivy | 555 | 433,134(0.13%)#76 | 6,002,595(0.01%)#1,300 |
| 77. | West Haverstraw | 552 | 433,134(0.13%)#77 | 6,002,595(0.01%)#1,304 |
| 78. | Islandia | 536 | 433,134(0.12%)#78 | 6,002,595(0.01%)#1,329 |
| 79. | Monroe | 532 | 433,134(0.12%)#79 | 6,002,595(0.01%)#1,339 |
| 80. | New Windsor | 526 | 433,134(0.12%)#80 | 6,002,595(0.01%)#1,350 |
| 81. | Deer Park | 521 | 433,134(0.12%)#81 | 6,002,595(0.01%)#1,362 |
| 82. | East Patchogue | 515 | 433,134(0.12%)#82 | 6,002,595(0.01%)#1,367 |
| 83. | Amityville | 515 | 433,134(0.12%)#83 | 6,002,595(0.01%)#1,368 |
| 84. | North Valley Stream | 492 | 433,134(0.11%)#84 | 6,002,595(0.01%)#1,415 |
| 85. | Woodmere | 491 | 433,134(0.11%)#85 | 6,002,595(0.01%)#1,421 |
| 86. | Lynbrook | 484 | 433,134(0.11%)#86 | 6,002,595(0.01%)#1,435 |
| 87. | South Valley Stream | 483 | 433,134(0.11%)#87 | 6,002,595(0.01%)#1,438 |
| 88. | North Patchogue | 470 | 433,134(0.11%)#88 | 6,002,595(0.01%)#1,462 |
| 89. | Floral Park | 465 | 433,134(0.11%)#89 | 6,002,595(0.01%)#1,464 |
| 90. | Rocky Point | 464 | 433,134(0.11%)#90 | 6,002,595(0.01%)#1,468 |
| 91. | Monticello | 464 | 433,134(0.11%)#91 | 6,002,595(0.01%)#1,469 |
| 92. | Ronkonkoma | 453 | 433,134(0.10%)#92 | 6,002,595(0.01%)#1,486 |
| 93. | Nyack | 450 | 433,134(0.10%)#93 | 6,002,595(0.01%)#1,493 |
| 94. | Greenport | 450 | 433,134(0.10%)#94 | 6,002,595(0.01%)#1,494 |
| 95. | Islip | 447 | 433,134(0.10%)#95 | 6,002,595(0.01%)#1,500 |
| 96. | Great Neck Plaza | 445 | 433,134(0.10%)#96 | 6,002,595(0.01%)#1,506 |
| 97. | Farmingdale | 437 | 433,134(0.10%)#97 | 6,002,595(0.01%)#1,521 |
| 98. | East Farmingdale | 434 | 433,134(0.10%)#98 | 6,002,595(0.01%)#1,529 |
| 99. | Utica | 433 | 433,134(0.10%)#99 | 6,002,595(0.01%)#1,530 |
| 100. | Holbrook | 429 | 433,134(0.10%)#100 | 6,002,595(0.01%)#1,538 |
Common Questions
What are the Top 10 Cities with the Largest Central American Community in New York?
Top 10 Cities with the Largest Central American Community in New York are:
#1
185,520
#2
21,006
#3
17,737
#4
12,145
#5
8,497
#6
7,166
#7
6,722
#8
6,337
#9
5,935
#10
5,542
What city has the Largest Central American Community in New York?
New York has the Largest Central American Community in New York with 185,520.
What is the Total Central American Population in the State of New York?
Total Central American Population in New York is 433,134.
What is the Total Central American Population in the United States?
Total Central American Population in the United States is 6,002,595.