Zip Codes with the Highest Percentage of Population Employed in Food Preparation & Serving in Buffalo, NY
RELATED REPORTS & OPTIONS
Food Preparation & Serving
Buffalo
Compare Zip Codes
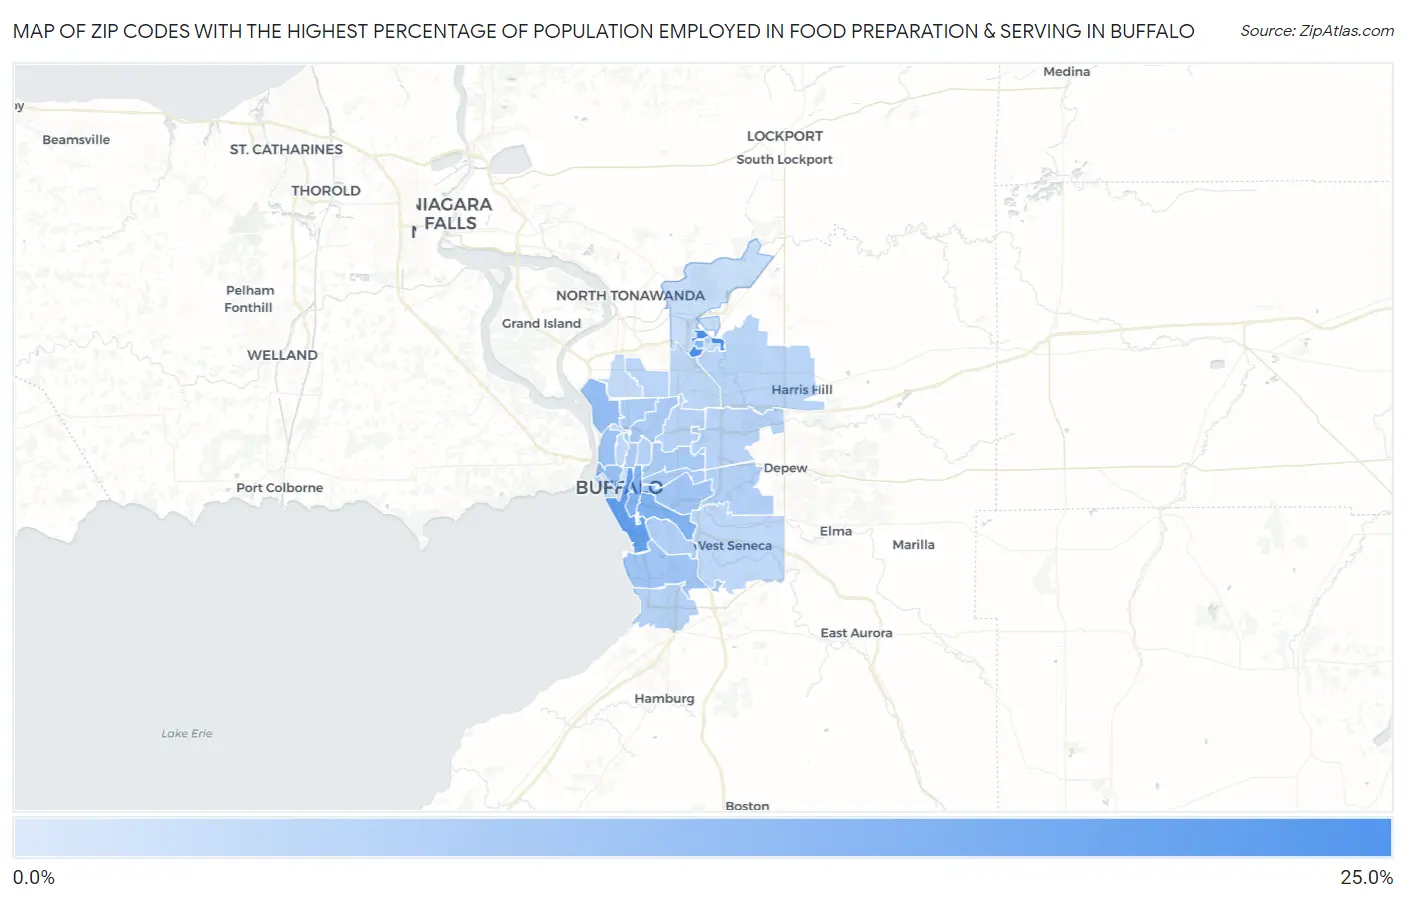
Map of Zip Codes with the Highest Percentage of Population Employed in Food Preparation & Serving in Buffalo
0.37%
20.2%
Zip Codes with the Highest Percentage of Population Employed in Food Preparation & Serving in Buffalo, NY
| Zip Code | % Employed | vs State | vs National | |
| 1. | 14261 | 20.2% | 4.8%(+15.4)#26 | 5.3%(+14.9)#494 |
| 2. | 14203 | 16.0% | 4.8%(+11.2)#42 | 5.3%(+10.7)#865 |
| 3. | 14210 | 12.1% | 4.8%(+7.26)#90 | 5.3%(+6.79)#1,639 |
| 4. | 14260 | 11.9% | 4.8%(+7.13)#93 | 5.3%(+6.66)#1,686 |
| 5. | 14204 | 11.9% | 4.8%(+7.05)#96 | 5.3%(+6.58)#1,715 |
| 6. | 14207 | 9.6% | 4.8%(+4.81)#150 | 5.3%(+4.34)#2,951 |
| 7. | 14201 | 9.3% | 4.8%(+4.52)#160 | 5.3%(+4.05)#3,210 |
| 8. | 14213 | 8.7% | 4.8%(+3.90)#193 | 5.3%(+3.43)#3,820 |
| 9. | 14206 | 8.0% | 4.8%(+3.15)#235 | 5.3%(+2.68)#4,771 |
| 10. | 14218 | 7.9% | 4.8%(+3.11)#242 | 5.3%(+2.64)#4,845 |
| 11. | 14211 | 7.1% | 4.8%(+2.31)#318 | 5.3%(+1.84)#6,281 |
| 12. | 14212 | 6.6% | 4.8%(+1.74)#379 | 5.3%(+1.27)#7,710 |
| 13. | 14214 | 6.6% | 4.8%(+1.73)#381 | 5.3%(+1.26)#7,727 |
| 14. | 14209 | 6.4% | 4.8%(+1.61)#397 | 5.3%(+1.14)#8,076 |
| 15. | 14216 | 6.3% | 4.8%(+1.50)#413 | 5.3%(+1.03)#8,379 |
| 16. | 14220 | 5.9% | 4.8%(+1.10)#466 | 5.3%(+0.635)#9,607 |
| 17. | 14227 | 5.4% | 4.8%(+0.585)#555 | 5.3%(+0.115)#11,404 |
| 18. | 14208 | 5.3% | 4.8%(+0.481)#566 | 5.3%(+0.010)#11,776 |
| 19. | 14219 | 5.2% | 4.8%(+0.420)#575 | 5.3%(-0.050)#12,005 |
| 20. | 14225 | 4.9% | 4.8%(+0.098)#635 | 5.3%(-0.372)#13,291 |
| 21. | 14215 | 4.8% | 4.8%(-0.000)#658 | 5.3%(-0.471)#13,696 |
| 22. | 14221 | 4.7% | 4.8%(-0.093)#669 | 5.3%(-0.563)#14,070 |
| 23. | 14223 | 4.5% | 4.8%(-0.282)#732 | 5.3%(-0.753)#14,885 |
| 24. | 14226 | 4.4% | 4.8%(-0.408)#765 | 5.3%(-0.879)#15,389 |
| 25. | 14224 | 4.0% | 4.8%(-0.861)#872 | 5.3%(-1.33)#17,314 |
| 26. | 14222 | 3.8% | 4.8%(-0.976)#892 | 5.3%(-1.45)#17,775 |
| 27. | 14217 | 3.4% | 4.8%(-1.38)#994 | 5.3%(-1.86)#19,482 |
| 28. | 14228 | 3.0% | 4.8%(-1.83)#1,103 | 5.3%(-2.30)#21,299 |
| 29. | 14202 | 0.37% | 4.8%(-4.45)#1,504 | 5.3%(-4.92)#27,802 |
1
Common Questions
What are the Top 10 Zip Codes with the Highest Percentage of Population Employed in Food Preparation & Serving in Buffalo, NY?
Top 10 Zip Codes with the Highest Percentage of Population Employed in Food Preparation & Serving in Buffalo, NY are:
What zip code has the Highest Percentage of Population Employed in Food Preparation & Serving in Buffalo, NY?
14261 has the Highest Percentage of Population Employed in Food Preparation & Serving in Buffalo, NY with 20.2%.
What is the Percentage of Population Employed in Food Preparation & Serving in Buffalo, NY?
Percentage of Population Employed in Food Preparation & Serving in Buffalo is 7.1%.
What is the Percentage of Population Employed in Food Preparation & Serving in New York?
Percentage of Population Employed in Food Preparation & Serving in New York is 4.8%.
What is the Percentage of Population Employed in Food Preparation & Serving in the United States?
Percentage of Population Employed in Food Preparation & Serving in the United States is 5.3%.