Cities with the Highest Percentage of Belgian Population in New York
RELATED REPORTS & OPTIONS
Belgian
New York
Compare Cities
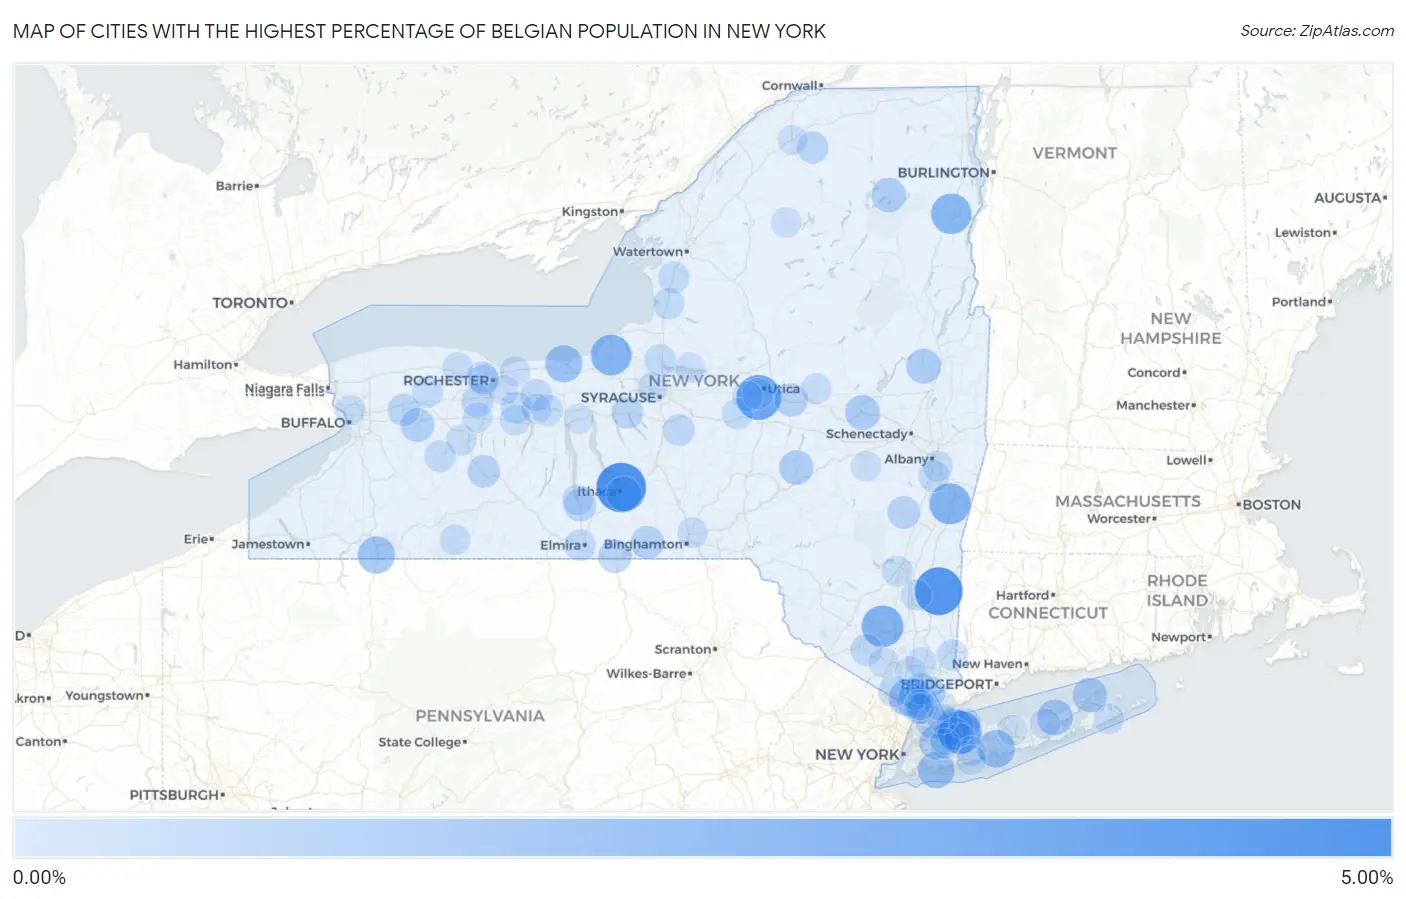
Map of Cities with the Highest Percentage of Belgian Population in New York
0.00%
5.00%
Cities with the Highest Percentage of Belgian Population in New York
| City | Belgian | vs State | vs National | |
| 1. | Cayuga Heights | 4.28% | 0.058%(+4.22)#1 | 0.099%(+4.18)#121 |
| 2. | Millbrook | 3.91% | 0.058%(+3.85)#2 | 0.099%(+3.81)#136 |
| 3. | Washington Mills | 3.25% | 0.058%(+3.19)#3 | 0.099%(+3.15)#182 |
| 4. | Oyster Bay Cove | 2.94% | 0.058%(+2.88)#4 | 0.099%(+2.84)#204 |
| 5. | Walden | 2.59% | 0.058%(+2.54)#5 | 0.099%(+2.50)#238 |
| 6. | Chatham | 2.50% | 0.058%(+2.44)#6 | 0.099%(+2.40)#252 |
| 7. | Hannibal | 2.40% | 0.058%(+2.34)#7 | 0.099%(+2.30)#268 |
| 8. | Elizabethtown | 2.35% | 0.058%(+2.29)#8 | 0.099%(+2.25)#276 |
| 9. | Islip Terrace | 1.73% | 0.058%(+1.67)#9 | 0.099%(+1.63)#395 |
| 10. | Limestone | 1.64% | 0.058%(+1.59)#10 | 0.099%(+1.54)#420 |
| 11. | Sodus Point | 1.64% | 0.058%(+1.58)#11 | 0.099%(+1.54)#421 |
| 12. | Mill Neck | 1.62% | 0.058%(+1.57)#12 | 0.099%(+1.53)#428 |
| 13. | West Nyack | 1.62% | 0.058%(+1.56)#13 | 0.099%(+1.52)#430 |
| 14. | Lawrence | 1.55% | 0.058%(+1.49)#14 | 0.099%(+1.45)#465 |
| 15. | Riverhead | 1.40% | 0.058%(+1.35)#15 | 0.099%(+1.31)#517 |
| 16. | East Ithaca | 1.22% | 0.058%(+1.16)#16 | 0.099%(+1.12)#608 |
| 17. | Corinth | 1.21% | 0.058%(+1.15)#17 | 0.099%(+1.11)#615 |
| 18. | Fultonville | 1.19% | 0.058%(+1.14)#18 | 0.099%(+1.10)#624 |
| 19. | Saranac Lake | 1.12% | 0.058%(+1.06)#19 | 0.099%(+1.02)#668 |
| 20. | Greenport West | 1.12% | 0.058%(+1.06)#20 | 0.099%(+1.02)#669 |
| 21. | Milford | 1.08% | 0.058%(+1.02)#21 | 0.099%(+0.983)#694 |
| 22. | Kensington | 1.04% | 0.058%(+0.980)#22 | 0.099%(+0.939)#718 |
| 23. | Attica | 0.98% | 0.058%(+0.925)#23 | 0.099%(+0.885)#763 |
| 24. | Grand View On Hudson | 0.94% | 0.058%(+0.885)#24 | 0.099%(+0.845)#803 |
| 25. | Waverly | 0.89% | 0.058%(+0.836)#25 | 0.099%(+0.796)#846 |
| 26. | Owego | 0.88% | 0.058%(+0.824)#26 | 0.099%(+0.784)#855 |
| 27. | Herkimer | 0.86% | 0.058%(+0.802)#27 | 0.099%(+0.761)#880 |
| 28. | Larchmont | 0.78% | 0.058%(+0.721)#28 | 0.099%(+0.680)#965 |
| 29. | Dansville | 0.78% | 0.058%(+0.717)#29 | 0.099%(+0.676)#971 |
| 30. | Montour Falls | 0.77% | 0.058%(+0.707)#30 | 0.099%(+0.666)#984 |
| 31. | Thornwood | 0.75% | 0.058%(+0.693)#31 | 0.099%(+0.652)#999 |
| 32. | Cairo | 0.74% | 0.058%(+0.681)#32 | 0.099%(+0.640)#1,013 |
| 33. | Corfu | 0.70% | 0.058%(+0.646)#33 | 0.099%(+0.605)#1,054 |
| 34. | Upper Brookville | 0.69% | 0.058%(+0.633)#34 | 0.099%(+0.593)#1,074 |
| 35. | Scottsville | 0.64% | 0.058%(+0.586)#35 | 0.099%(+0.546)#1,152 |
| 36. | East Setauket | 0.64% | 0.058%(+0.577)#36 | 0.099%(+0.536)#1,167 |
| 37. | Skaneateles | 0.63% | 0.058%(+0.572)#37 | 0.099%(+0.531)#1,176 |
| 38. | Parishville | 0.62% | 0.058%(+0.560)#38 | 0.099%(+0.519)#1,191 |
| 39. | Sleepy Hollow Lake | 0.61% | 0.058%(+0.553)#39 | 0.099%(+0.512)#1,203 |
| 40. | Roslyn Harbor | 0.61% | 0.058%(+0.552)#40 | 0.099%(+0.511)#1,206 |
| 41. | Palmyra | 0.60% | 0.058%(+0.543)#41 | 0.099%(+0.502)#1,218 |
| 42. | Goshen | 0.59% | 0.058%(+0.535)#42 | 0.099%(+0.494)#1,231 |
| 43. | Lloyd Harbor | 0.59% | 0.058%(+0.530)#43 | 0.099%(+0.489)#1,237 |
| 44. | North Gates | 0.57% | 0.058%(+0.514)#44 | 0.099%(+0.473)#1,267 |
| 45. | Upper Nyack | 0.56% | 0.058%(+0.502)#45 | 0.099%(+0.461)#1,288 |
| 46. | Fabius | 0.56% | 0.058%(+0.502)#46 | 0.099%(+0.461)#1,289 |
| 47. | Central Square | 0.53% | 0.058%(+0.471)#47 | 0.099%(+0.430)#1,374 |
| 48. | Adams | 0.52% | 0.058%(+0.462)#48 | 0.099%(+0.421)#1,397 |
| 49. | Peach Lake | 0.52% | 0.058%(+0.461)#49 | 0.099%(+0.420)#1,401 |
| 50. | Victor | 0.51% | 0.058%(+0.456)#50 | 0.099%(+0.415)#1,413 |
| 51. | Lacona | 0.51% | 0.058%(+0.453)#51 | 0.099%(+0.413)#1,416 |
| 52. | Viola | 0.50% | 0.058%(+0.443)#52 | 0.099%(+0.402)#1,444 |
| 53. | Silver Springs | 0.49% | 0.058%(+0.430)#53 | 0.099%(+0.389)#1,479 |
| 54. | Setauket | 0.48% | 0.058%(+0.423)#54 | 0.099%(+0.383)#1,496 |
| 55. | West Elmira | 0.48% | 0.058%(+0.421)#55 | 0.099%(+0.381)#1,498 |
| 56. | Castleton On Hudson | 0.47% | 0.058%(+0.415)#56 | 0.099%(+0.374)#1,516 |
| 57. | Briarcliff Manor | 0.46% | 0.058%(+0.402)#57 | 0.099%(+0.361)#1,542 |
| 58. | Ardsley | 0.46% | 0.058%(+0.401)#58 | 0.099%(+0.360)#1,545 |
| 59. | Oriskany Falls | 0.46% | 0.058%(+0.400)#59 | 0.099%(+0.359)#1,547 |
| 60. | Gates | 0.45% | 0.058%(+0.387)#60 | 0.099%(+0.346)#1,581 |
| 61. | Clifton Springs | 0.44% | 0.058%(+0.383)#61 | 0.099%(+0.342)#1,595 |
| 62. | Haviland | 0.43% | 0.058%(+0.370)#62 | 0.099%(+0.330)#1,623 |
| 63. | New Hartford | 0.42% | 0.058%(+0.365)#63 | 0.099%(+0.324)#1,643 |
| 64. | Rye Brook | 0.41% | 0.058%(+0.355)#64 | 0.099%(+0.314)#1,672 |
| 65. | Elba | 0.41% | 0.058%(+0.349)#65 | 0.099%(+0.308)#1,697 |
| 66. | Leicester | 0.39% | 0.058%(+0.335)#66 | 0.099%(+0.294)#1,737 |
| 67. | Hurley | 0.39% | 0.058%(+0.328)#67 | 0.099%(+0.287)#1,770 |
| 68. | Bloomfield | 0.37% | 0.058%(+0.309)#68 | 0.099%(+0.268)#1,839 |
| 69. | Syosset | 0.36% | 0.058%(+0.303)#69 | 0.099%(+0.263)#1,856 |
| 70. | East Greenbush | 0.35% | 0.058%(+0.292)#70 | 0.099%(+0.251)#1,907 |
| 71. | Dobbs Ferry | 0.35% | 0.058%(+0.292)#71 | 0.099%(+0.251)#1,908 |
| 72. | Wellsville | 0.35% | 0.058%(+0.291)#72 | 0.099%(+0.250)#1,914 |
| 73. | Chenango Bridge | 0.34% | 0.058%(+0.283)#73 | 0.099%(+0.242)#1,945 |
| 74. | Clarkson | 0.34% | 0.058%(+0.280)#74 | 0.099%(+0.240)#1,954 |
| 75. | Watkins Glen | 0.34% | 0.058%(+0.279)#75 | 0.099%(+0.239)#1,958 |
| 76. | Lake Mohegan | 0.34% | 0.058%(+0.279)#76 | 0.099%(+0.238)#1,964 |
| 77. | Webster | 0.33% | 0.058%(+0.274)#77 | 0.099%(+0.233)#1,985 |
| 78. | Middleburgh | 0.33% | 0.058%(+0.272)#78 | 0.099%(+0.231)#1,997 |
| 79. | Dolgeville | 0.32% | 0.058%(+0.263)#79 | 0.099%(+0.222)#2,048 |
| 80. | Calverton | 0.32% | 0.058%(+0.262)#80 | 0.099%(+0.221)#2,050 |
| 81. | East Hampton | 0.31% | 0.058%(+0.257)#81 | 0.099%(+0.216)#2,074 |
| 82. | Clinton | 0.31% | 0.058%(+0.253)#82 | 0.099%(+0.212)#2,089 |
| 83. | Star Lake | 0.31% | 0.058%(+0.250)#83 | 0.099%(+0.209)#2,105 |
| 84. | Monroe | 0.31% | 0.058%(+0.250)#84 | 0.099%(+0.209)#2,108 |
| 85. | Liverpool | 0.30% | 0.058%(+0.242)#85 | 0.099%(+0.201)#2,147 |
| 86. | Milton Cdp Saratoga County | 0.30% | 0.058%(+0.238)#86 | 0.099%(+0.198)#2,166 |
| 87. | Avon | 0.30% | 0.058%(+0.237)#87 | 0.099%(+0.196)#2,172 |
| 88. | Kenmore | 0.28% | 0.058%(+0.219)#88 | 0.099%(+0.178)#2,291 |
| 89. | Buchanan | 0.26% | 0.058%(+0.206)#89 | 0.099%(+0.165)#2,384 |
| 90. | Manchester | 0.26% | 0.058%(+0.203)#90 | 0.099%(+0.162)#2,414 |
| 91. | Selden | 0.26% | 0.058%(+0.199)#91 | 0.099%(+0.159)#2,436 |
| 92. | Rye | 0.25% | 0.058%(+0.191)#92 | 0.099%(+0.150)#2,492 |
| 93. | Potsdam | 0.25% | 0.058%(+0.187)#93 | 0.099%(+0.146)#2,517 |
| 94. | Pittsford | 0.24% | 0.058%(+0.185)#94 | 0.099%(+0.144)#2,521 |
| 95. | Irvington | 0.24% | 0.058%(+0.185)#95 | 0.099%(+0.144)#2,527 |
| 96. | Waterloo | 0.24% | 0.058%(+0.182)#96 | 0.099%(+0.141)#2,553 |
| 97. | Cleveland | 0.24% | 0.058%(+0.177)#97 | 0.099%(+0.137)#2,592 |
| 98. | East Farmingdale | 0.23% | 0.058%(+0.173)#98 | 0.099%(+0.133)#2,619 |
| 99. | Amityville | 0.23% | 0.058%(+0.173)#99 | 0.099%(+0.133)#2,620 |
| 100. | Roslyn Heights | 0.23% | 0.058%(+0.173)#100 | 0.099%(+0.133)#2,621 |
Common Questions
What are the Top 10 Cities with the Highest Percentage of Belgian Population in New York?
Top 10 Cities with the Highest Percentage of Belgian Population in New York are:
#1
4.28%
#2
3.91%
#3
3.25%
#4
2.94%
#5
2.59%
#6
2.50%
#7
2.40%
#8
2.35%
#9
1.73%
#10
1.64%
What city has the Highest Percentage of Belgian Population in New York?
Cayuga Heights has the Highest Percentage of Belgian Population in New York with 4.28%.
What is the Percentage of Belgian Population in the State of New York?
Percentage of Belgian Population in New York is 0.058%.
What is the Percentage of Belgian Population in the United States?
Percentage of Belgian Population in the United States is 0.099%.