Zip Codes with the Highest Percentage of Population Employed in Food Preparation & Serving in Niagara Falls, NY
RELATED REPORTS & OPTIONS
Food Preparation & Serving
Niagara Falls
Compare Zip Codes
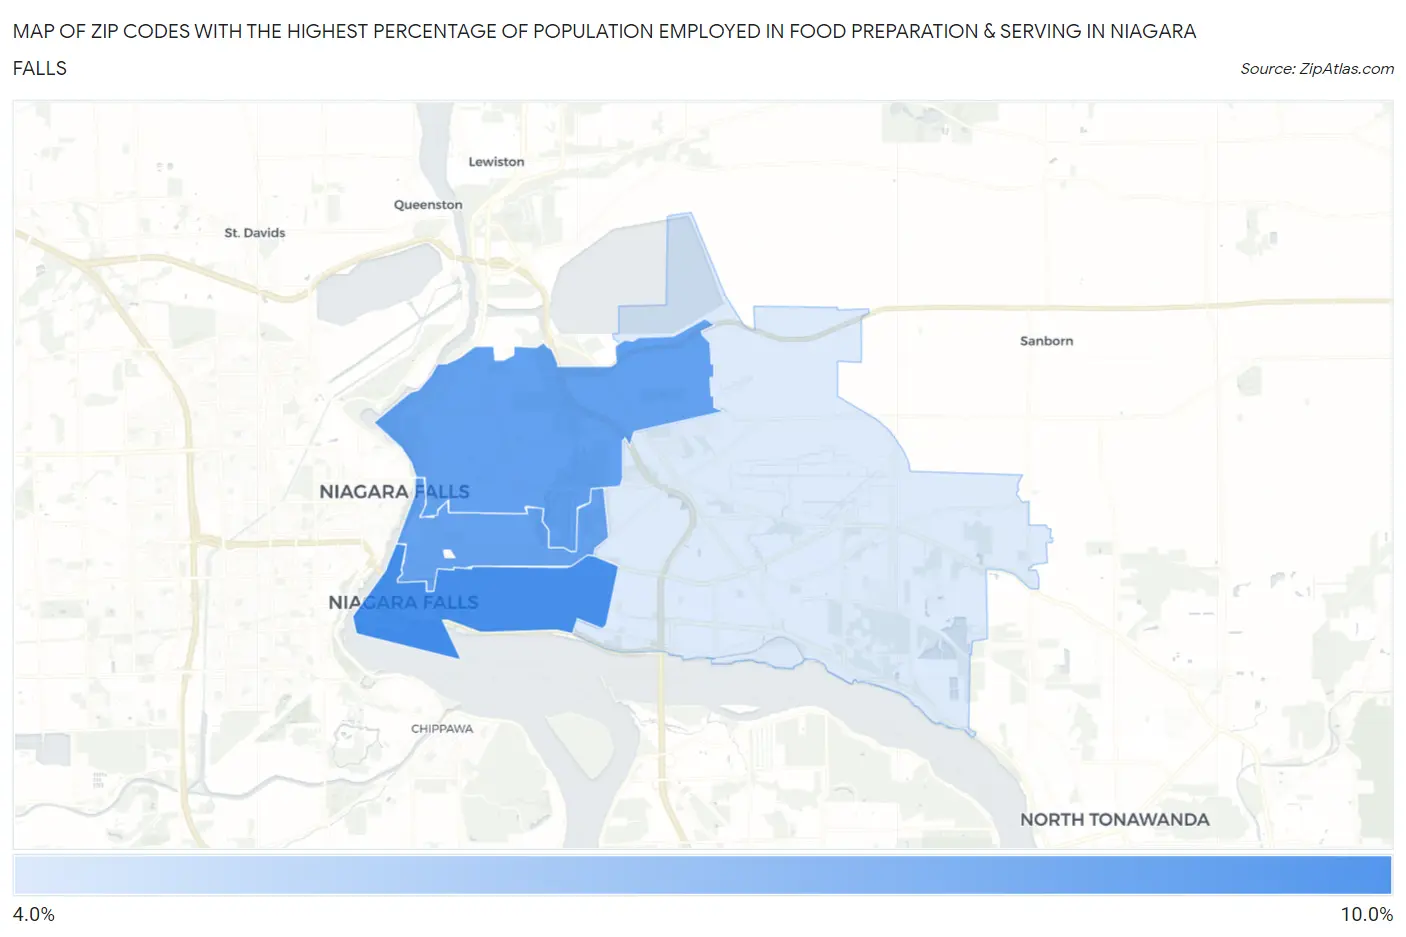
Map of Zip Codes with the Highest Percentage of Population Employed in Food Preparation & Serving in Niagara Falls
4.7%
8.4%
Zip Codes with the Highest Percentage of Population Employed in Food Preparation & Serving in Niagara Falls, NY
| Zip Code | % Employed | vs State | vs National | |
| 1. | 14303 | 8.4% | 4.8%(+3.58)#211 | 5.3%(+3.11)#4,180 |
| 2. | 14305 | 7.7% | 4.8%(+2.88)#257 | 5.3%(+2.41)#5,210 |
| 3. | 14301 | 7.7% | 4.8%(+2.85)#262 | 5.3%(+2.38)#5,266 |
| 4. | 14304 | 4.7% | 4.8%(-0.109)#674 | 5.3%(-0.579)#14,131 |
1
Common Questions
What are the Top 3 Zip Codes with the Highest Percentage of Population Employed in Food Preparation & Serving in Niagara Falls, NY?
Top 3 Zip Codes with the Highest Percentage of Population Employed in Food Preparation & Serving in Niagara Falls, NY are:
What zip code has the Highest Percentage of Population Employed in Food Preparation & Serving in Niagara Falls, NY?
14303 has the Highest Percentage of Population Employed in Food Preparation & Serving in Niagara Falls, NY with 8.4%.
What is the Percentage of Population Employed in Food Preparation & Serving in Niagara Falls, NY?
Percentage of Population Employed in Food Preparation & Serving in Niagara Falls is 7.2%.
What is the Percentage of Population Employed in Food Preparation & Serving in New York?
Percentage of Population Employed in Food Preparation & Serving in New York is 4.8%.
What is the Percentage of Population Employed in Food Preparation & Serving in the United States?
Percentage of Population Employed in Food Preparation & Serving in the United States is 5.3%.