Cities with the Largest Polish Community in New York
RELATED REPORTS & OPTIONS
Polish
New York
Compare Cities
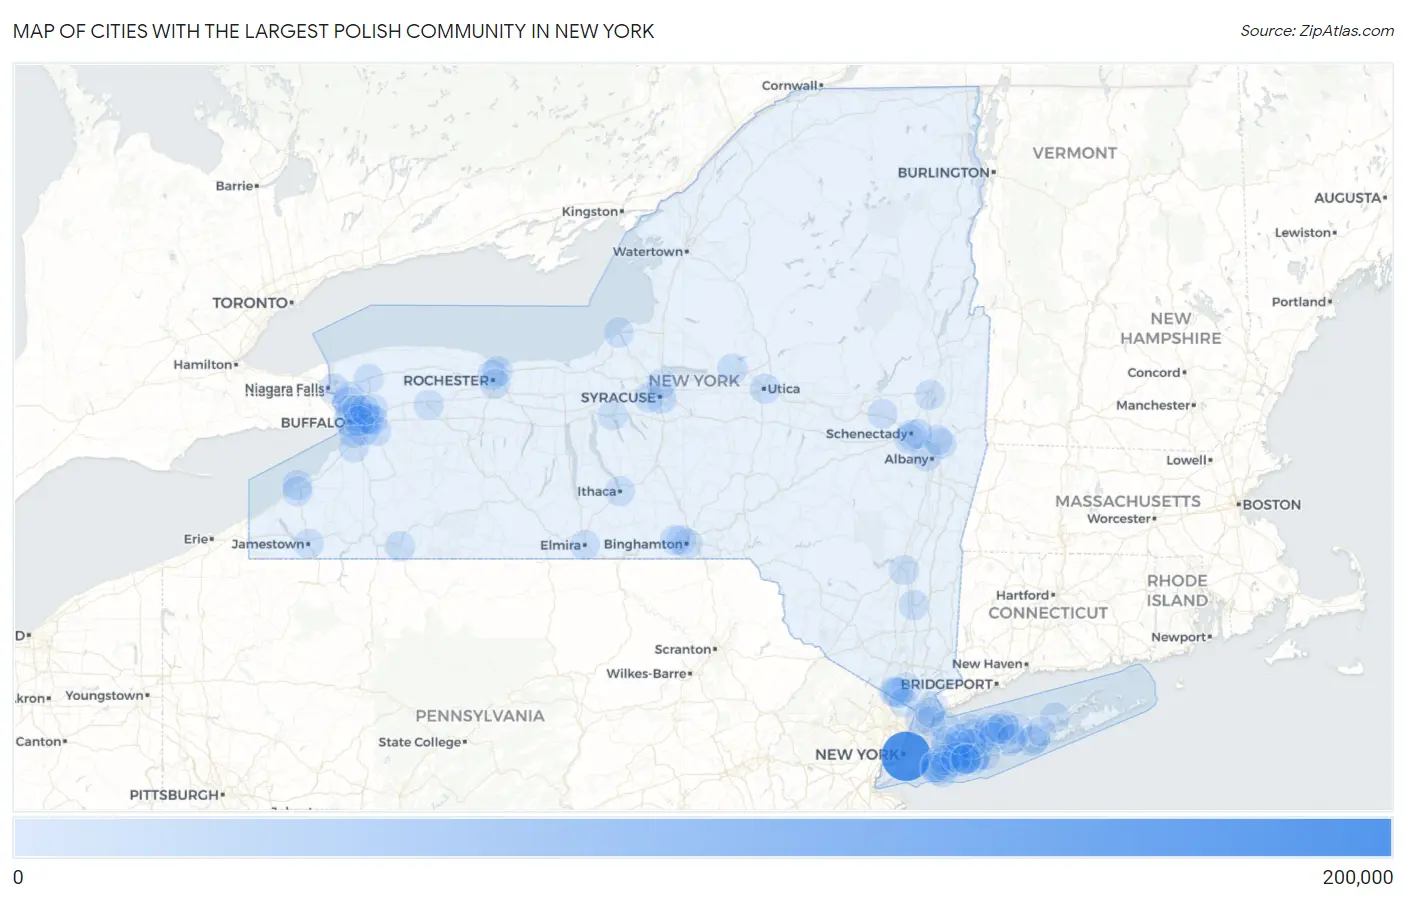
Map of Cities with the Largest Polish Community in New York
0
200,000
Cities with the Largest Polish Community in New York
| City | Polish | vs State | vs National | |
| 1. | New York | 188,511 | 834,546(22.59%)#1 | 8,645,944(2.18%)#1 |
| 2. | Buffalo | 24,187 | 834,546(2.90%)#2 | 8,645,944(0.28%)#8 |
| 3. | Cheektowaga | 20,003 | 834,546(2.40%)#3 | 8,645,944(0.23%)#11 |
| 4. | West Seneca | 10,910 | 834,546(1.31%)#4 | 8,645,944(0.13%)#38 |
| 5. | Tonawanda | 7,581 | 834,546(0.91%)#5 | 8,645,944(0.09%)#72 |
| 6. | North Tonawanda | 5,396 | 834,546(0.65%)#6 | 8,645,944(0.06%)#118 |
| 7. | Syracuse | 5,269 | 834,546(0.63%)#7 | 8,645,944(0.06%)#126 |
| 8. | Rochester | 4,913 | 834,546(0.59%)#8 | 8,645,944(0.06%)#145 |
| 9. | Depew | 4,736 | 834,546(0.57%)#9 | 8,645,944(0.05%)#153 |
| 10. | Yonkers | 4,663 | 834,546(0.56%)#10 | 8,645,944(0.05%)#159 |
| 11. | Niagara Falls | 3,549 | 834,546(0.43%)#11 | 8,645,944(0.04%)#239 |
| 12. | Albany | 3,532 | 834,546(0.42%)#12 | 8,645,944(0.04%)#242 |
| 13. | Lackawanna | 3,408 | 834,546(0.41%)#13 | 8,645,944(0.04%)#255 |
| 14. | Irondequoit | 3,147 | 834,546(0.38%)#14 | 8,645,944(0.04%)#283 |
| 15. | Utica | 2,986 | 834,546(0.36%)#15 | 8,645,944(0.03%)#302 |
| 16. | West Babylon | 2,637 | 834,546(0.32%)#16 | 8,645,944(0.03%)#369 |
| 17. | Schenectady | 2,628 | 834,546(0.31%)#17 | 8,645,944(0.03%)#370 |
| 18. | Dunkirk | 2,627 | 834,546(0.31%)#18 | 8,645,944(0.03%)#373 |
| 19. | Levittown | 2,468 | 834,546(0.30%)#19 | 8,645,944(0.03%)#399 |
| 20. | Lancaster | 2,397 | 834,546(0.29%)#20 | 8,645,944(0.03%)#414 |
| 21. | Rome | 2,307 | 834,546(0.28%)#21 | 8,645,944(0.03%)#436 |
| 22. | Troy | 2,190 | 834,546(0.26%)#22 | 8,645,944(0.03%)#465 |
| 23. | Lindenhurst | 2,153 | 834,546(0.26%)#23 | 8,645,944(0.02%)#478 |
| 24. | Kenmore | 2,127 | 834,546(0.25%)#24 | 8,645,944(0.02%)#487 |
| 25. | Binghamton | 2,068 | 834,546(0.25%)#25 | 8,645,944(0.02%)#515 |
| 26. | Plainview | 2,057 | 834,546(0.25%)#26 | 8,645,944(0.02%)#518 |
| 27. | Auburn | 2,051 | 834,546(0.25%)#27 | 8,645,944(0.02%)#519 |
| 28. | White Plains | 2,024 | 834,546(0.24%)#28 | 8,645,944(0.02%)#529 |
| 29. | East Meadow | 1,969 | 834,546(0.24%)#29 | 8,645,944(0.02%)#545 |
| 30. | Brighton | 1,896 | 834,546(0.23%)#30 | 8,645,944(0.02%)#578 |
| 31. | Monsey | 1,882 | 834,546(0.23%)#31 | 8,645,944(0.02%)#586 |
| 32. | Commack | 1,876 | 834,546(0.22%)#32 | 8,645,944(0.02%)#589 |
| 33. | Holbrook | 1,816 | 834,546(0.22%)#33 | 8,645,944(0.02%)#619 |
| 34. | Amsterdam | 1,801 | 834,546(0.22%)#34 | 8,645,944(0.02%)#627 |
| 35. | Hamburg | 1,790 | 834,546(0.21%)#35 | 8,645,944(0.02%)#632 |
| 36. | New Rochelle | 1,785 | 834,546(0.21%)#36 | 8,645,944(0.02%)#637 |
| 37. | Saratoga Springs | 1,776 | 834,546(0.21%)#37 | 8,645,944(0.02%)#644 |
| 38. | Woodmere | 1,769 | 834,546(0.21%)#38 | 8,645,944(0.02%)#648 |
| 39. | Lawrence | 1,766 | 834,546(0.21%)#39 | 8,645,944(0.02%)#651 |
| 40. | Coram | 1,751 | 834,546(0.21%)#40 | 8,645,944(0.02%)#661 |
| 41. | Rotterdam | 1,726 | 834,546(0.21%)#41 | 8,645,944(0.02%)#676 |
| 42. | West Hempstead | 1,691 | 834,546(0.20%)#42 | 8,645,944(0.02%)#697 |
| 43. | Copiague | 1,601 | 834,546(0.19%)#43 | 8,645,944(0.02%)#746 |
| 44. | Huntington Station | 1,556 | 834,546(0.19%)#44 | 8,645,944(0.02%)#766 |
| 45. | Dix Hills | 1,539 | 834,546(0.18%)#45 | 8,645,944(0.02%)#776 |
| 46. | West Islip | 1,524 | 834,546(0.18%)#46 | 8,645,944(0.02%)#783 |
| 47. | Lockport | 1,490 | 834,546(0.18%)#47 | 8,645,944(0.02%)#807 |
| 48. | Long Beach | 1,473 | 834,546(0.18%)#48 | 8,645,944(0.02%)#814 |
| 49. | New City | 1,451 | 834,546(0.17%)#49 | 8,645,944(0.02%)#827 |
| 50. | Fredonia | 1,390 | 834,546(0.17%)#50 | 8,645,944(0.02%)#869 |
| 51. | Harris Hill | 1,387 | 834,546(0.17%)#51 | 8,645,944(0.02%)#871 |
| 52. | Olean | 1,356 | 834,546(0.16%)#52 | 8,645,944(0.02%)#893 |
| 53. | Huntington | 1,343 | 834,546(0.16%)#53 | 8,645,944(0.02%)#904 |
| 54. | East Massapequa | 1,332 | 834,546(0.16%)#54 | 8,645,944(0.02%)#915 |
| 55. | Cohoes | 1,315 | 834,546(0.16%)#55 | 8,645,944(0.02%)#932 |
| 56. | Merrick | 1,312 | 834,546(0.16%)#56 | 8,645,944(0.02%)#935 |
| 57. | Hicksville | 1,294 | 834,546(0.16%)#57 | 8,645,944(0.01%)#952 |
| 58. | Spring Valley | 1,282 | 834,546(0.15%)#58 | 8,645,944(0.01%)#968 |
| 59. | Batavia | 1,274 | 834,546(0.15%)#59 | 8,645,944(0.01%)#977 |
| 60. | Mineola | 1,268 | 834,546(0.15%)#60 | 8,645,944(0.01%)#982 |
| 61. | Elmira | 1,266 | 834,546(0.15%)#61 | 8,645,944(0.01%)#985 |
| 62. | Jamestown | 1,260 | 834,546(0.15%)#62 | 8,645,944(0.01%)#993 |
| 63. | Glen Cove | 1,248 | 834,546(0.15%)#63 | 8,645,944(0.01%)#1,002 |
| 64. | Riverhead | 1,243 | 834,546(0.15%)#64 | 8,645,944(0.01%)#1,007 |
| 65. | East Hills | 1,242 | 834,546(0.15%)#65 | 8,645,944(0.01%)#1,008 |
| 66. | Fairmount | 1,204 | 834,546(0.14%)#66 | 8,645,944(0.01%)#1,043 |
| 67. | Eggertsville | 1,199 | 834,546(0.14%)#67 | 8,645,944(0.01%)#1,046 |
| 68. | Oswego | 1,196 | 834,546(0.14%)#68 | 8,645,944(0.01%)#1,051 |
| 69. | Elma Center | 1,171 | 834,546(0.14%)#69 | 8,645,944(0.01%)#1,075 |
| 70. | Rockville Centre | 1,169 | 834,546(0.14%)#70 | 8,645,944(0.01%)#1,077 |
| 71. | Seaford | 1,151 | 834,546(0.14%)#71 | 8,645,944(0.01%)#1,096 |
| 72. | Sloan | 1,145 | 834,546(0.14%)#72 | 8,645,944(0.01%)#1,105 |
| 73. | Kingston | 1,097 | 834,546(0.13%)#73 | 8,645,944(0.01%)#1,165 |
| 74. | Ithaca | 1,091 | 834,546(0.13%)#74 | 8,645,944(0.01%)#1,171 |
| 75. | Kings Park | 1,078 | 834,546(0.13%)#75 | 8,645,944(0.01%)#1,185 |
| 76. | Cedarhurst | 1,075 | 834,546(0.13%)#76 | 8,645,944(0.01%)#1,188 |
| 77. | Centereach | 1,072 | 834,546(0.13%)#77 | 8,645,944(0.01%)#1,190 |
| 78. | Oceanside | 1,062 | 834,546(0.13%)#78 | 8,645,944(0.01%)#1,197 |
| 79. | Smithtown | 1,058 | 834,546(0.13%)#79 | 8,645,944(0.01%)#1,203 |
| 80. | Niskayuna | 1,055 | 834,546(0.13%)#80 | 8,645,944(0.01%)#1,207 |
| 81. | Melville | 1,046 | 834,546(0.13%)#81 | 8,645,944(0.01%)#1,222 |
| 82. | North Bellmore | 1,044 | 834,546(0.13%)#82 | 8,645,944(0.01%)#1,225 |
| 83. | North Syracuse | 1,021 | 834,546(0.12%)#83 | 8,645,944(0.01%)#1,257 |
| 84. | Massapequa | 1,013 | 834,546(0.12%)#84 | 8,645,944(0.01%)#1,267 |
| 85. | Viola | 998 | 834,546(0.12%)#85 | 8,645,944(0.01%)#1,285 |
| 86. | Johnson City | 988 | 834,546(0.12%)#86 | 8,645,944(0.01%)#1,303 |
| 87. | Mastic | 988 | 834,546(0.12%)#87 | 8,645,944(0.01%)#1,304 |
| 88. | Poughkeepsie | 957 | 834,546(0.11%)#88 | 8,645,944(0.01%)#1,340 |
| 89. | Syosset | 951 | 834,546(0.11%)#89 | 8,645,944(0.01%)#1,351 |
| 90. | Massapequa Park | 933 | 834,546(0.11%)#90 | 8,645,944(0.01%)#1,374 |
| 91. | Shirley | 926 | 834,546(0.11%)#91 | 8,645,944(0.01%)#1,386 |
| 92. | Manorville | 918 | 834,546(0.11%)#92 | 8,645,944(0.01%)#1,395 |
| 93. | Stony Brook | 918 | 834,546(0.11%)#93 | 8,645,944(0.01%)#1,396 |
| 94. | Hauppauge | 916 | 834,546(0.11%)#94 | 8,645,944(0.01%)#1,399 |
| 95. | Williamsville | 916 | 834,546(0.11%)#95 | 8,645,944(0.01%)#1,401 |
| 96. | Scarsdale | 915 | 834,546(0.11%)#96 | 8,645,944(0.01%)#1,403 |
| 97. | Pearl River | 914 | 834,546(0.11%)#97 | 8,645,944(0.01%)#1,404 |
| 98. | Holtsville | 908 | 834,546(0.11%)#98 | 8,645,944(0.01%)#1,412 |
| 99. | St James | 904 | 834,546(0.11%)#99 | 8,645,944(0.01%)#1,419 |
| 100. | Endwell | 883 | 834,546(0.11%)#100 | 8,645,944(0.01%)#1,439 |
Common Questions
What are the Top 10 Cities with the Largest Polish Community in New York?
Top 10 Cities with the Largest Polish Community in New York are:
#1
188,511
#2
24,187
#3
20,003
#4
10,910
#5
7,581
#6
5,396
#7
5,269
#8
4,913
#9
4,736
#10
4,663
What city has the Largest Polish Community in New York?
New York has the Largest Polish Community in New York with 188,511.
What is the Total Polish Population in the State of New York?
Total Polish Population in New York is 834,546.
What is the Total Polish Population in the United States?
Total Polish Population in the United States is 8,645,944.