Coopers Plains, NY Map & Demographics
Coopers Plains Map
Coopers Plains Overview
$56,639
PER CAPITA INCOME
$90,595
AVG HOUSEHOLD INCOME
0.44
INEQUALITY / GINI INDEX
432
TOTAL POPULATION
202
MALE POPULATION
230
FEMALE POPULATION
87.83
MALES / 100 FEMALES
113.86
FEMALES / 100 MALES
39.2
MEDIAN AGE
4.3
AVG FAMILY SIZE
3.6
AVG HOUSEHOLD SIZE
257
LABOR FORCE [ PEOPLE ]
76.3%
PERCENT IN LABOR FORCE
2.7%
UNEMPLOYMENT RATE
Coopers Plains Zip Codes
Income in Coopers Plains
Income Overview in Coopers Plains
| Characteristic | Number | Measure |
| Per Capita Income | 432 | $56,639 |
| Median Family Income | 86 | $0 |
| Mean Family Income | 86 | $151,869 |
| Median Household Income | 120 | $90,595 |
| Mean Household Income | 120 | $123,905 |
| Income Deficit | 86 | $0 |
| Wage / Income Gap (%) | 432 | 0.00% |
| Wage / Income Gap ($) | 432 | 100.00¢ per $1 |
| Gini / Inequality Index | 432 | 0.44 |
Earnings by Sex in Coopers Plains
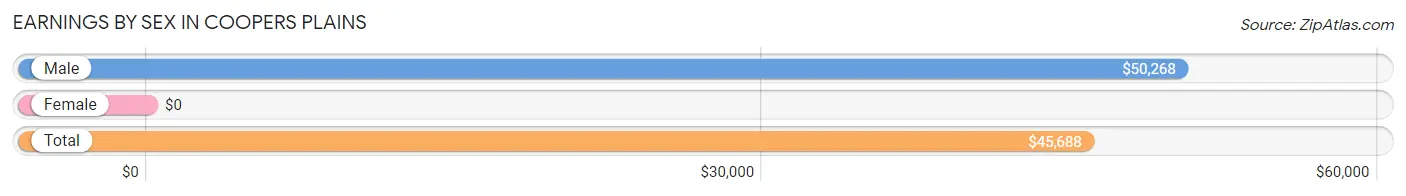
| Sex | Number | Average Earnings |
| Male | 99 (38.5%) | $50,268 |
| Female | 158 (61.5%) | $0 |
| Total | 257 (100.0%) | $45,688 |
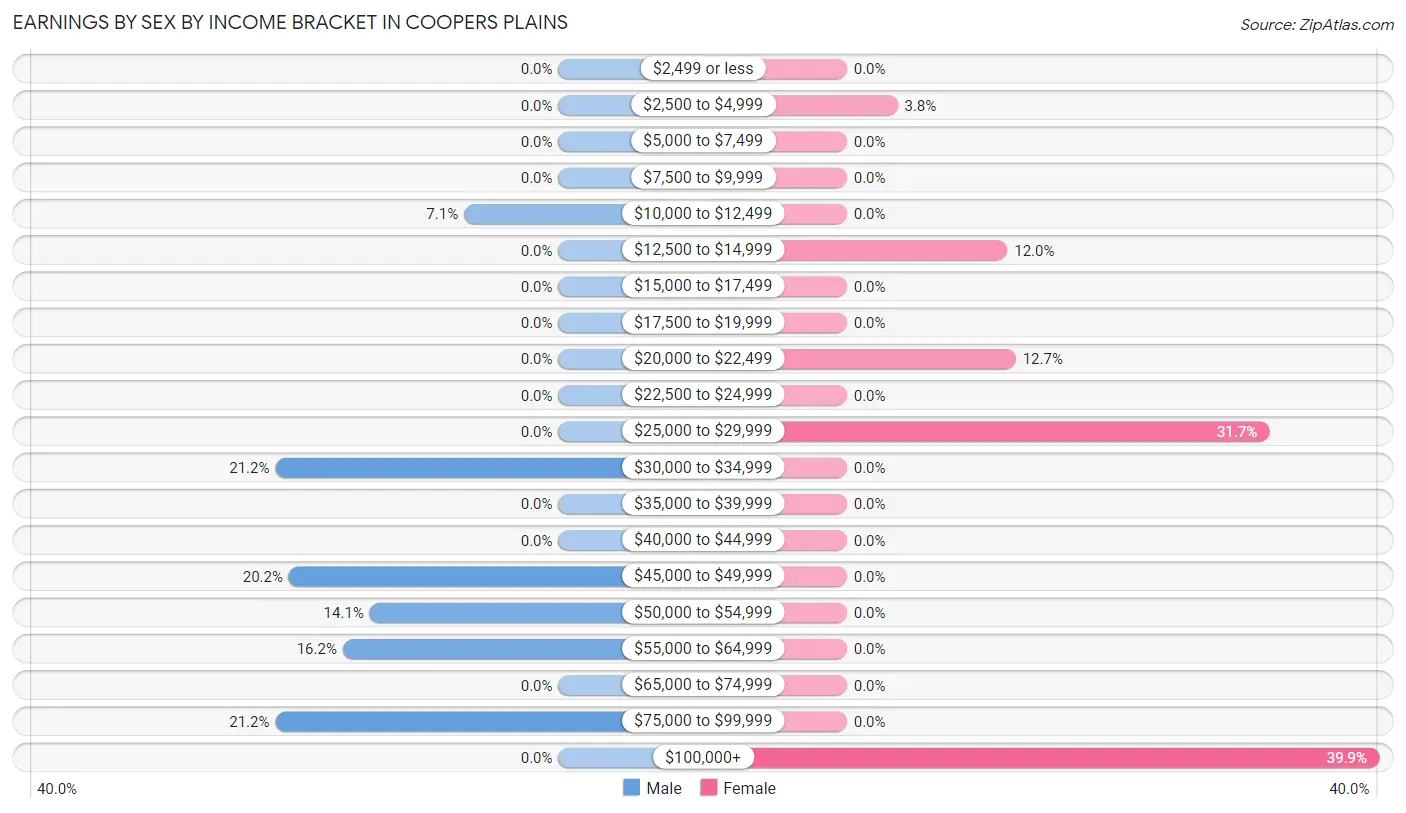
Earnings by Sex by Income Bracket in Coopers Plains
The most common earnings brackets in Coopers Plains are $30,000 to $34,999 for men (21 | 21.2%) and $100,000+ for women (63 | 39.9%).
| Income | Male | Female |
| $2,499 or less | 0 (0.0%) | 0 (0.0%) |
| $2,500 to $4,999 | 0 (0.0%) | 6 (3.8%) |
| $5,000 to $7,499 | 0 (0.0%) | 0 (0.0%) |
| $7,500 to $9,999 | 0 (0.0%) | 0 (0.0%) |
| $10,000 to $12,499 | 7 (7.1%) | 0 (0.0%) |
| $12,500 to $14,999 | 0 (0.0%) | 19 (12.0%) |
| $15,000 to $17,499 | 0 (0.0%) | 0 (0.0%) |
| $17,500 to $19,999 | 0 (0.0%) | 0 (0.0%) |
| $20,000 to $22,499 | 0 (0.0%) | 20 (12.7%) |
| $22,500 to $24,999 | 0 (0.0%) | 0 (0.0%) |
| $25,000 to $29,999 | 0 (0.0%) | 50 (31.7%) |
| $30,000 to $34,999 | 21 (21.2%) | 0 (0.0%) |
| $35,000 to $39,999 | 0 (0.0%) | 0 (0.0%) |
| $40,000 to $44,999 | 0 (0.0%) | 0 (0.0%) |
| $45,000 to $49,999 | 20 (20.2%) | 0 (0.0%) |
| $50,000 to $54,999 | 14 (14.1%) | 0 (0.0%) |
| $55,000 to $64,999 | 16 (16.2%) | 0 (0.0%) |
| $65,000 to $74,999 | 0 (0.0%) | 0 (0.0%) |
| $75,000 to $99,999 | 21 (21.2%) | 0 (0.0%) |
| $100,000+ | 0 (0.0%) | 63 (39.9%) |
| Total | 99 (100.0%) | 158 (100.0%) |
Earnings by Sex by Educational Attainment in Coopers Plains
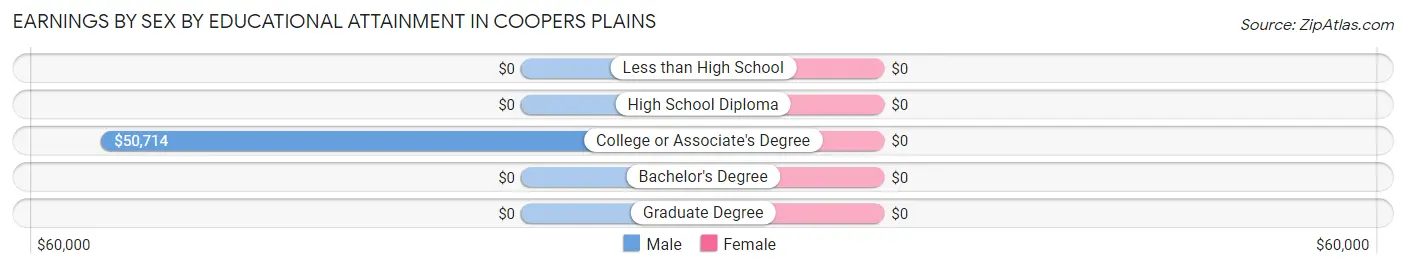
| Educational Attainment | Male Income | Female Income |
| Less than High School | - | - |
| High School Diploma | - | - |
| College or Associate's Degree | $50,714 | $0 |
| Bachelor's Degree | - | - |
| Graduate Degree | - | - |
| Total | $52,143 | $0 |
Family Income in Coopers Plains
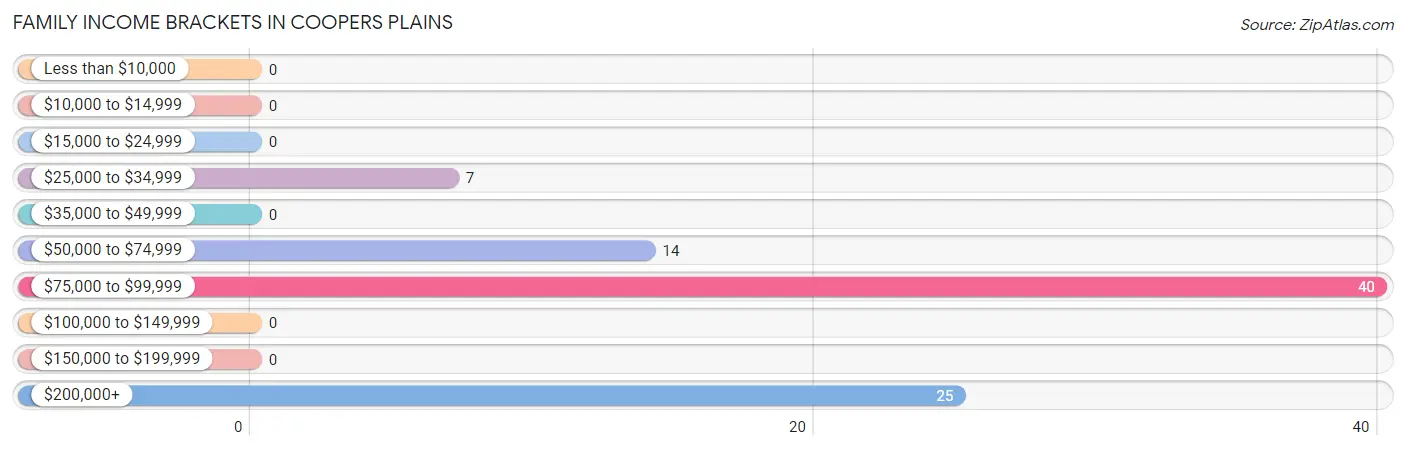
Family Income Brackets in Coopers Plains
According to the Coopers Plains family income data, there are 40 families falling into the $75,000 to $99,999 income range, which is the most common income bracket and makes up 46.5% of all families.
| Income Bracket | # Families | % Families |
| Less than $10,000 | 0 | 0.0% |
| $10,000 to $14,999 | 0 | 0.0% |
| $15,000 to $24,999 | 0 | 0.0% |
| $25,000 to $34,999 | 7 | 8.1% |
| $35,000 to $49,999 | 0 | 0.0% |
| $50,000 to $74,999 | 14 | 16.3% |
| $75,000 to $99,999 | 40 | 46.5% |
| $100,000 to $149,999 | 0 | 0.0% |
| $150,000 to $199,999 | 0 | 0.0% |
| $200,000+ | 25 | 29.1% |
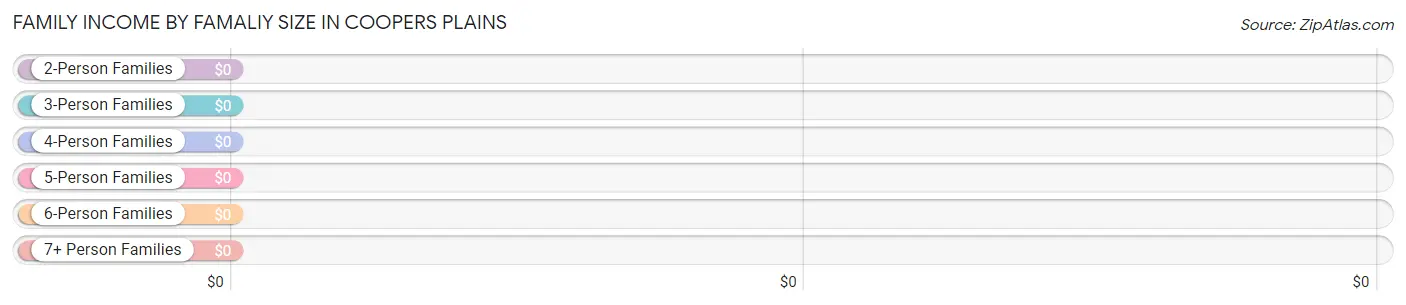
Family Income by Famaliy Size in Coopers Plains
| Income Bracket | # Families | Median Income |
| 2-Person Families | 14 (16.3%) | $0 |
| 3-Person Families | 0 (0.0%) | $0 |
| 4-Person Families | 72 (83.7%) | $0 |
| 5-Person Families | 0 (0.0%) | $0 |
| 6-Person Families | 0 (0.0%) | $0 |
| 7+ Person Families | 0 (0.0%) | $0 |
| Total | 86 (100.0%) | $0 |
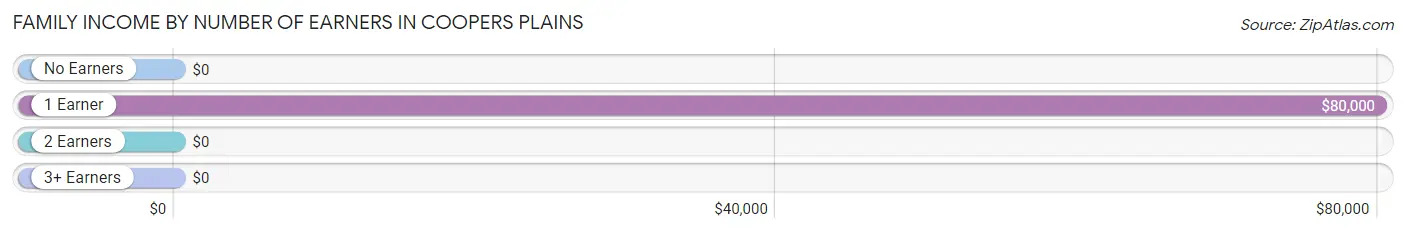
Family Income by Number of Earners in Coopers Plains
| Number of Earners | # Families | Median Income |
| No Earners | 0 (0.0%) | $0 |
| 1 Earner | 42 (48.8%) | $80,000 |
| 2 Earners | 25 (29.1%) | $0 |
| 3+ Earners | 19 (22.1%) | $0 |
| Total | 86 (100.0%) | $0 |
Household Income in Coopers Plains
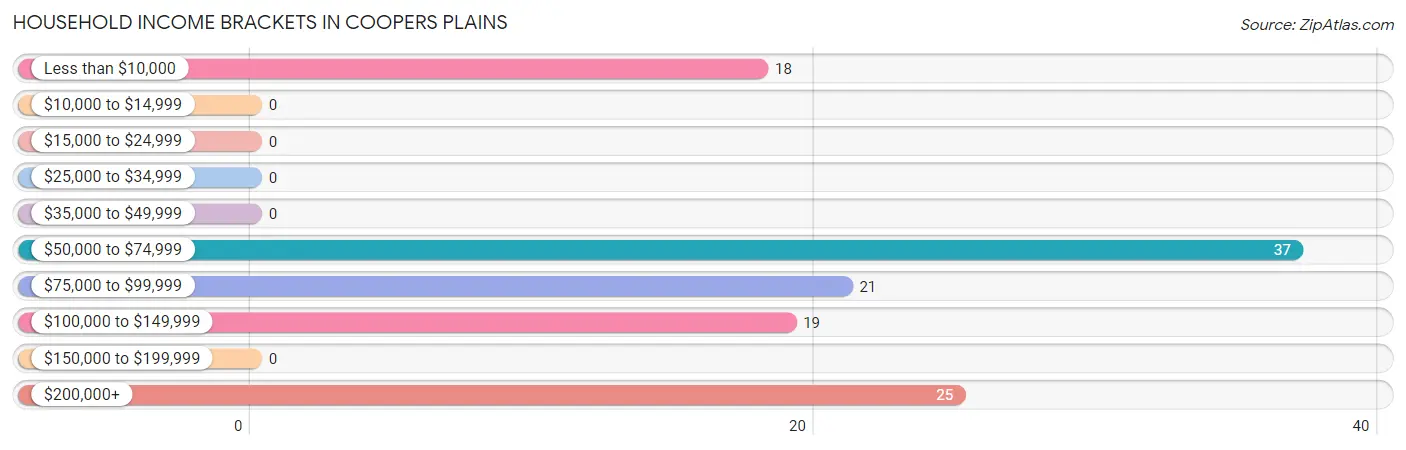
Household Income Brackets in Coopers Plains
With 37 households falling in the category, the $50,000 to $74,999 income range is the most frequent in Coopers Plains, accounting for 30.8% of all households.
| Income Bracket | # Households | % Households |
| Less than $10,000 | 18 | 15.0% |
| $10,000 to $14,999 | 0 | 0.0% |
| $15,000 to $24,999 | 0 | 0.0% |
| $25,000 to $34,999 | 0 | 0.0% |
| $35,000 to $49,999 | 0 | 0.0% |
| $50,000 to $74,999 | 37 | 30.8% |
| $75,000 to $99,999 | 21 | 17.5% |
| $100,000 to $149,999 | 19 | 15.8% |
| $150,000 to $199,999 | 0 | 0.0% |
| $200,000+ | 25 | 20.8% |
Household Income by Householder Age in Coopers Plains
| Income Bracket | # Households | Median Income |
| 15 to 24 Years | 0 (0.0%) | $0 |
| 25 to 44 Years | 35 (29.2%) | $0 |
| 45 to 64 Years | 42 (35.0%) | $0 |
| 65+ Years | 43 (35.8%) | $0 |
| Total | 120 (100.0%) | $90,595 |
Poverty in Coopers Plains
Income Below Poverty by Sex and Age in Coopers Plains
With 9.9% poverty level for males and 9.6% for females among the residents of Coopers Plains, 12 to 14 year old males and 12 to 14 year old females are the most vulnerable to poverty, with 6 males (100.0%) and 4 females (100.0%) in their respective age groups living below the poverty level.
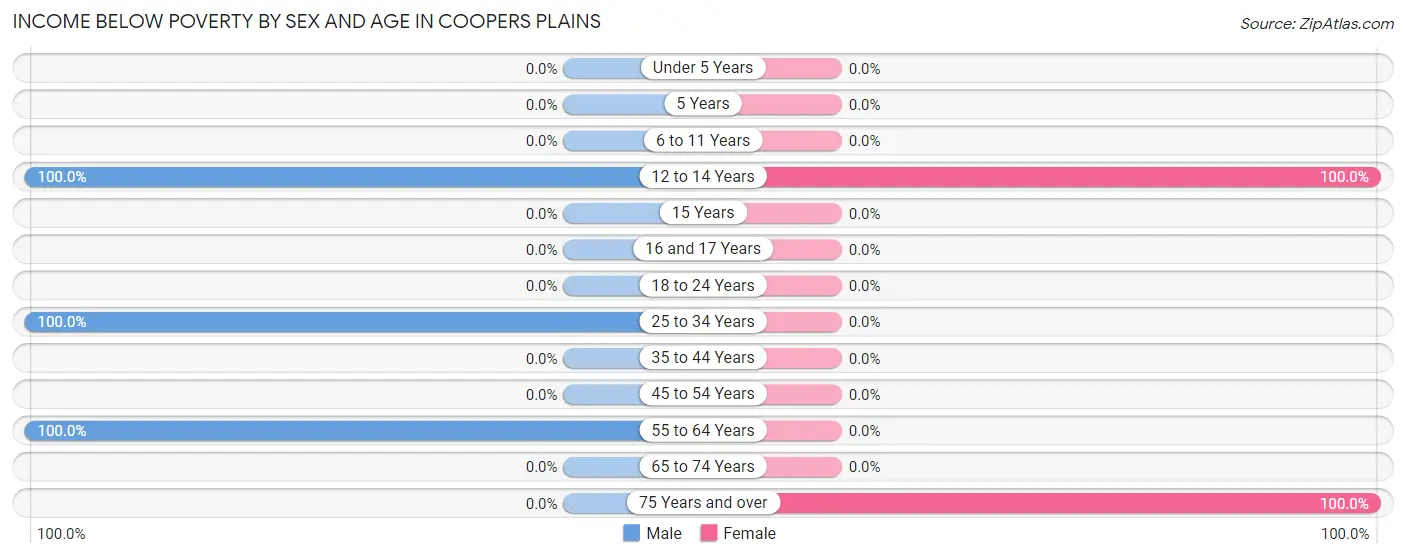
| Age Bracket | Male | Female |
| Under 5 Years | 0 (0.0%) | 0 (0.0%) |
| 5 Years | 0 (0.0%) | 0 (0.0%) |
| 6 to 11 Years | 0 (0.0%) | 0 (0.0%) |
| 12 to 14 Years | 6 (100.0%) | 4 (100.0%) |
| 15 Years | 0 (0.0%) | 0 (0.0%) |
| 16 and 17 Years | 0 (0.0%) | 0 (0.0%) |
| 18 to 24 Years | 0 (0.0%) | 0 (0.0%) |
| 25 to 34 Years | 7 (100.0%) | 0 (0.0%) |
| 35 to 44 Years | 0 (0.0%) | 0 (0.0%) |
| 45 to 54 Years | 0 (0.0%) | 0 (0.0%) |
| 55 to 64 Years | 7 (100.0%) | 0 (0.0%) |
| 65 to 74 Years | 0 (0.0%) | 0 (0.0%) |
| 75 Years and over | 0 (0.0%) | 18 (100.0%) |
| Total | 20 (9.9%) | 22 (9.6%) |
Income Above Poverty by Sex and Age in Coopers Plains
According to the poverty statistics in Coopers Plains, males aged under 5 years and females aged 5 years are the age groups that are most secure financially, with 100.0% of males and 100.0% of females in these age groups living above the poverty line.
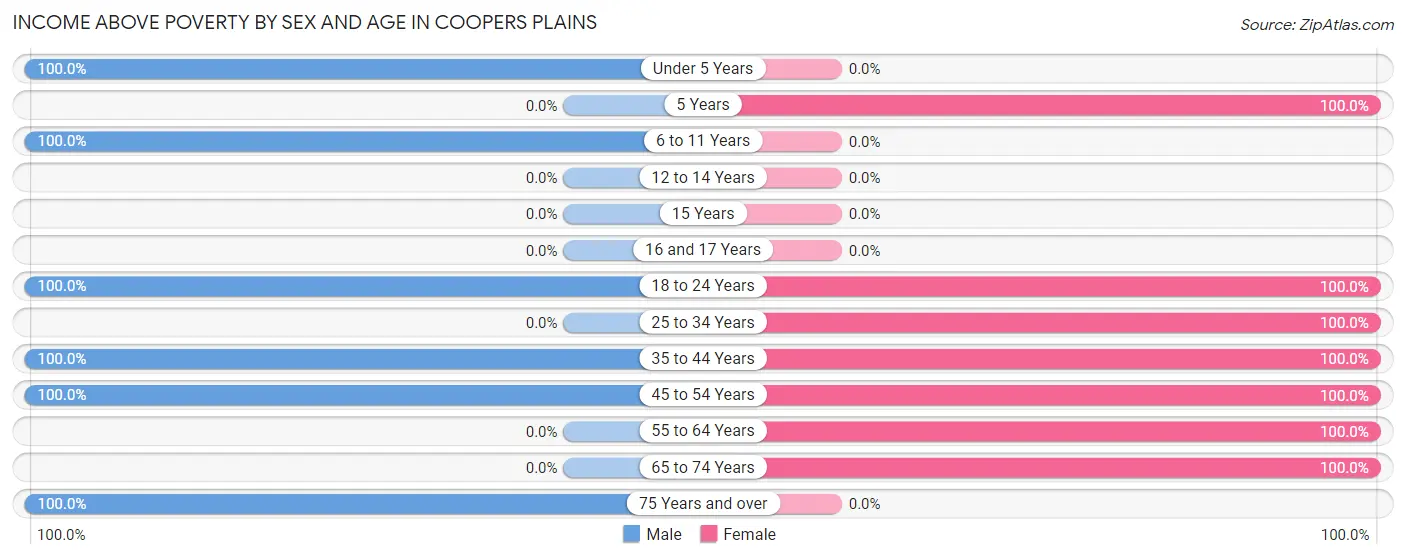
| Age Bracket | Male | Female |
| Under 5 Years | 40 (100.0%) | 0 (0.0%) |
| 5 Years | 0 (0.0%) | 20 (100.0%) |
| 6 to 11 Years | 25 (100.0%) | 0 (0.0%) |
| 12 to 14 Years | 0 (0.0%) | 0 (0.0%) |
| 15 Years | 0 (0.0%) | 0 (0.0%) |
| 16 and 17 Years | 0 (0.0%) | 0 (0.0%) |
| 18 to 24 Years | 21 (100.0%) | 20 (100.0%) |
| 25 to 34 Years | 0 (0.0%) | 50 (100.0%) |
| 35 to 44 Years | 55 (100.0%) | 19 (100.0%) |
| 45 to 54 Years | 16 (100.0%) | 19 (100.0%) |
| 55 to 64 Years | 0 (0.0%) | 69 (100.0%) |
| 65 to 74 Years | 0 (0.0%) | 11 (100.0%) |
| 75 Years and over | 25 (100.0%) | 0 (0.0%) |
| Total | 182 (90.1%) | 208 (90.4%) |
Income Below Poverty Among Married-Couple Families in Coopers Plains

| Children | Above Poverty | Below Poverty |
| No Children | 0 (0.0%) | 0 (0.0%) |
| 1 or 2 Children | 65 (100.0%) | 0 (0.0%) |
| 3 or 4 Children | 0 (0.0%) | 0 (0.0%) |
| 5 or more Children | 0 (0.0%) | 0 (0.0%) |
| Total | 65 (100.0%) | 0 (0.0%) |
Income Below Poverty Among Single-Parent Households in Coopers Plains
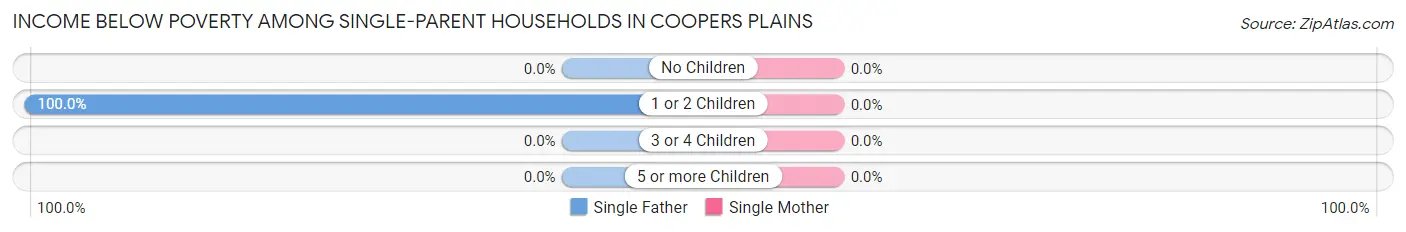
| Children | Single Father | Single Mother |
| No Children | 0 (0.0%) | 0 (0.0%) |
| 1 or 2 Children | 7 (100.0%) | 0 (0.0%) |
| 3 or 4 Children | 0 (0.0%) | 0 (0.0%) |
| 5 or more Children | 0 (0.0%) | 0 (0.0%) |
| Total | 7 (33.3%) | 0 (0.0%) |
Income Below Poverty Among Married-Couple vs Single-Parent Households in Coopers Plains
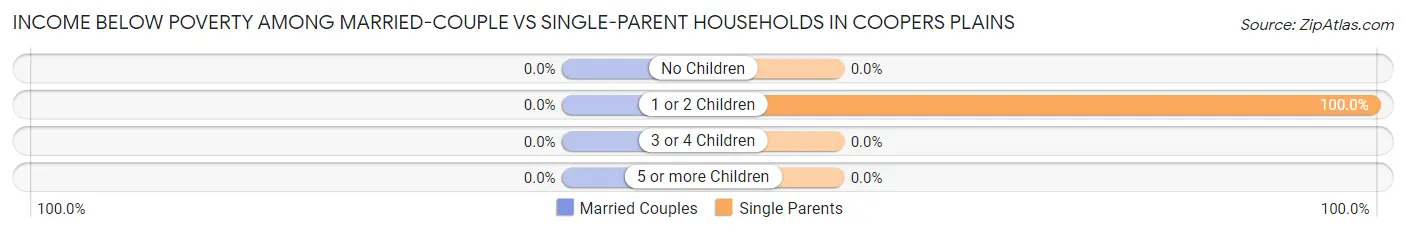
| Children | Married-Couple Families | Single-Parent Households |
| No Children | 0 (0.0%) | 0 (0.0%) |
| 1 or 2 Children | 0 (0.0%) | 7 (100.0%) |
| 3 or 4 Children | 0 (0.0%) | 0 (0.0%) |
| 5 or more Children | 0 (0.0%) | 0 (0.0%) |
| Total | 0 (0.0%) | 7 (33.3%) |
Race in Coopers Plains
The most populous races in Coopers Plains are White / Caucasian (307 | 71.1%), Black / African American (75 | 17.4%), and Two or more Races (50 | 11.6%).
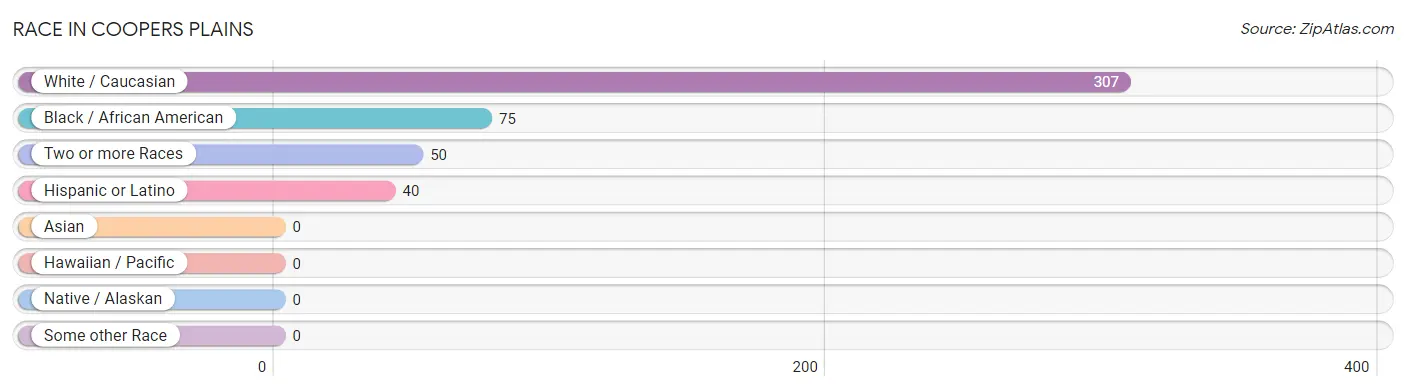
| Race | # Population | % Population |
| Asian | 0 | 0.0% |
| Black / African American | 75 | 17.4% |
| Hawaiian / Pacific | 0 | 0.0% |
| Hispanic or Latino | 40 | 9.3% |
| Native / Alaskan | 0 | 0.0% |
| White / Caucasian | 307 | 71.1% |
| Two or more Races | 50 | 11.6% |
| Some other Race | 0 | 0.0% |
| Total | 432 | 100.0% |
Ancestry in Coopers Plains
The most populous ancestries reported in Coopers Plains are German (147 | 34.0%), English (103 | 23.8%), Irish (79 | 18.3%), Central American (40 | 9.3%), and Honduran (40 | 9.3%), together accounting for 94.7% of all Coopers Plains residents.
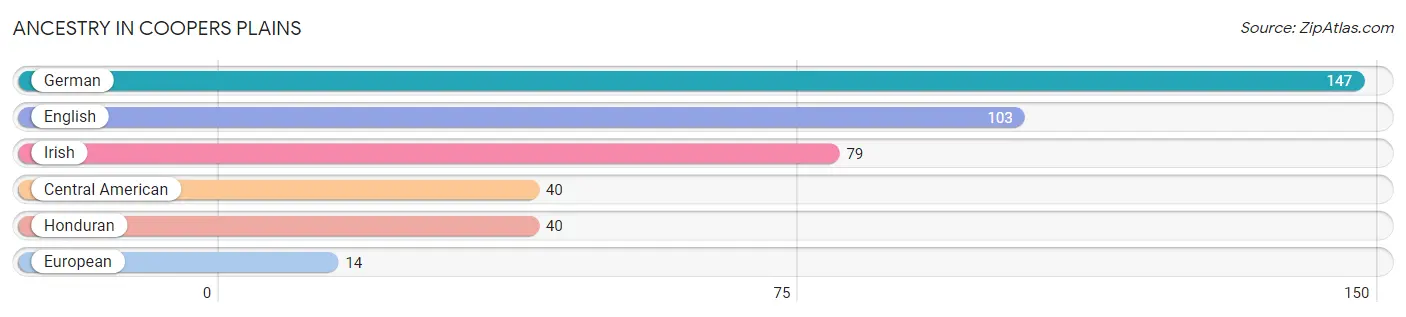
| Ancestry | # Population | % Population |
| Central American | 40 | 9.3% |
| English | 103 | 23.8% |
| European | 14 | 3.2% |
| German | 147 | 34.0% |
| Honduran | 40 | 9.3% |
| Irish | 79 | 18.3% | View All 6 Rows |
Immigrants in Coopers Plains

| Immigration Origin | # Population | % Population | View All 0 Rows |
Sex and Age in Coopers Plains
Sex and Age in Coopers Plains
The most populous age groups in Coopers Plains are Under 5 Years (40 | 19.8%) for men and 55 to 59 Years (69 | 30.0%) for women.
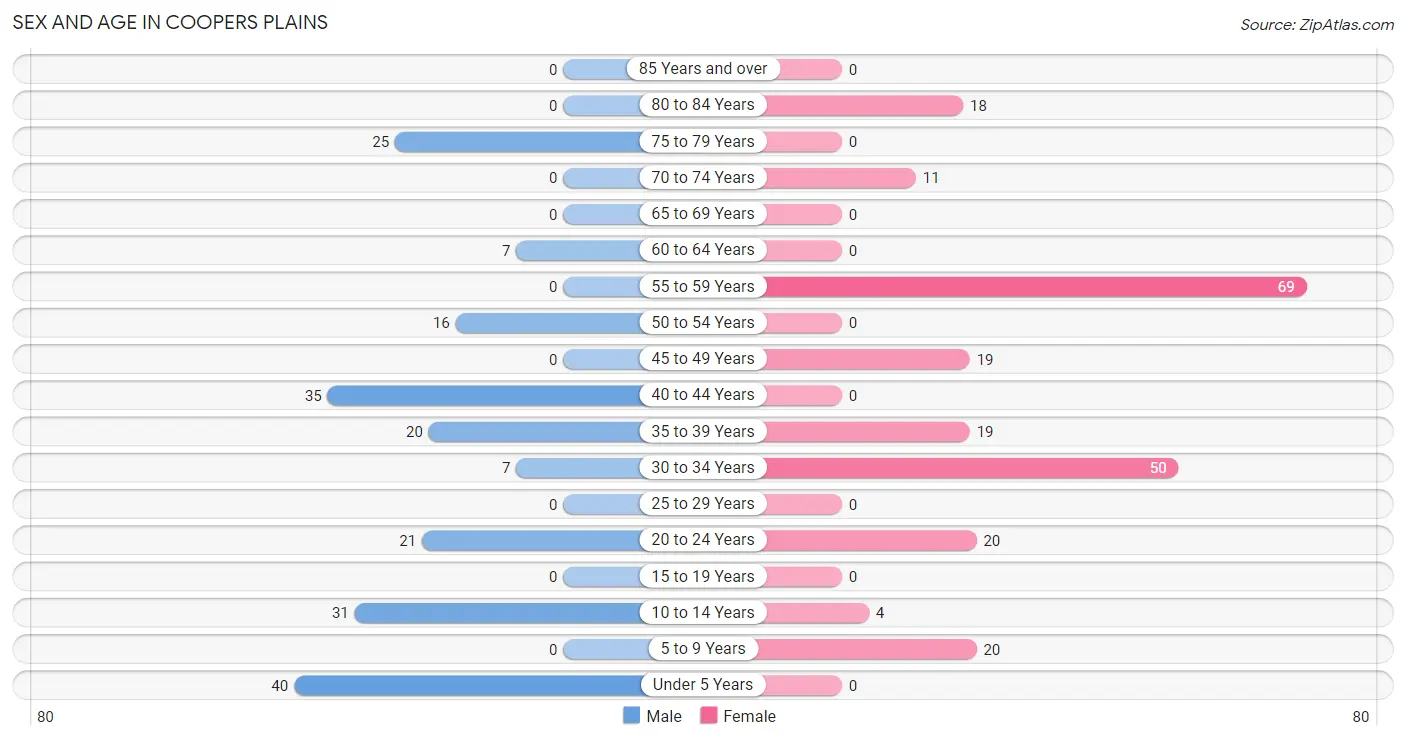
| Age Bracket | Male | Female |
| Under 5 Years | 40 (19.8%) | 0 (0.0%) |
| 5 to 9 Years | 0 (0.0%) | 20 (8.7%) |
| 10 to 14 Years | 31 (15.3%) | 4 (1.7%) |
| 15 to 19 Years | 0 (0.0%) | 0 (0.0%) |
| 20 to 24 Years | 21 (10.4%) | 20 (8.7%) |
| 25 to 29 Years | 0 (0.0%) | 0 (0.0%) |
| 30 to 34 Years | 7 (3.5%) | 50 (21.7%) |
| 35 to 39 Years | 20 (9.9%) | 19 (8.3%) |
| 40 to 44 Years | 35 (17.3%) | 0 (0.0%) |
| 45 to 49 Years | 0 (0.0%) | 19 (8.3%) |
| 50 to 54 Years | 16 (7.9%) | 0 (0.0%) |
| 55 to 59 Years | 0 (0.0%) | 69 (30.0%) |
| 60 to 64 Years | 7 (3.5%) | 0 (0.0%) |
| 65 to 69 Years | 0 (0.0%) | 0 (0.0%) |
| 70 to 74 Years | 0 (0.0%) | 11 (4.8%) |
| 75 to 79 Years | 25 (12.4%) | 0 (0.0%) |
| 80 to 84 Years | 0 (0.0%) | 18 (7.8%) |
| 85 Years and over | 0 (0.0%) | 0 (0.0%) |
| Total | 202 (100.0%) | 230 (100.0%) |
Families and Households in Coopers Plains
Median Family Size in Coopers Plains
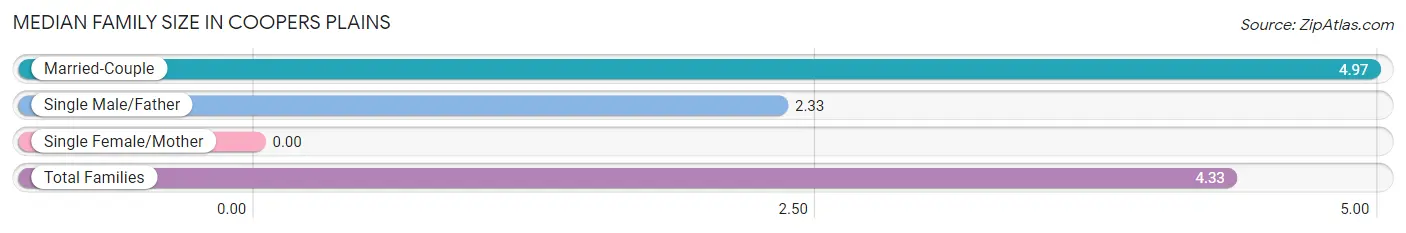
| Family Type | # Families | Family Size |
| Married-Couple | 65 (75.6%) | 4.97 |
| Single Male/Father | 21 (24.4%) | 2.33 |
| Single Female/Mother | 0 (0.0%) | - |
| Total Families | 86 (100.0%) | 4.33 |
Median Household Size in Coopers Plains
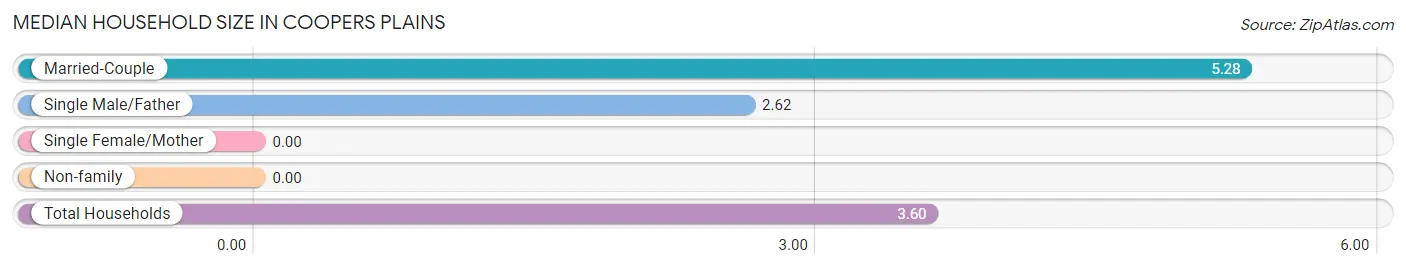
| Household Type | # Households | Household Size |
| Married-Couple | 65 (54.2%) | 5.28 |
| Single Male/Father | 21 (17.5%) | 2.62 |
| Single Female/Mother | 0 (0.0%) | - |
| Non-family | 34 (28.3%) | - |
| Total Households | 120 (100.0%) | 3.60 |
Household Size by Marriage Status in Coopers Plains
Out of a total of 120 households in Coopers Plains, 86 (71.7%) are family households, while 34 (28.3%) are nonfamily households. The most numerous type of family households are 4-person households, comprising 46, and the most common type of nonfamily households are 1-person households, comprising 34.
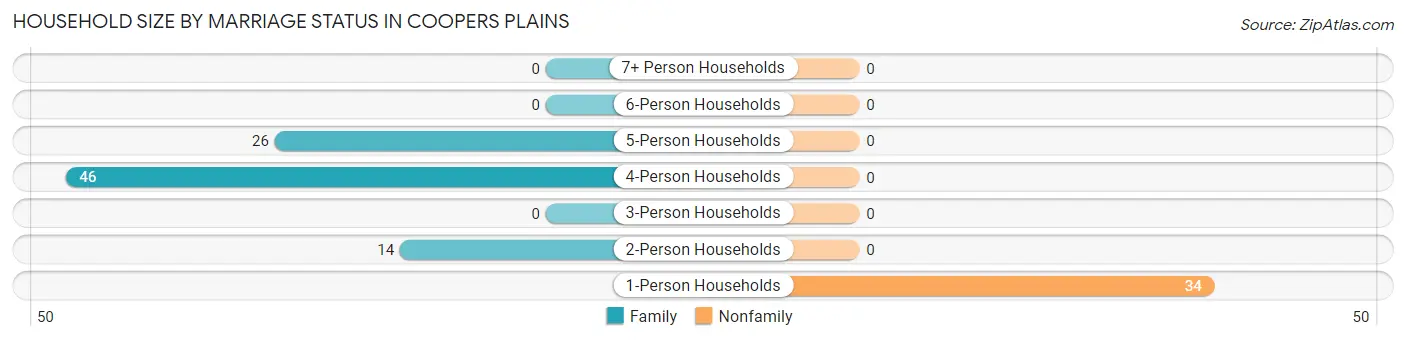
| Household Size | Family Households | Nonfamily Households |
| 1-Person Households | - | 34 (28.3%) |
| 2-Person Households | 14 (11.7%) | 0 (0.0%) |
| 3-Person Households | 0 (0.0%) | 0 (0.0%) |
| 4-Person Households | 46 (38.3%) | 0 (0.0%) |
| 5-Person Households | 26 (21.7%) | 0 (0.0%) |
| 6-Person Households | 0 (0.0%) | 0 (0.0%) |
| 7+ Person Households | 0 (0.0%) | 0 (0.0%) |
| Total | 86 (71.7%) | 34 (28.3%) |
Female Fertility in Coopers Plains
Fertility by Age in Coopers Plains
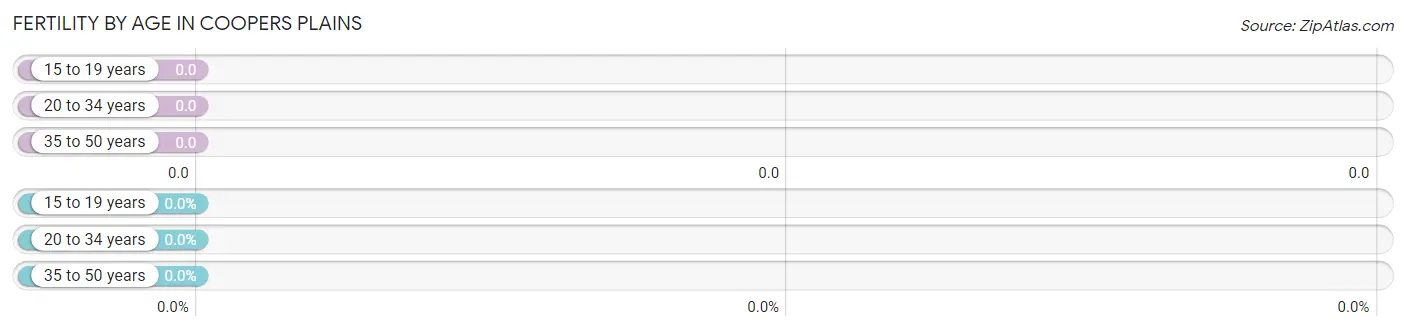
| Age Bracket | Women with Births | Births / 1,000 Women |
| 15 to 19 years | 0 (0.0%) | 0.0 |
| 20 to 34 years | 0 (0.0%) | 0.0 |
| 35 to 50 years | 0 (0.0%) | 0.0 |
| Total | 0 (0.0%) | 0.0 |
Fertility by Age by Marriage Status in Coopers Plains
| Age Bracket | Married | Unmarried |
| 15 to 19 years | 0 (0.0%) | 0 (0.0%) |
| 20 to 34 years | 0 (0.0%) | 0 (0.0%) |
| 35 to 50 years | 0 (0.0%) | 0 (0.0%) |
| Total | 0 (0.0%) | 0 (0.0%) |
Fertility by Education in Coopers Plains
| Educational Attainment | Women with Births | Births / 1,000 Women |
| Less than High School | 0 (0.0%) | 0.0 |
| High School Diploma | 0 (0.0%) | 0.0 |
| College or Associate's Degree | 0 (0.0%) | 0.0 |
| Bachelor's Degree | 0 (0.0%) | 0.0 |
| Graduate Degree | 0 (0.0%) | 0.0 |
| Total | 0 (0.0%) | 0.0 |
Fertility by Education by Marriage Status in Coopers Plains
| Educational Attainment | Married | Unmarried |
| Less than High School | 0 (0.0%) | 0 (0.0%) |
| High School Diploma | 0 (0.0%) | 0 (0.0%) |
| College or Associate's Degree | 0 (0.0%) | 0 (0.0%) |
| Bachelor's Degree | 0 (0.0%) | 0 (0.0%) |
| Graduate Degree | 0 (0.0%) | 0 (0.0%) |
| Total | 0 (0.0%) | 0 (0.0%) |
Employment Characteristics in Coopers Plains
Employment by Class of Employer in Coopers Plains
Among the 250 employed individuals in Coopers Plains, private company employees (181 | 72.4%), self-employed (incorporated) (63 | 25.2%), and not-for-profit organizations (6 | 2.4%) make up the most common classes of employment.
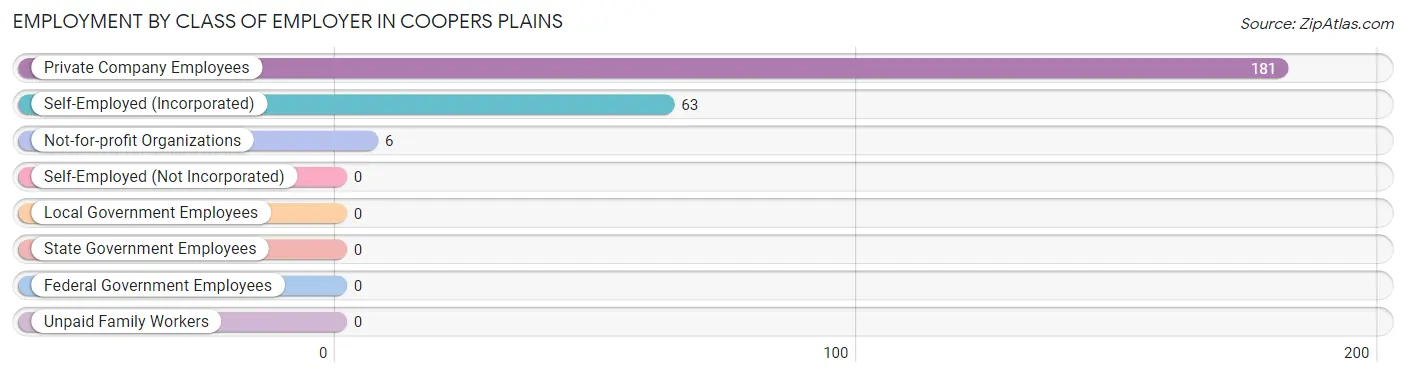
| Employer Class | # Employees | % Employees |
| Private Company Employees | 181 | 72.4% |
| Self-Employed (Incorporated) | 63 | 25.2% |
| Self-Employed (Not Incorporated) | 0 | 0.0% |
| Not-for-profit Organizations | 6 | 2.4% |
| Local Government Employees | 0 | 0.0% |
| State Government Employees | 0 | 0.0% |
| Federal Government Employees | 0 | 0.0% |
| Unpaid Family Workers | 0 | 0.0% |
| Total | 250 | 100.0% |
Employment Status by Age in Coopers Plains
According to the labor force statistics for Coopers Plains, out of the total population over 16 years of age (337), 76.3% or 257 individuals are in the labor force, with 2.7% or 7 of them unemployed. The age group with the highest labor force participation rate is 20 to 24 years, with 100.0% or 41 individuals in the labor force. Within the labor force, the 30 to 34 years age range has the highest percentage of unemployed individuals, with 12.3% or 7 of them being unemployed.
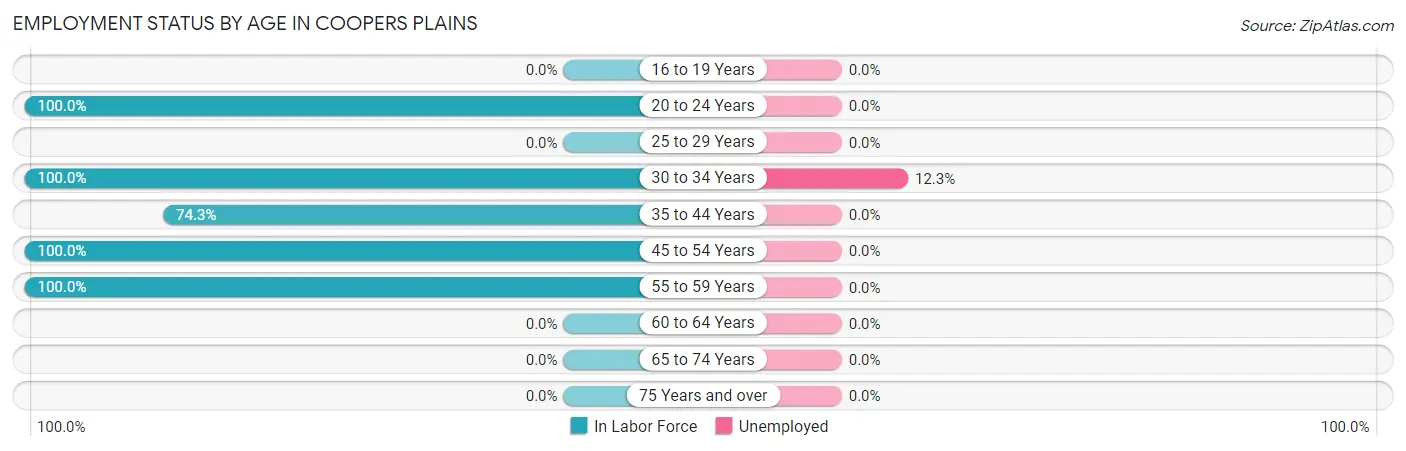
| Age Bracket | In Labor Force | Unemployed |
| 16 to 19 Years | 0 (0.0%) | 0 (0.0%) |
| 20 to 24 Years | 41 (100.0%) | 0 (0.0%) |
| 25 to 29 Years | 0 (0.0%) | 0 (0.0%) |
| 30 to 34 Years | 57 (100.0%) | 7 (12.3%) |
| 35 to 44 Years | 55 (74.3%) | 0 (0.0%) |
| 45 to 54 Years | 35 (100.0%) | 0 (0.0%) |
| 55 to 59 Years | 69 (100.0%) | 0 (0.0%) |
| 60 to 64 Years | 0 (0.0%) | 0 (0.0%) |
| 65 to 74 Years | 0 (0.0%) | 0 (0.0%) |
| 75 Years and over | 0 (0.0%) | 0 (0.0%) |
| Total | 257 (76.3%) | 7 (2.7%) |
Employment Status by Educational Attainment in Coopers Plains
According to labor force statistics for Coopers Plains, 89.3% of individuals (216) out of the total population between 25 and 64 years of age (242) are in the labor force, with 3.2% or 7 of them being unemployed. The group with the highest labor force participation rate are those with the educational attainment of high school diploma, with 100.0% or 41 individuals in the labor force. Within the labor force, individuals with college / associate degree education have the highest percentage of unemployment, with 6.3% or 7 of them being unemployed.
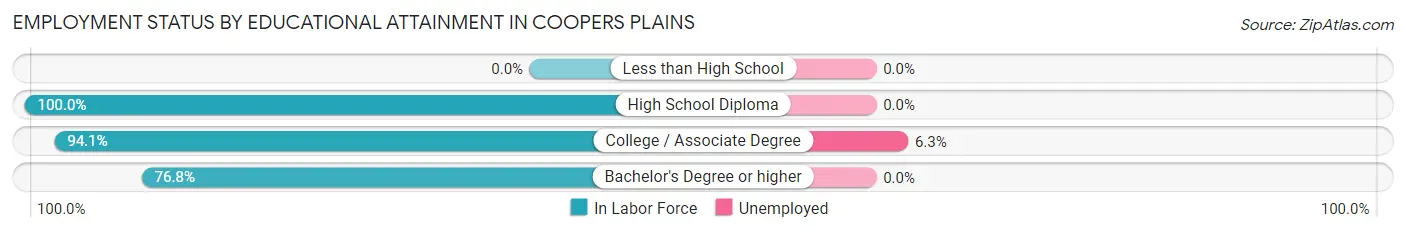
| Educational Attainment | In Labor Force | Unemployed |
| Less than High School | 0 (0.0%) | 0 (0.0%) |
| High School Diploma | 41 (100.0%) | 0 (0.0%) |
| College / Associate Degree | 112 (94.1%) | 7 (6.3%) |
| Bachelor's Degree or higher | 63 (76.8%) | 0 (0.0%) |
| Total | 216 (89.3%) | 8 (3.2%) |
Employment Occupations by Sex in Coopers Plains
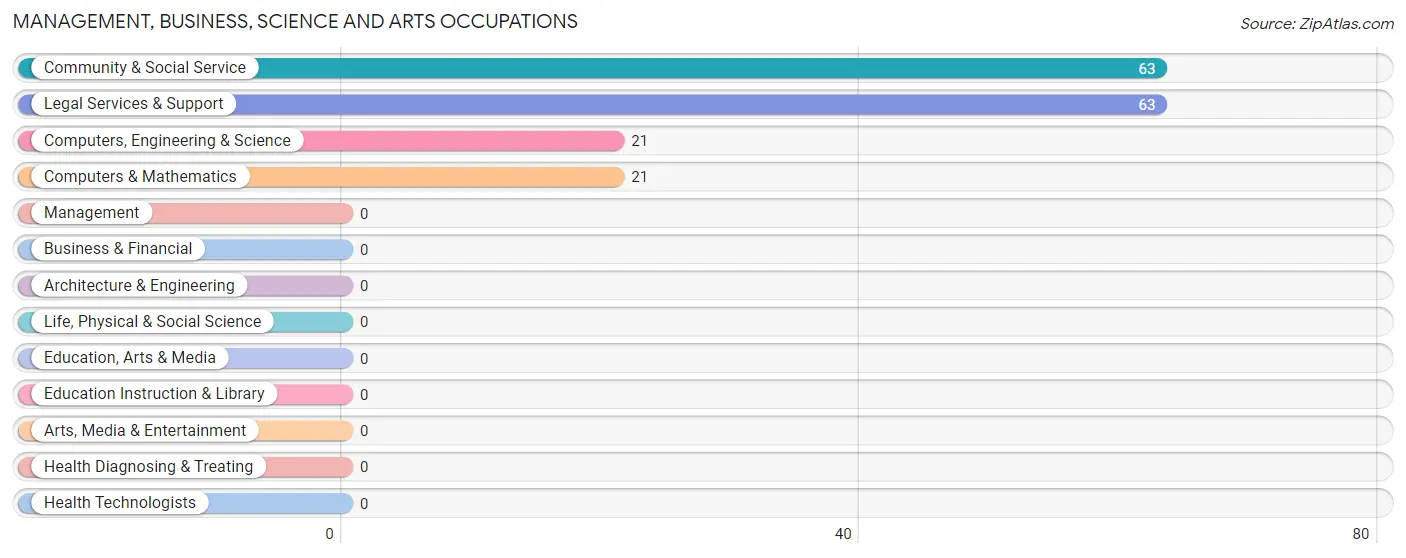
Management, Business, Science and Arts Occupations
The most common Management, Business, Science and Arts occupations in Coopers Plains are Community & Social Service (63 | 25.2%), Legal Services & Support (63 | 25.2%), Computers, Engineering & Science (21 | 8.4%), and Computers & Mathematics (21 | 8.4%).
Management, Business, Science and Arts Occupations by Sex
Within the Management, Business, Science and Arts occupations in Coopers Plains, the most male-oriented occupations are Computers, Engineering & Science (100.0%), and Computers & Mathematics (100.0%), while the most female-oriented occupations are Community & Social Service (100.0%), and Legal Services & Support (100.0%).
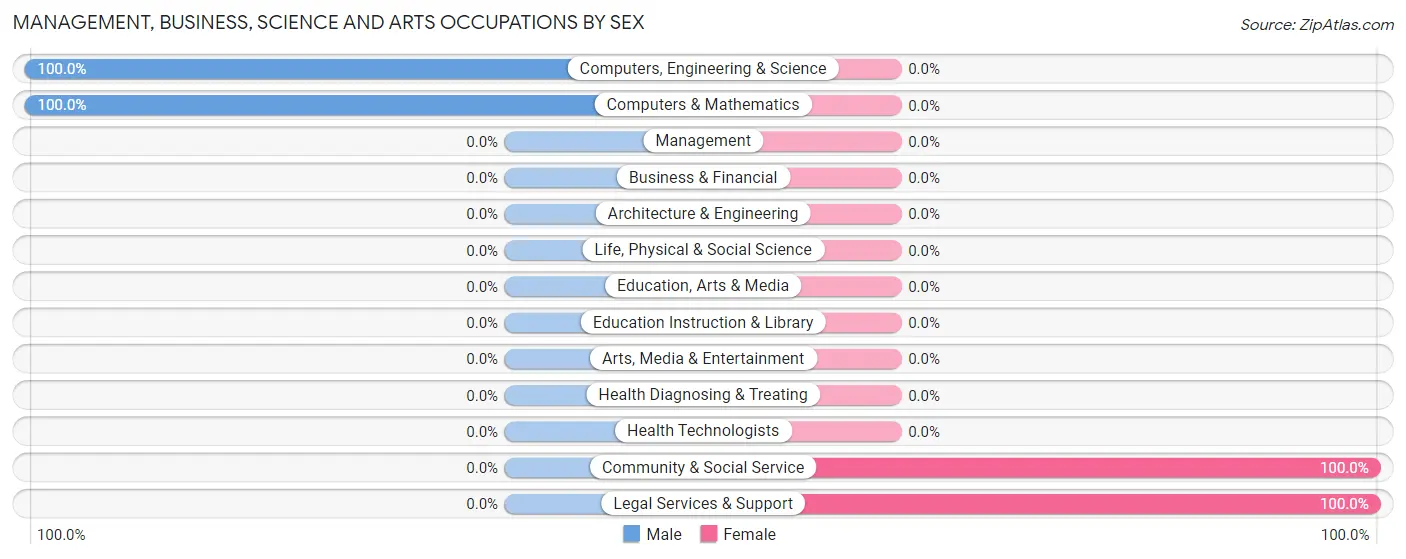
| Occupation | Male | Female |
| Management | 0 (0.0%) | 0 (0.0%) |
| Business & Financial | 0 (0.0%) | 0 (0.0%) |
| Computers, Engineering & Science | 21 (100.0%) | 0 (0.0%) |
| Computers & Mathematics | 21 (100.0%) | 0 (0.0%) |
| Architecture & Engineering | 0 (0.0%) | 0 (0.0%) |
| Life, Physical & Social Science | 0 (0.0%) | 0 (0.0%) |
| Community & Social Service | 0 (0.0%) | 63 (100.0%) |
| Education, Arts & Media | 0 (0.0%) | 0 (0.0%) |
| Legal Services & Support | 0 (0.0%) | 63 (100.0%) |
| Education Instruction & Library | 0 (0.0%) | 0 (0.0%) |
| Arts, Media & Entertainment | 0 (0.0%) | 0 (0.0%) |
| Health Diagnosing & Treating | 0 (0.0%) | 0 (0.0%) |
| Health Technologists | 0 (0.0%) | 0 (0.0%) |
| Total (Category) | 21 (25.0%) | 63 (75.0%) |
| Total (Overall) | 92 (36.8%) | 158 (63.2%) |
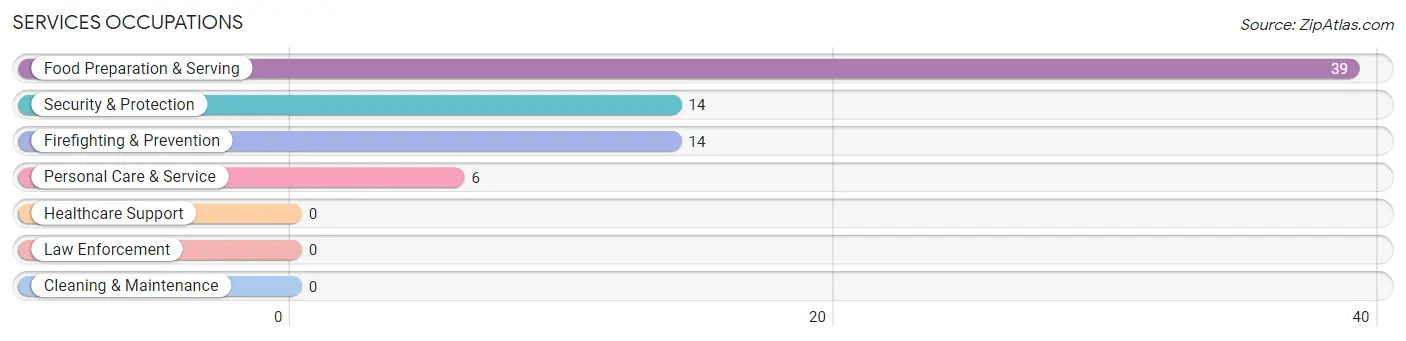
Services Occupations
The most common Services occupations in Coopers Plains are Food Preparation & Serving (39 | 15.6%), Security & Protection (14 | 5.6%), Firefighting & Prevention (14 | 5.6%), and Personal Care & Service (6 | 2.4%).
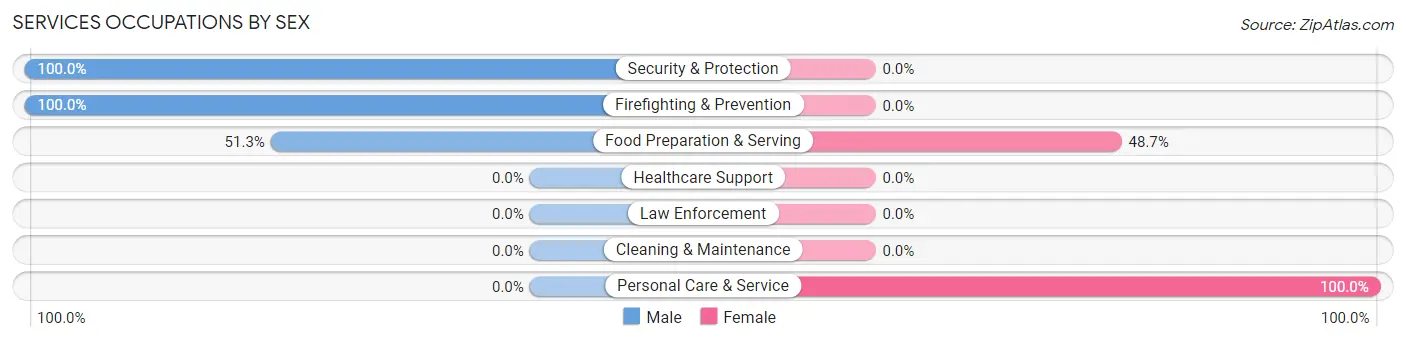
Services Occupations by Sex
Within the Services occupations in Coopers Plains, the most male-oriented occupations are Security & Protection (100.0%), Firefighting & Prevention (100.0%), and Food Preparation & Serving (51.3%), while the most female-oriented occupations are Personal Care & Service (100.0%), and Food Preparation & Serving (48.7%).
| Occupation | Male | Female |
| Healthcare Support | 0 (0.0%) | 0 (0.0%) |
| Security & Protection | 14 (100.0%) | 0 (0.0%) |
| Firefighting & Prevention | 14 (100.0%) | 0 (0.0%) |
| Law Enforcement | 0 (0.0%) | 0 (0.0%) |
| Food Preparation & Serving | 20 (51.3%) | 19 (48.7%) |
| Cleaning & Maintenance | 0 (0.0%) | 0 (0.0%) |
| Personal Care & Service | 0 (0.0%) | 6 (100.0%) |
| Total (Category) | 34 (57.6%) | 25 (42.4%) |
| Total (Overall) | 92 (36.8%) | 158 (63.2%) |
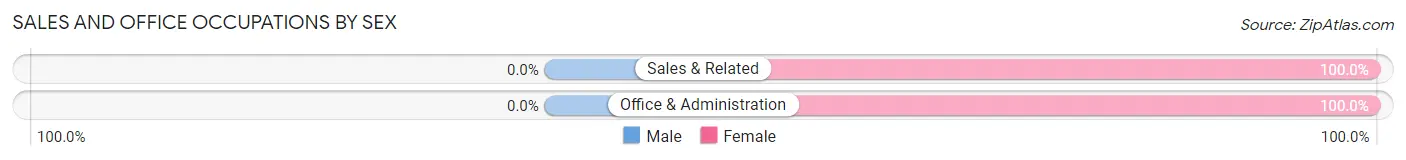
Sales and Office Occupations
The most common Sales and Office occupations in Coopers Plains are Sales & Related (50 | 20.0%), and Office & Administration (20 | 8.0%).

Sales and Office Occupations by Sex
| Occupation | Male | Female |
| Sales & Related | 0 (0.0%) | 50 (100.0%) |
| Office & Administration | 0 (0.0%) | 20 (100.0%) |
| Total (Category) | 0 (0.0%) | 70 (100.0%) |
| Total (Overall) | 92 (36.8%) | 158 (63.2%) |
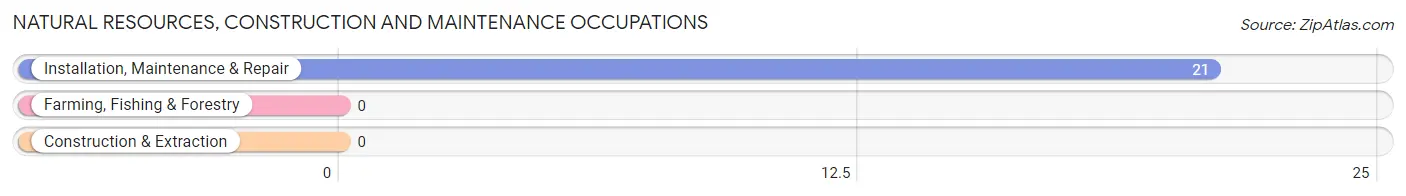
Natural Resources, Construction and Maintenance Occupations
The most common Natural Resources, Construction and Maintenance occupations in Coopers Plains are , and Installation, Maintenance & Repair (21 | 8.4%).
Natural Resources, Construction and Maintenance Occupations by Sex
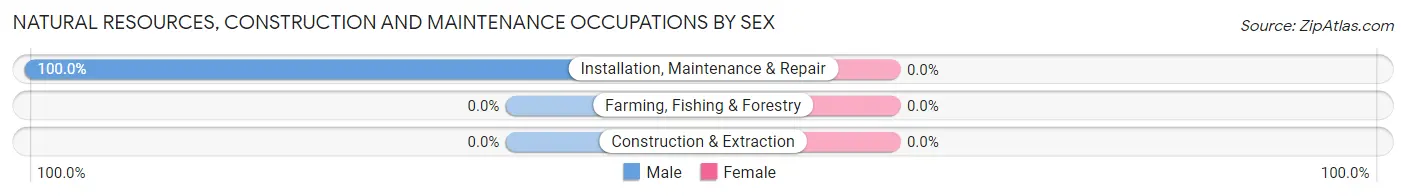
| Occupation | Male | Female |
| Farming, Fishing & Forestry | 0 (0.0%) | 0 (0.0%) |
| Construction & Extraction | 0 (0.0%) | 0 (0.0%) |
| Installation, Maintenance & Repair | 21 (100.0%) | 0 (0.0%) |
| Total (Category) | 21 (100.0%) | 0 (0.0%) |
| Total (Overall) | 92 (36.8%) | 158 (63.2%) |
Production, Transportation and Moving Occupations
The most common Production, Transportation and Moving occupations in Coopers Plains are , and Production (16 | 6.4%).
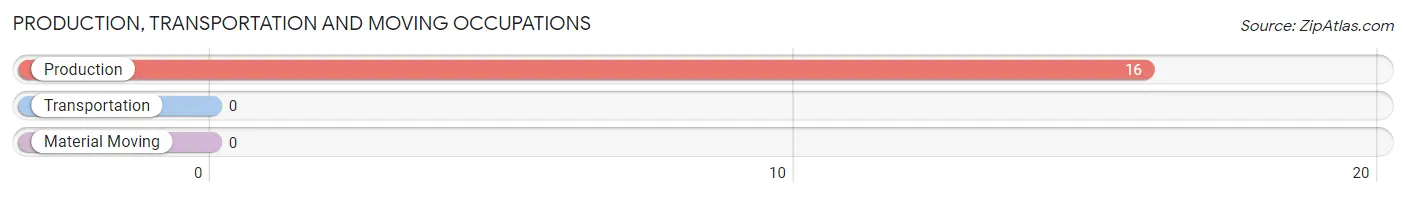
Production, Transportation and Moving Occupations by Sex
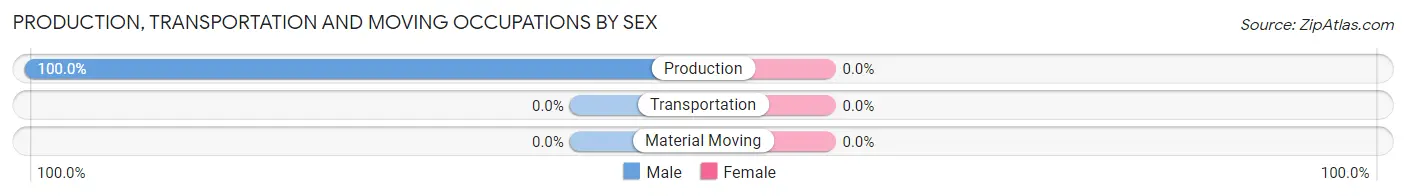
| Occupation | Male | Female |
| Production | 16 (100.0%) | 0 (0.0%) |
| Transportation | 0 (0.0%) | 0 (0.0%) |
| Material Moving | 0 (0.0%) | 0 (0.0%) |
| Total (Category) | 16 (100.0%) | 0 (0.0%) |
| Total (Overall) | 92 (36.8%) | 158 (63.2%) |
Employment Industries by Sex in Coopers Plains
Employment Industries in Coopers Plains
The major employment industries in Coopers Plains include Retail Trade (91 | 36.4%), Professional & Scientific (63 | 25.2%), Manufacturing (51 | 20.4%), Accommodation & Food Services (39 | 15.6%), and Health Care & Social Assistance (6 | 2.4%).
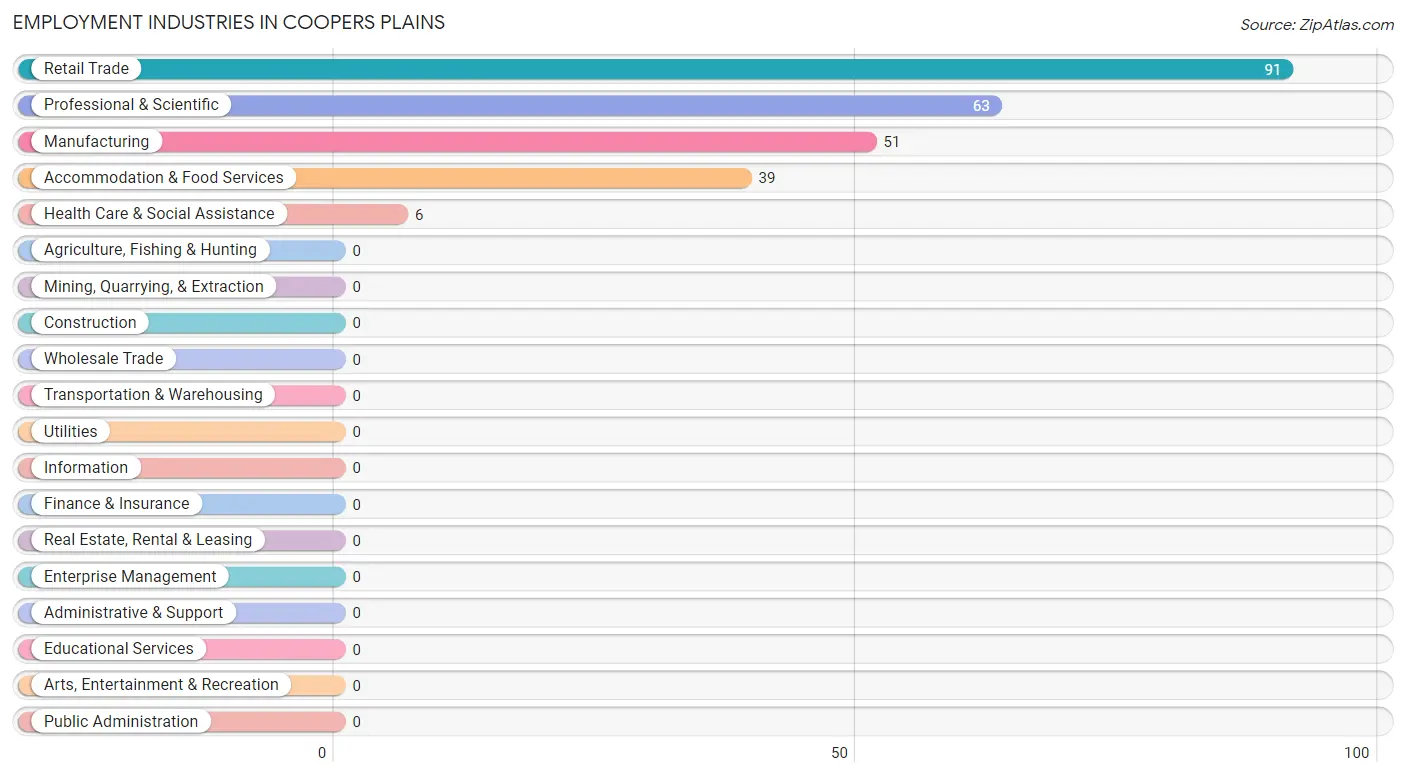
Employment Industries by Sex in Coopers Plains
The Coopers Plains industries that see more men than women are Manufacturing (100.0%), Accommodation & Food Services (51.3%), and Retail Trade (23.1%), whereas the industries that tend to have a higher number of women are Professional & Scientific (100.0%), Health Care & Social Assistance (100.0%), and Retail Trade (76.9%).
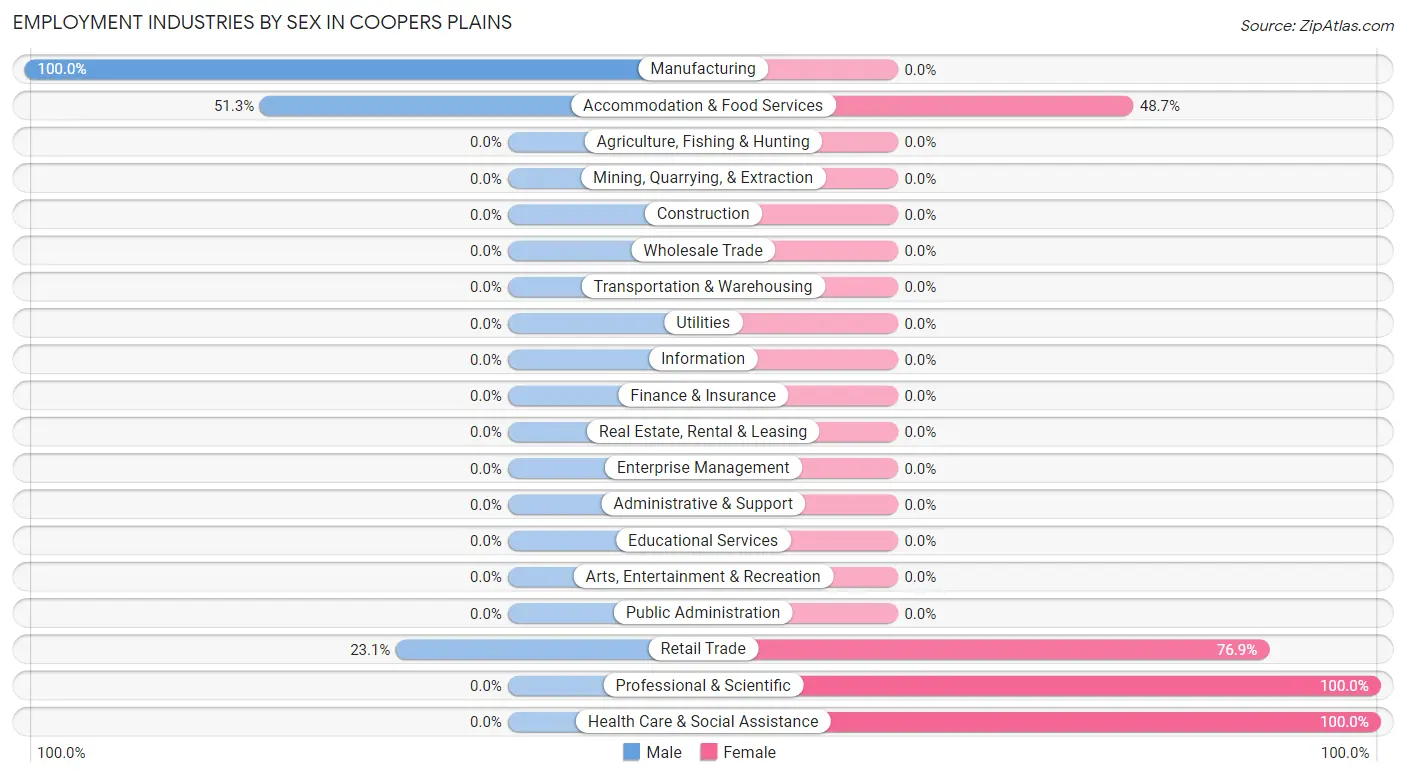
| Industry | Male | Female |
| Agriculture, Fishing & Hunting | 0 (0.0%) | 0 (0.0%) |
| Mining, Quarrying, & Extraction | 0 (0.0%) | 0 (0.0%) |
| Construction | 0 (0.0%) | 0 (0.0%) |
| Manufacturing | 51 (100.0%) | 0 (0.0%) |
| Wholesale Trade | 0 (0.0%) | 0 (0.0%) |
| Retail Trade | 21 (23.1%) | 70 (76.9%) |
| Transportation & Warehousing | 0 (0.0%) | 0 (0.0%) |
| Utilities | 0 (0.0%) | 0 (0.0%) |
| Information | 0 (0.0%) | 0 (0.0%) |
| Finance & Insurance | 0 (0.0%) | 0 (0.0%) |
| Real Estate, Rental & Leasing | 0 (0.0%) | 0 (0.0%) |
| Professional & Scientific | 0 (0.0%) | 63 (100.0%) |
| Enterprise Management | 0 (0.0%) | 0 (0.0%) |
| Administrative & Support | 0 (0.0%) | 0 (0.0%) |
| Educational Services | 0 (0.0%) | 0 (0.0%) |
| Health Care & Social Assistance | 0 (0.0%) | 6 (100.0%) |
| Arts, Entertainment & Recreation | 0 (0.0%) | 0 (0.0%) |
| Accommodation & Food Services | 20 (51.3%) | 19 (48.7%) |
| Public Administration | 0 (0.0%) | 0 (0.0%) |
| Total | 92 (36.8%) | 158 (63.2%) |
Education in Coopers Plains
School Enrollment in Coopers Plains
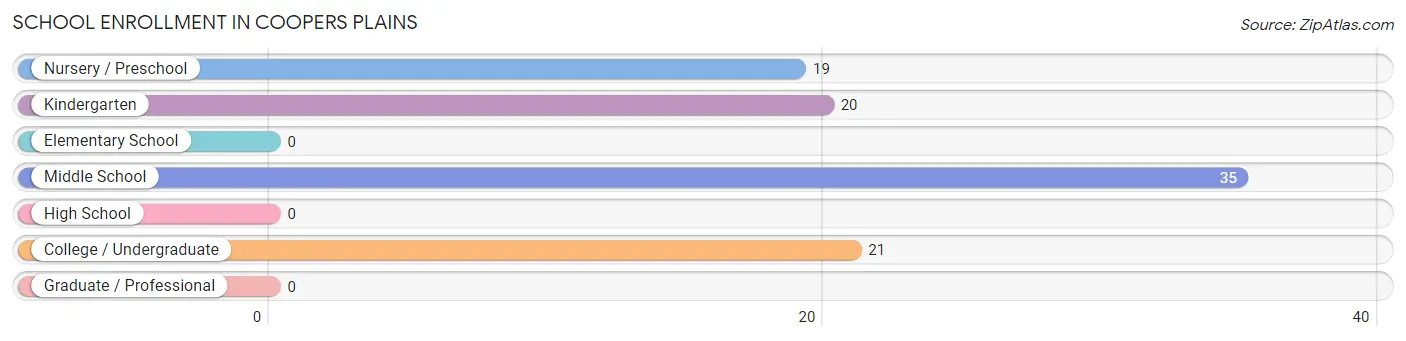
The most common levels of schooling among the 95 students in Coopers Plains are middle school (35 | 36.8%), college / undergraduate (21 | 22.1%), and kindergarten (20 | 21.0%).
| School Level | # Students | % Students |
| Nursery / Preschool | 19 | 20.0% |
| Kindergarten | 20 | 21.0% |
| Elementary School | 0 | 0.0% |
| Middle School | 35 | 36.8% |
| High School | 0 | 0.0% |
| College / Undergraduate | 21 | 22.1% |
| Graduate / Professional | 0 | 0.0% |
| Total | 95 | 100.0% |
School Enrollment by Age by Funding Source in Coopers Plains
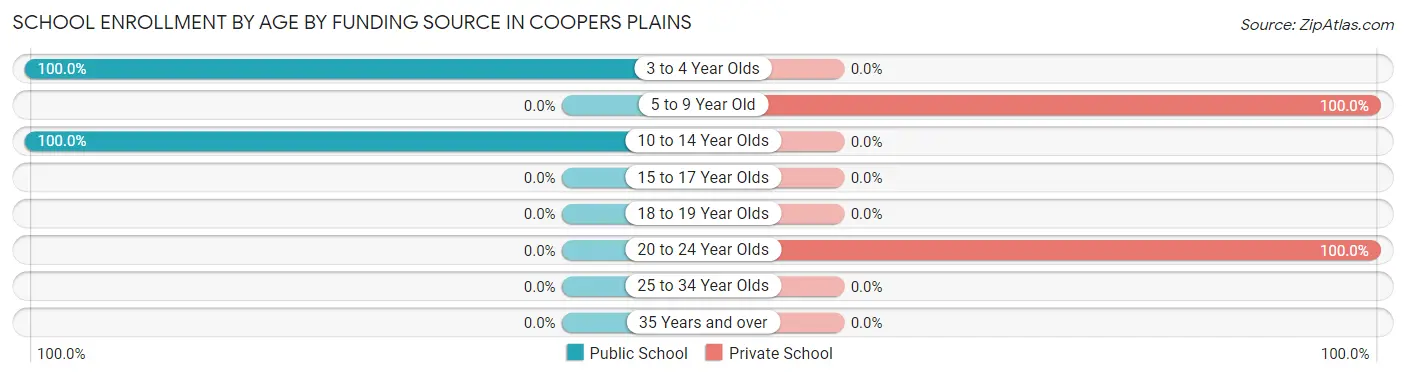
Out of a total of 95 students who are enrolled in schools in Coopers Plains, 41 (43.2%) attend a private institution, while the remaining 54 (56.8%) are enrolled in public schools. The age group of 5 to 9 year old has the highest likelihood of being enrolled in private schools, with 20 (100.0% in the age bracket) enrolled. Conversely, the age group of 3 to 4 year olds has the lowest likelihood of being enrolled in a private school, with 19 (100.0% in the age bracket) attending a public institution.
| Age Bracket | Public School | Private School |
| 3 to 4 Year Olds | 19 (100.0%) | 0 (0.0%) |
| 5 to 9 Year Old | 0 (0.0%) | 20 (100.0%) |
| 10 to 14 Year Olds | 35 (100.0%) | 0 (0.0%) |
| 15 to 17 Year Olds | 0 (0.0%) | 0 (0.0%) |
| 18 to 19 Year Olds | 0 (0.0%) | 0 (0.0%) |
| 20 to 24 Year Olds | 0 (0.0%) | 21 (100.0%) |
| 25 to 34 Year Olds | 0 (0.0%) | 0 (0.0%) |
| 35 Years and over | 0 (0.0%) | 0 (0.0%) |
| Total | 54 (56.8%) | 41 (43.2%) |
Educational Attainment by Field of Study in Coopers Plains
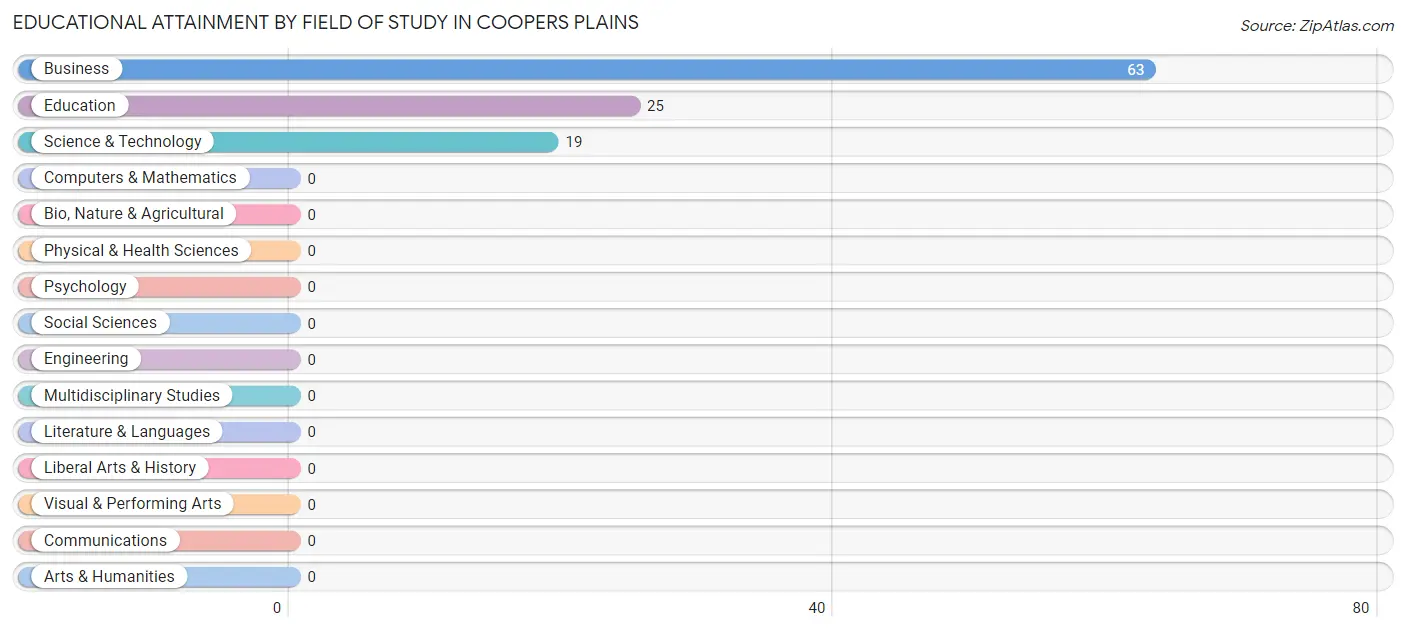
Business (63 | 58.9%), education (25 | 23.4%), and science & technology (19 | 17.8%) are the most common fields of study among 107 individuals in Coopers Plains who have obtained a bachelor's degree or higher.
| Field of Study | # Graduates | % Graduates |
| Computers & Mathematics | 0 | 0.0% |
| Bio, Nature & Agricultural | 0 | 0.0% |
| Physical & Health Sciences | 0 | 0.0% |
| Psychology | 0 | 0.0% |
| Social Sciences | 0 | 0.0% |
| Engineering | 0 | 0.0% |
| Multidisciplinary Studies | 0 | 0.0% |
| Science & Technology | 19 | 17.8% |
| Business | 63 | 58.9% |
| Education | 25 | 23.4% |
| Literature & Languages | 0 | 0.0% |
| Liberal Arts & History | 0 | 0.0% |
| Visual & Performing Arts | 0 | 0.0% |
| Communications | 0 | 0.0% |
| Arts & Humanities | 0 | 0.0% |
| Total | 107 | 100.0% |
Transportation & Commute in Coopers Plains
Vehicle Availability by Sex in Coopers Plains
The most prevalent vehicle ownership categories in Coopers Plains are males with 2 vehicles (76, accounting for 82.6%) and females with 2 vehicles (45, making up 48.1%).
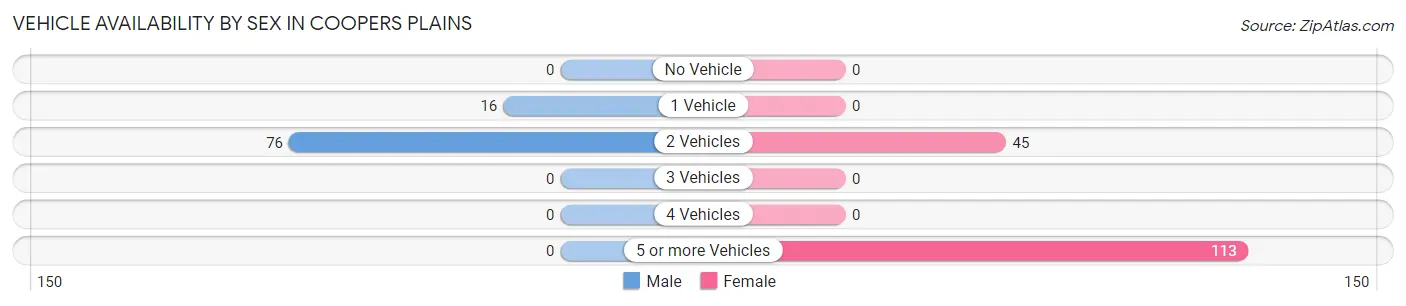
| Vehicles Available | Male | Female |
| No Vehicle | 0 (0.0%) | 0 (0.0%) |
| 1 Vehicle | 16 (17.4%) | 0 (0.0%) |
| 2 Vehicles | 76 (82.6%) | 45 (28.5%) |
| 3 Vehicles | 0 (0.0%) | 0 (0.0%) |
| 4 Vehicles | 0 (0.0%) | 0 (0.0%) |
| 5 or more Vehicles | 0 (0.0%) | 113 (71.5%) |
| Total | 92 (100.0%) | 158 (100.0%) |
Commute Time in Coopers Plains
The most frequently occuring commute durations in Coopers Plains are 20 to 24 minutes (102 commuters, 40.8%), 5 to 9 minutes (70 commuters, 28.0%), and 10 to 14 minutes (51 commuters, 20.4%).
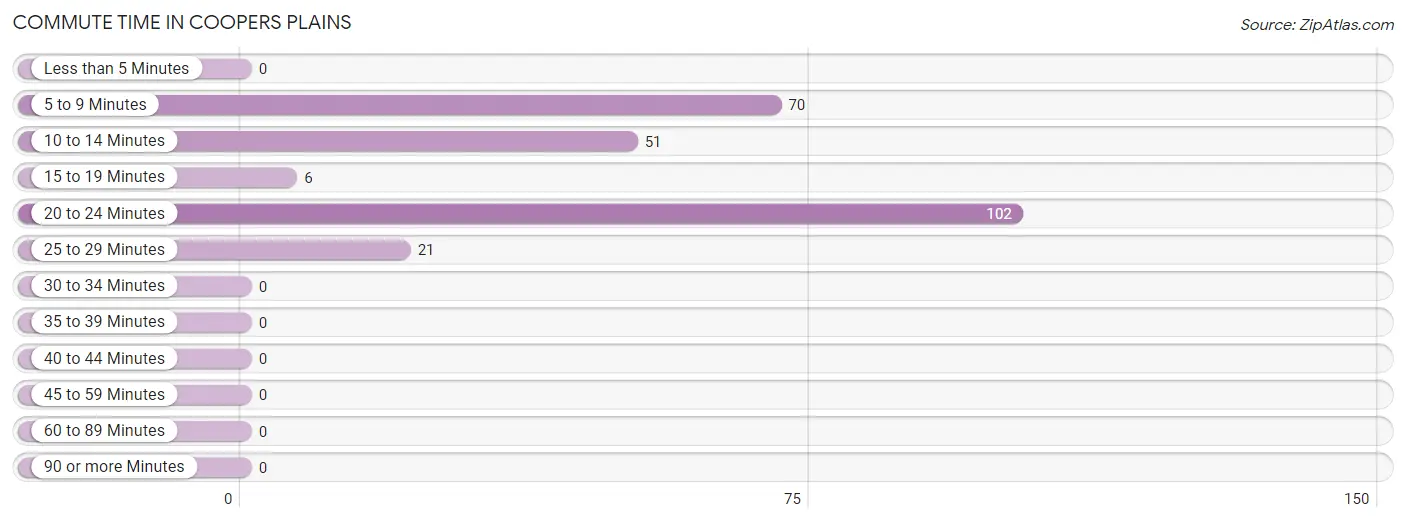
| Commute Time | # Commuters | % Commuters |
| Less than 5 Minutes | 0 | 0.0% |
| 5 to 9 Minutes | 70 | 28.0% |
| 10 to 14 Minutes | 51 | 20.4% |
| 15 to 19 Minutes | 6 | 2.4% |
| 20 to 24 Minutes | 102 | 40.8% |
| 25 to 29 Minutes | 21 | 8.4% |
| 30 to 34 Minutes | 0 | 0.0% |
| 35 to 39 Minutes | 0 | 0.0% |
| 40 to 44 Minutes | 0 | 0.0% |
| 45 to 59 Minutes | 0 | 0.0% |
| 60 to 89 Minutes | 0 | 0.0% |
| 90 or more Minutes | 0 | 0.0% |
Commute Time by Sex in Coopers Plains
The most common commute times in Coopers Plains are 10 to 14 minutes (51 commuters, 55.4%) for males and 20 to 24 minutes (102 commuters, 64.6%) for females.
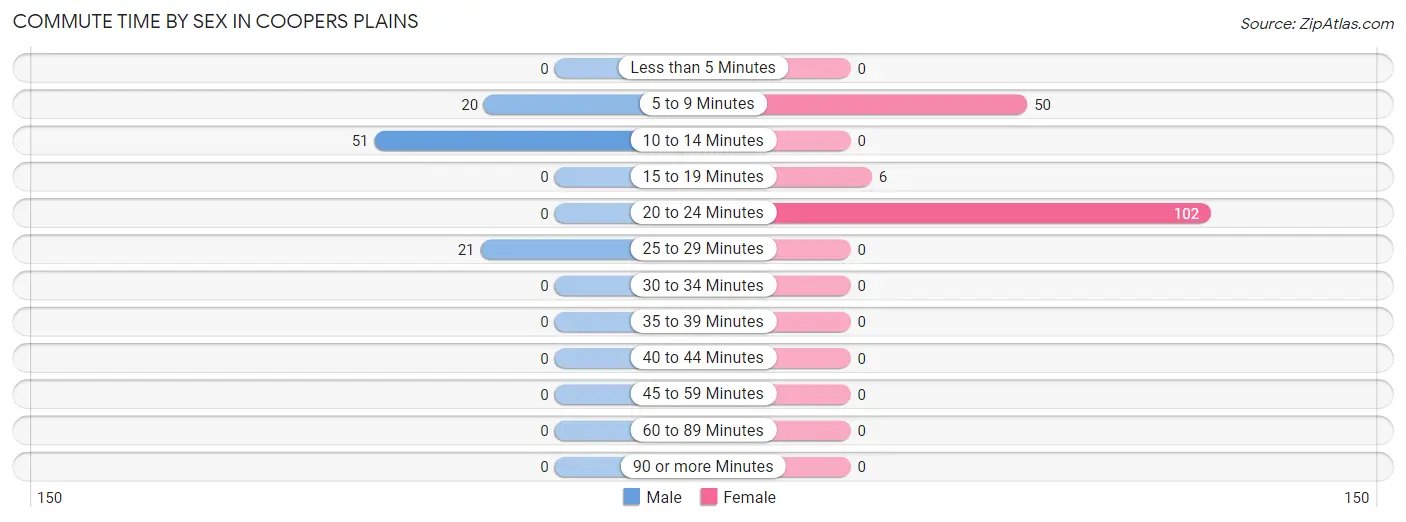
| Commute Time | Male | Female |
| Less than 5 Minutes | 0 (0.0%) | 0 (0.0%) |
| 5 to 9 Minutes | 20 (21.7%) | 50 (31.7%) |
| 10 to 14 Minutes | 51 (55.4%) | 0 (0.0%) |
| 15 to 19 Minutes | 0 (0.0%) | 6 (3.8%) |
| 20 to 24 Minutes | 0 (0.0%) | 102 (64.6%) |
| 25 to 29 Minutes | 21 (22.8%) | 0 (0.0%) |
| 30 to 34 Minutes | 0 (0.0%) | 0 (0.0%) |
| 35 to 39 Minutes | 0 (0.0%) | 0 (0.0%) |
| 40 to 44 Minutes | 0 (0.0%) | 0 (0.0%) |
| 45 to 59 Minutes | 0 (0.0%) | 0 (0.0%) |
| 60 to 89 Minutes | 0 (0.0%) | 0 (0.0%) |
| 90 or more Minutes | 0 (0.0%) | 0 (0.0%) |
Time of Departure to Work by Sex in Coopers Plains
The most frequent times of departure to work in Coopers Plains are 4:00 PM to 11:59 PM (36, 39.1%) for males and 8:30 AM to 8:59 AM (152, 96.2%) for females.
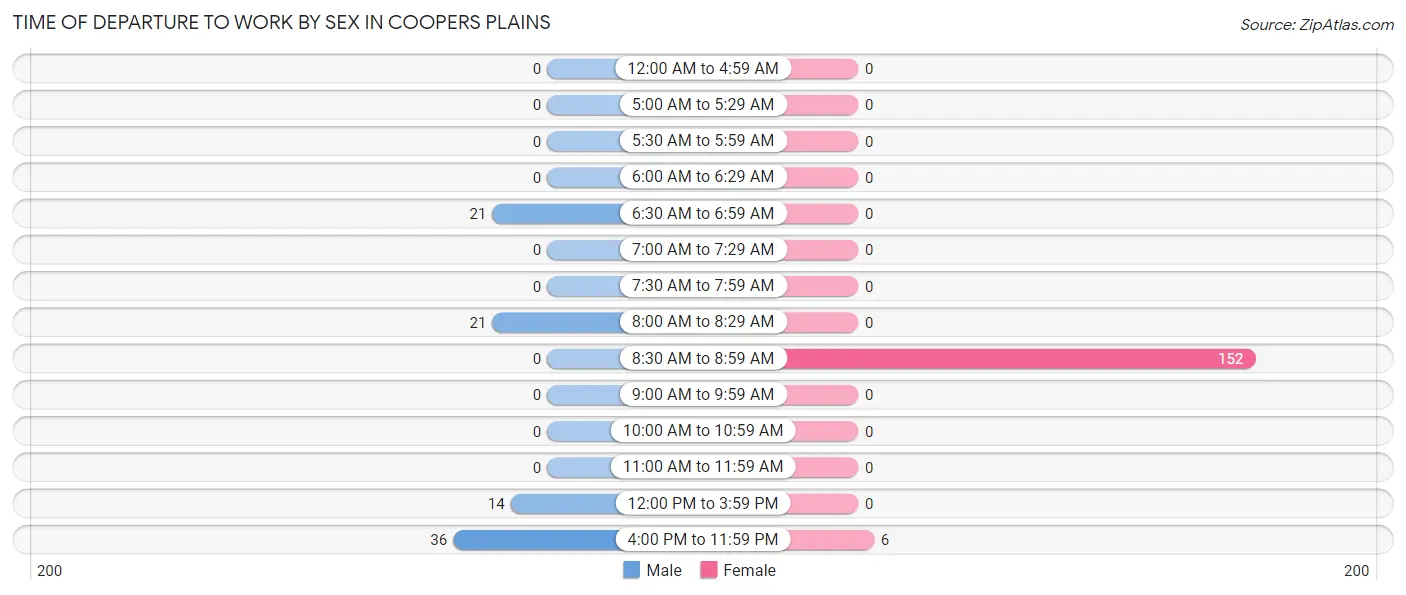
| Time of Departure | Male | Female |
| 12:00 AM to 4:59 AM | 0 (0.0%) | 0 (0.0%) |
| 5:00 AM to 5:29 AM | 0 (0.0%) | 0 (0.0%) |
| 5:30 AM to 5:59 AM | 0 (0.0%) | 0 (0.0%) |
| 6:00 AM to 6:29 AM | 0 (0.0%) | 0 (0.0%) |
| 6:30 AM to 6:59 AM | 21 (22.8%) | 0 (0.0%) |
| 7:00 AM to 7:29 AM | 0 (0.0%) | 0 (0.0%) |
| 7:30 AM to 7:59 AM | 0 (0.0%) | 0 (0.0%) |
| 8:00 AM to 8:29 AM | 21 (22.8%) | 0 (0.0%) |
| 8:30 AM to 8:59 AM | 0 (0.0%) | 152 (96.2%) |
| 9:00 AM to 9:59 AM | 0 (0.0%) | 0 (0.0%) |
| 10:00 AM to 10:59 AM | 0 (0.0%) | 0 (0.0%) |
| 11:00 AM to 11:59 AM | 0 (0.0%) | 0 (0.0%) |
| 12:00 PM to 3:59 PM | 14 (15.2%) | 0 (0.0%) |
| 4:00 PM to 11:59 PM | 36 (39.1%) | 6 (3.8%) |
| Total | 92 (100.0%) | 158 (100.0%) |
Housing Occupancy in Coopers Plains
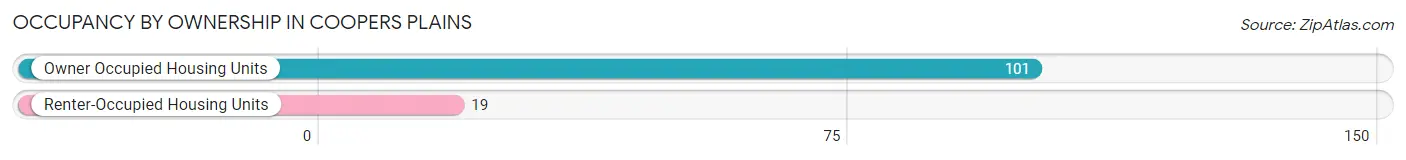
Occupancy by Ownership in Coopers Plains
Of the total 120 dwellings in Coopers Plains, owner-occupied units account for 101 (84.2%), while renter-occupied units make up 19 (15.8%).
| Occupancy | # Housing Units | % Housing Units |
| Owner Occupied Housing Units | 101 | 84.2% |
| Renter-Occupied Housing Units | 19 | 15.8% |
| Total Occupied Housing Units | 120 | 100.0% |
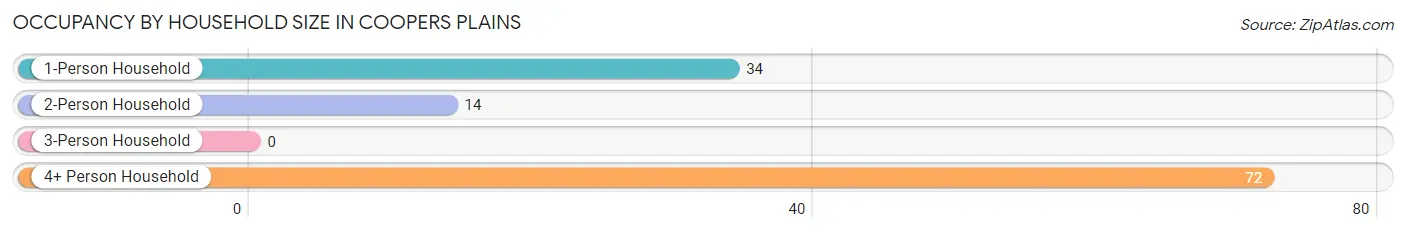
Occupancy by Household Size in Coopers Plains
| Household Size | # Housing Units | % Housing Units |
| 1-Person Household | 34 | 28.3% |
| 2-Person Household | 14 | 11.7% |
| 3-Person Household | 0 | 0.0% |
| 4+ Person Household | 72 | 60.0% |
| Total Housing Units | 120 | 100.0% |
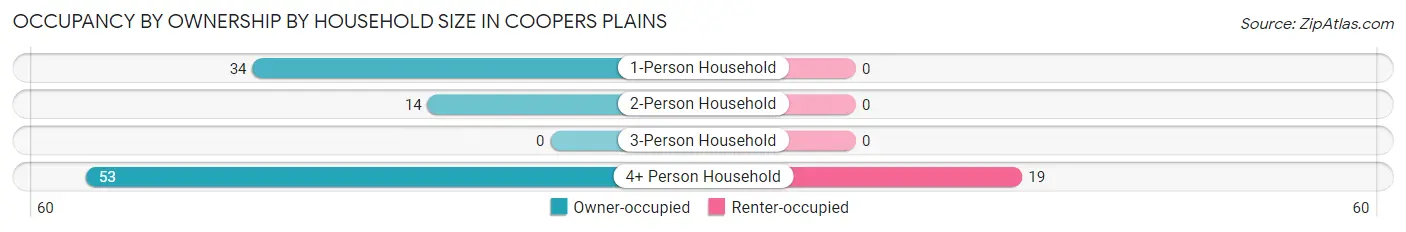
Occupancy by Ownership by Household Size in Coopers Plains
| Household Size | Owner-occupied | Renter-occupied |
| 1-Person Household | 34 (100.0%) | 0 (0.0%) |
| 2-Person Household | 14 (100.0%) | 0 (0.0%) |
| 3-Person Household | 0 (0.0%) | 0 (0.0%) |
| 4+ Person Household | 53 (73.6%) | 19 (26.4%) |
| Total Housing Units | 101 (84.2%) | 19 (15.8%) |
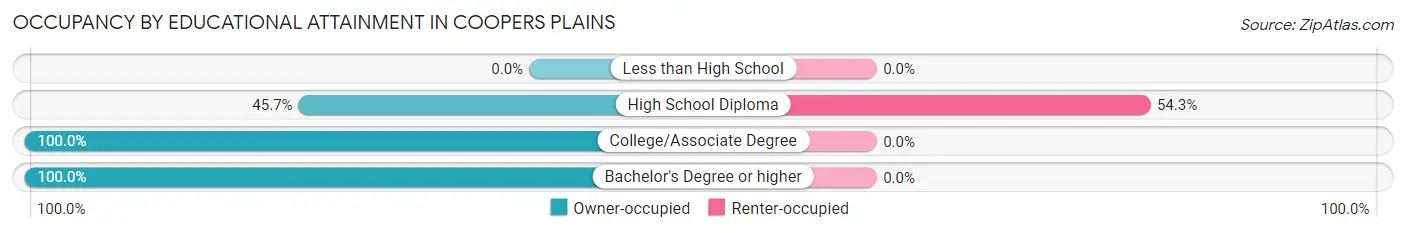
Occupancy by Educational Attainment in Coopers Plains
| Household Size | Owner-occupied | Renter-occupied |
| Less than High School | 0 (0.0%) | 0 (0.0%) |
| High School Diploma | 16 (45.7%) | 19 (54.3%) |
| College/Associate Degree | 60 (100.0%) | 0 (0.0%) |
| Bachelor's Degree or higher | 25 (100.0%) | 0 (0.0%) |
Occupancy by Age of Householder in Coopers Plains
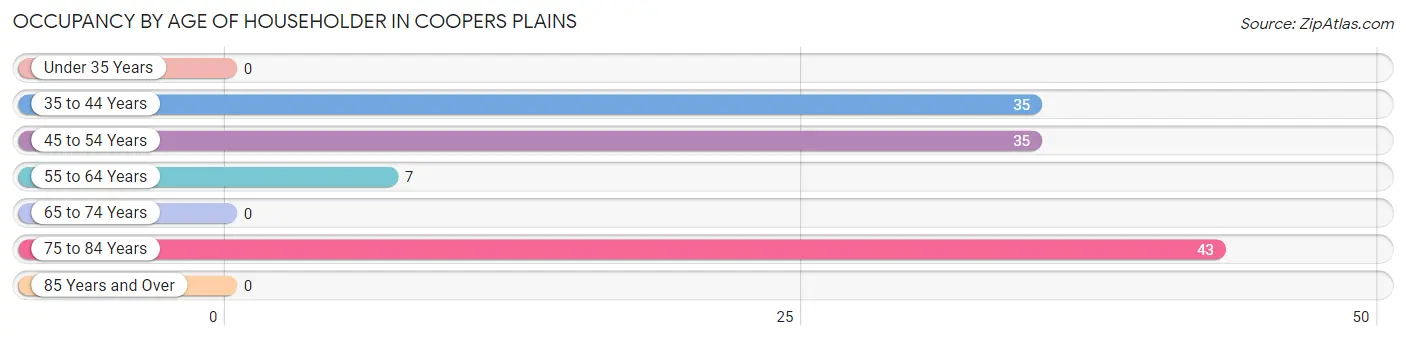
| Age Bracket | # Households | % Households |
| Under 35 Years | 0 | 0.0% |
| 35 to 44 Years | 35 | 29.2% |
| 45 to 54 Years | 35 | 29.2% |
| 55 to 64 Years | 7 | 5.8% |
| 65 to 74 Years | 0 | 0.0% |
| 75 to 84 Years | 43 | 35.8% |
| 85 Years and Over | 0 | 0.0% |
| Total | 120 | 100.0% |
Housing Finances in Coopers Plains
Median Income by Occupancy in Coopers Plains
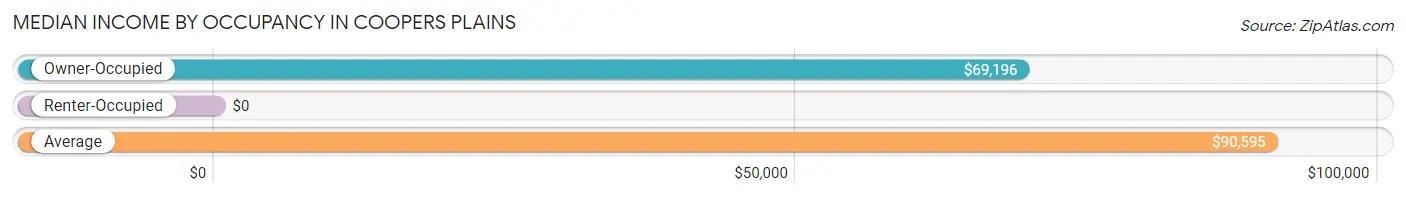
| Occupancy Type | # Households | Median Income |
| Owner-Occupied | 101 (84.2%) | $69,196 |
| Renter-Occupied | 19 (15.8%) | $0 |
| Average | 120 (100.0%) | $90,595 |
Occupancy by Householder Income Bracket in Coopers Plains
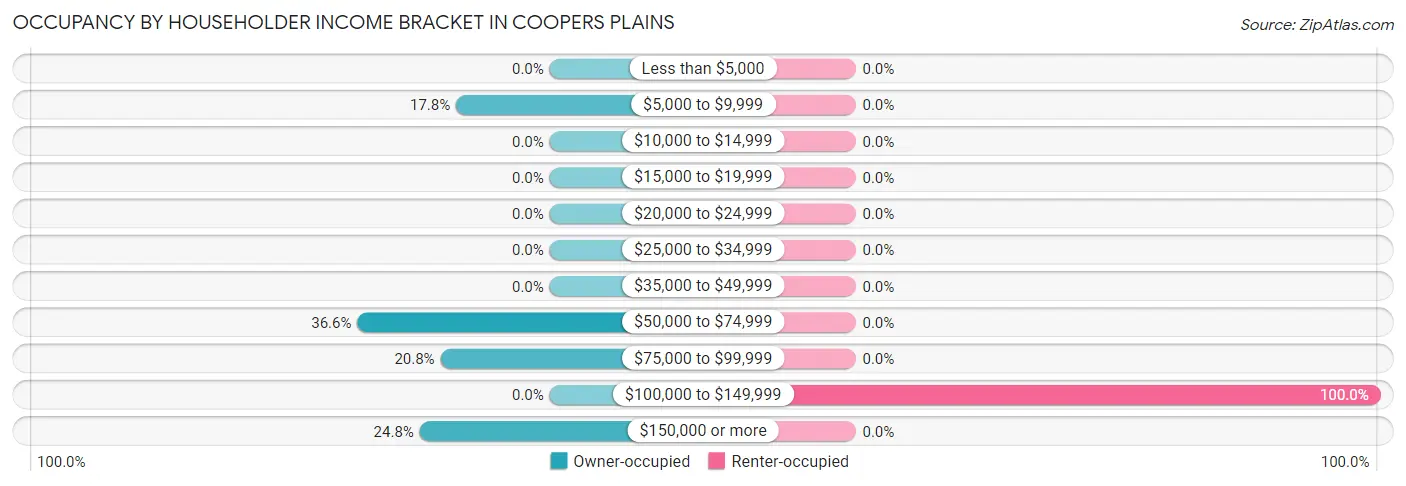
| Income Bracket | Owner-occupied | Renter-occupied |
| Less than $5,000 | 0 (0.0%) | 0 (0.0%) |
| $5,000 to $9,999 | 18 (17.8%) | 0 (0.0%) |
| $10,000 to $14,999 | 0 (0.0%) | 0 (0.0%) |
| $15,000 to $19,999 | 0 (0.0%) | 0 (0.0%) |
| $20,000 to $24,999 | 0 (0.0%) | 0 (0.0%) |
| $25,000 to $34,999 | 0 (0.0%) | 0 (0.0%) |
| $35,000 to $49,999 | 0 (0.0%) | 0 (0.0%) |
| $50,000 to $74,999 | 37 (36.6%) | 0 (0.0%) |
| $75,000 to $99,999 | 21 (20.8%) | 0 (0.0%) |
| $100,000 to $149,999 | 0 (0.0%) | 19 (100.0%) |
| $150,000 or more | 25 (24.7%) | 0 (0.0%) |
| Total | 101 (100.0%) | 19 (100.0%) |
Monthly Housing Cost Tiers in Coopers Plains
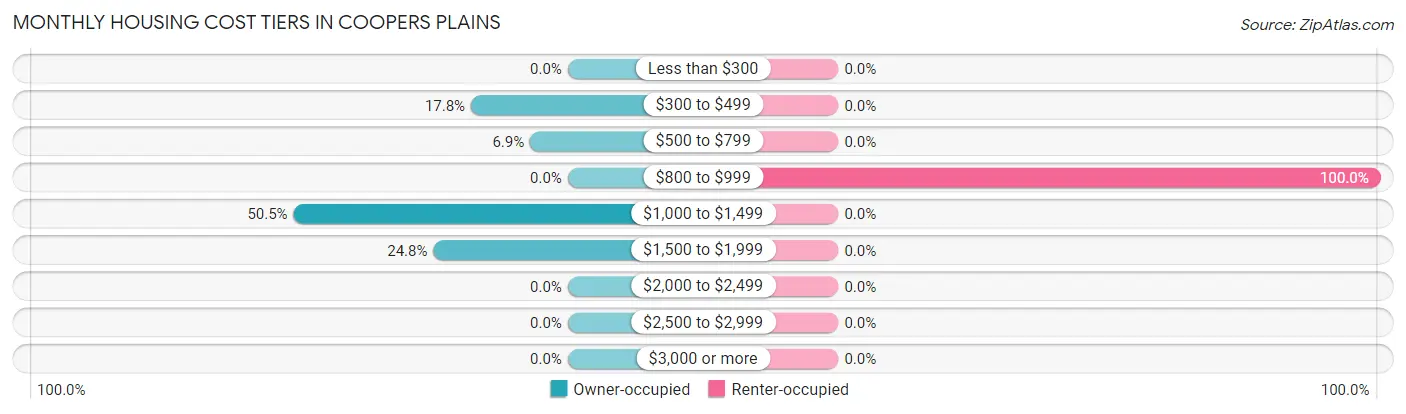
| Monthly Cost | Owner-occupied | Renter-occupied |
| Less than $300 | 0 (0.0%) | 0 (0.0%) |
| $300 to $499 | 18 (17.8%) | 0 (0.0%) |
| $500 to $799 | 7 (6.9%) | 0 (0.0%) |
| $800 to $999 | 0 (0.0%) | 19 (100.0%) |
| $1,000 to $1,499 | 51 (50.5%) | 0 (0.0%) |
| $1,500 to $1,999 | 25 (24.7%) | 0 (0.0%) |
| $2,000 to $2,499 | 0 (0.0%) | 0 (0.0%) |
| $2,500 to $2,999 | 0 (0.0%) | 0 (0.0%) |
| $3,000 or more | 0 (0.0%) | 0 (0.0%) |
| Total | 101 (100.0%) | 19 (100.0%) |
Physical Housing Characteristics in Coopers Plains
Housing Structures in Coopers Plains
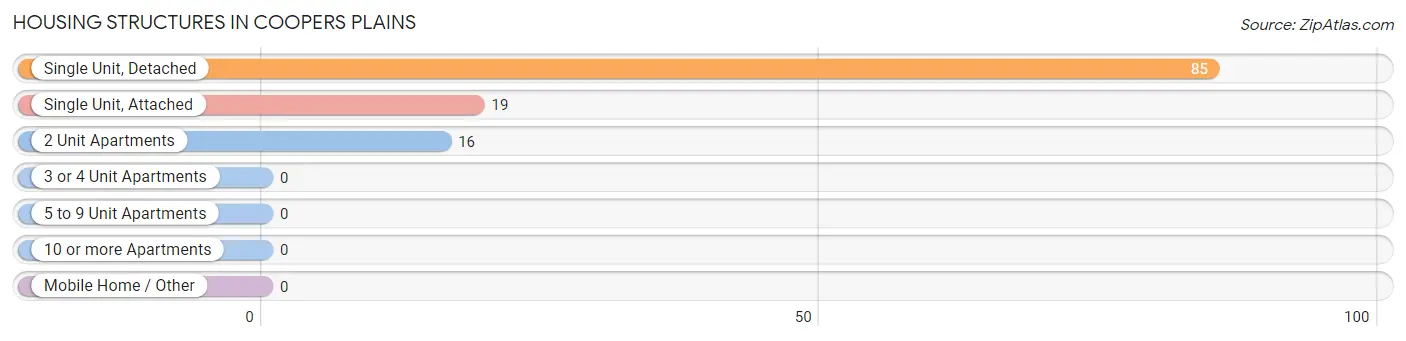
| Structure Type | # Housing Units | % Housing Units |
| Single Unit, Detached | 85 | 70.8% |
| Single Unit, Attached | 19 | 15.8% |
| 2 Unit Apartments | 16 | 13.3% |
| 3 or 4 Unit Apartments | 0 | 0.0% |
| 5 to 9 Unit Apartments | 0 | 0.0% |
| 10 or more Apartments | 0 | 0.0% |
| Mobile Home / Other | 0 | 0.0% |
| Total | 120 | 100.0% |
Housing Structures by Occupancy in Coopers Plains
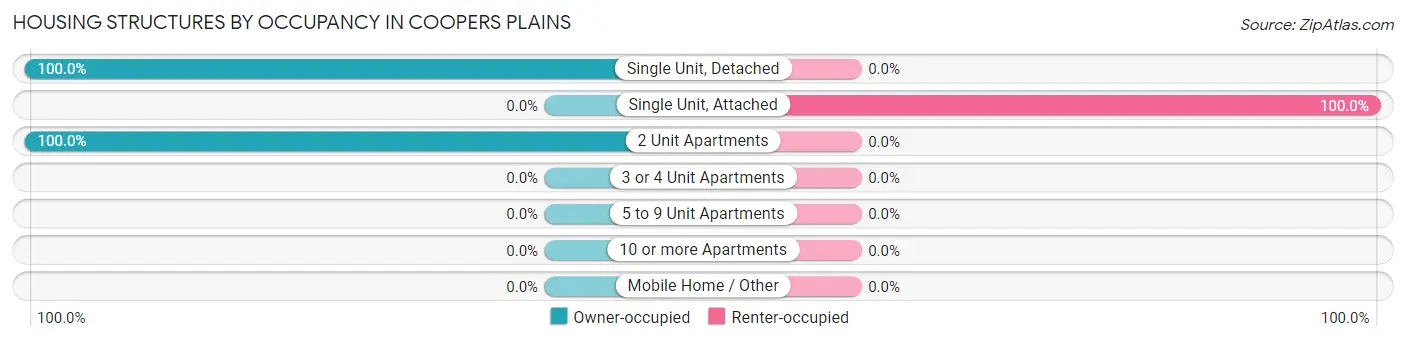
| Structure Type | Owner-occupied | Renter-occupied |
| Single Unit, Detached | 85 (100.0%) | 0 (0.0%) |
| Single Unit, Attached | 0 (0.0%) | 19 (100.0%) |
| 2 Unit Apartments | 16 (100.0%) | 0 (0.0%) |
| 3 or 4 Unit Apartments | 0 (0.0%) | 0 (0.0%) |
| 5 to 9 Unit Apartments | 0 (0.0%) | 0 (0.0%) |
| 10 or more Apartments | 0 (0.0%) | 0 (0.0%) |
| Mobile Home / Other | 0 (0.0%) | 0 (0.0%) |
| Total | 101 (84.2%) | 19 (15.8%) |
Housing Structures by Number of Rooms in Coopers Plains
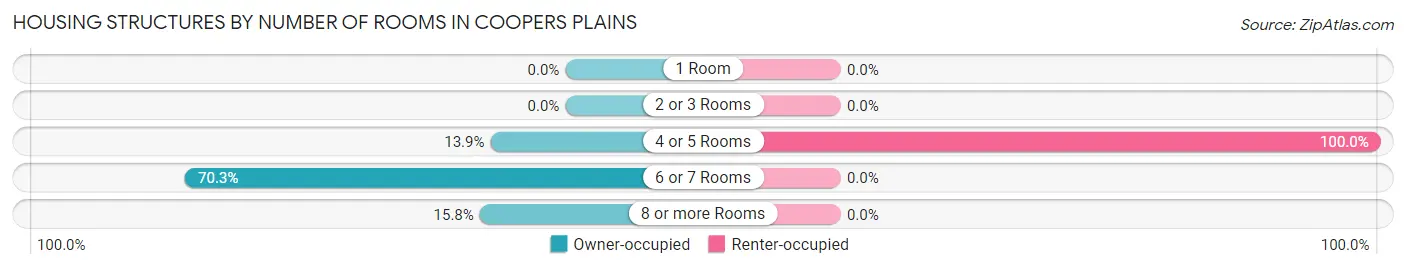
| Number of Rooms | Owner-occupied | Renter-occupied |
| 1 Room | 0 (0.0%) | 0 (0.0%) |
| 2 or 3 Rooms | 0 (0.0%) | 0 (0.0%) |
| 4 or 5 Rooms | 14 (13.9%) | 19 (100.0%) |
| 6 or 7 Rooms | 71 (70.3%) | 0 (0.0%) |
| 8 or more Rooms | 16 (15.8%) | 0 (0.0%) |
| Total | 101 (100.0%) | 19 (100.0%) |
Housing Structure by Heating Type in Coopers Plains
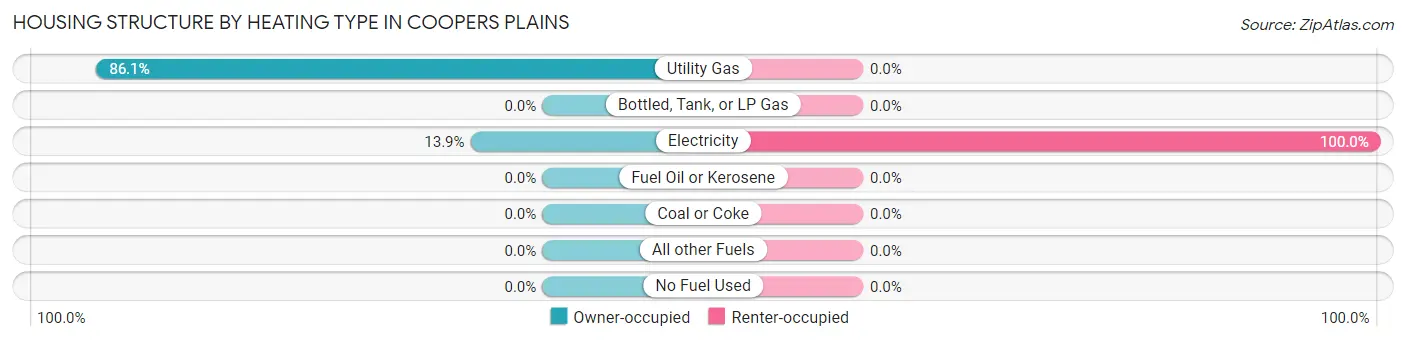
| Heating Type | Owner-occupied | Renter-occupied |
| Utility Gas | 87 (86.1%) | 0 (0.0%) |
| Bottled, Tank, or LP Gas | 0 (0.0%) | 0 (0.0%) |
| Electricity | 14 (13.9%) | 19 (100.0%) |
| Fuel Oil or Kerosene | 0 (0.0%) | 0 (0.0%) |
| Coal or Coke | 0 (0.0%) | 0 (0.0%) |
| All other Fuels | 0 (0.0%) | 0 (0.0%) |
| No Fuel Used | 0 (0.0%) | 0 (0.0%) |
| Total | 101 (100.0%) | 19 (100.0%) |
Household Vehicle Usage in Coopers Plains
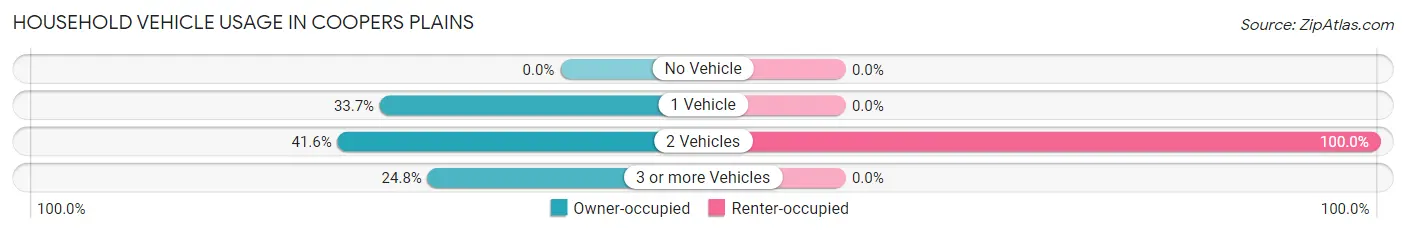
| Vehicles per Household | Owner-occupied | Renter-occupied |
| No Vehicle | 0 (0.0%) | 0 (0.0%) |
| 1 Vehicle | 34 (33.7%) | 0 (0.0%) |
| 2 Vehicles | 42 (41.6%) | 19 (100.0%) |
| 3 or more Vehicles | 25 (24.7%) | 0 (0.0%) |
| Total | 101 (100.0%) | 19 (100.0%) |
Real Estate & Mortgages in Coopers Plains
Real Estate and Mortgage Overview in Coopers Plains
| Characteristic | Without Mortgage | With Mortgage |
| Housing Units | 25 | 76 |
| Median Property Value | - | - |
| Median Household Income | - | - |
| Monthly Housing Costs | - | - |
| Real Estate Taxes | - | - |
Property Value by Mortgage Status in Coopers Plains
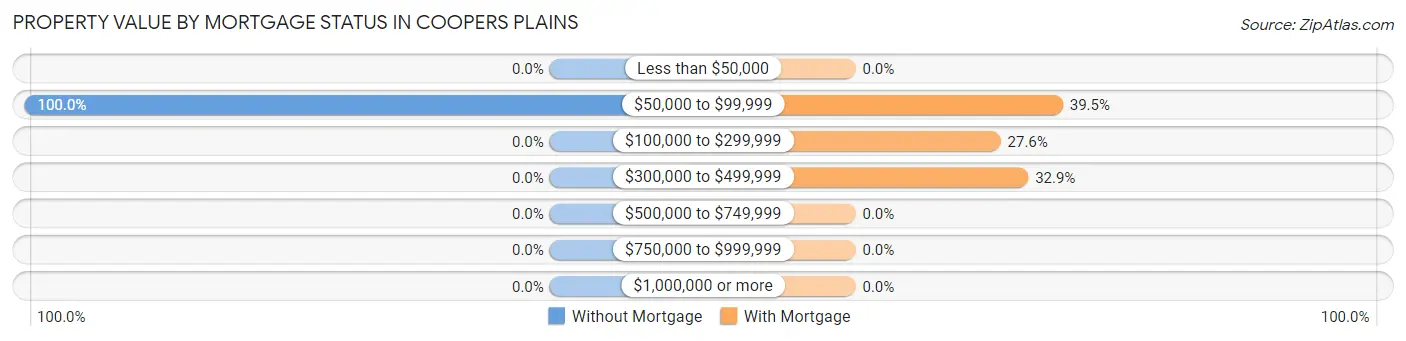
| Property Value | Without Mortgage | With Mortgage |
| Less than $50,000 | 0 (0.0%) | 0 (0.0%) |
| $50,000 to $99,999 | 25 (100.0%) | 30 (39.5%) |
| $100,000 to $299,999 | 0 (0.0%) | 21 (27.6%) |
| $300,000 to $499,999 | 0 (0.0%) | 25 (32.9%) |
| $500,000 to $749,999 | 0 (0.0%) | 0 (0.0%) |
| $750,000 to $999,999 | 0 (0.0%) | 0 (0.0%) |
| $1,000,000 or more | 0 (0.0%) | 0 (0.0%) |
| Total | 25 (100.0%) | 76 (100.0%) |
Household Income by Mortgage Status in Coopers Plains
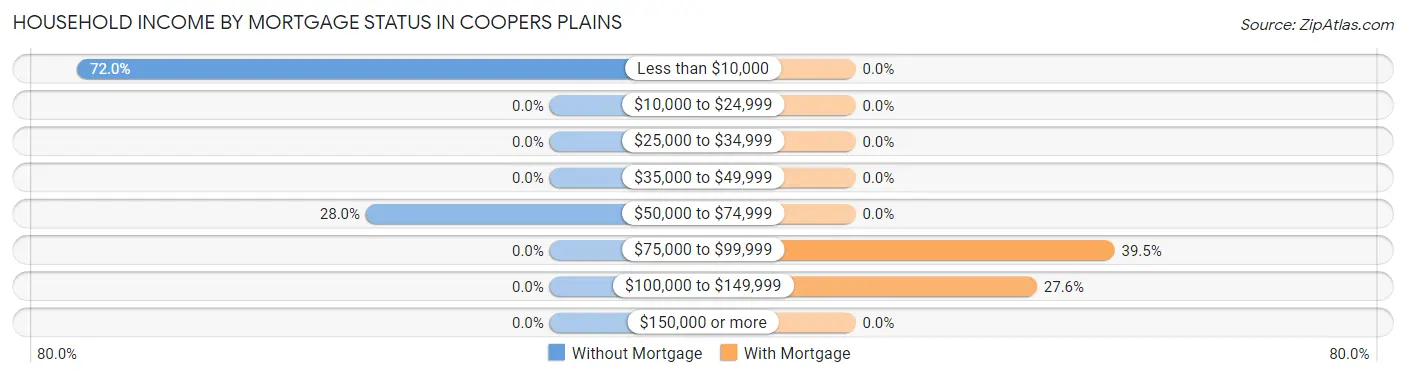
| Household Income | Without Mortgage | With Mortgage |
| Less than $10,000 | 18 (72.0%) | 0 (0.0%) |
| $10,000 to $24,999 | 0 (0.0%) | 0 (0.0%) |
| $25,000 to $34,999 | 0 (0.0%) | 0 (0.0%) |
| $35,000 to $49,999 | 0 (0.0%) | 0 (0.0%) |
| $50,000 to $74,999 | 7 (28.0%) | 0 (0.0%) |
| $75,000 to $99,999 | 0 (0.0%) | 30 (39.5%) |
| $100,000 to $149,999 | 0 (0.0%) | 21 (27.6%) |
| $150,000 or more | 0 (0.0%) | 0 (0.0%) |
| Total | 25 (100.0%) | 76 (100.0%) |
Property Value to Household Income Ratio in Coopers Plains
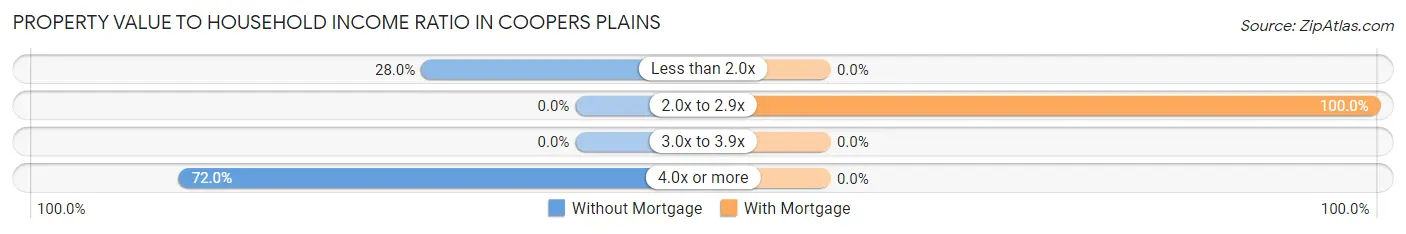
| Value-to-Income Ratio | Without Mortgage | With Mortgage |
| Less than 2.0x | 7 (28.0%) | 0 (0.0%) |
| 2.0x to 2.9x | 0 (0.0%) | 76 (100.0%) |
| 3.0x to 3.9x | 0 (0.0%) | 0 (0.0%) |
| 4.0x or more | 18 (72.0%) | 0 (0.0%) |
| Total | 25 (100.0%) | 76 (100.0%) |
Real Estate Taxes by Mortgage Status in Coopers Plains
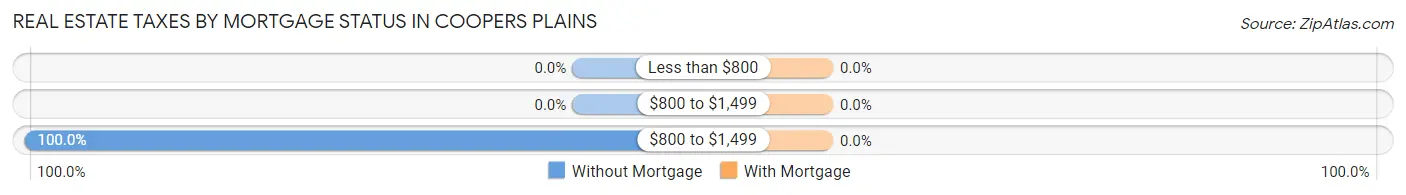
| Property Taxes | Without Mortgage | With Mortgage |
| Less than $800 | 0 (0.0%) | 0 (0.0%) |
| $800 to $1,499 | 0 (0.0%) | 0 (0.0%) |
| $800 to $1,499 | 25 (100.0%) | 0 (0.0%) |
| Total | 25 (100.0%) | 76 (100.0%) |
Health & Disability in Coopers Plains
Health Insurance Coverage by Age in Coopers Plains
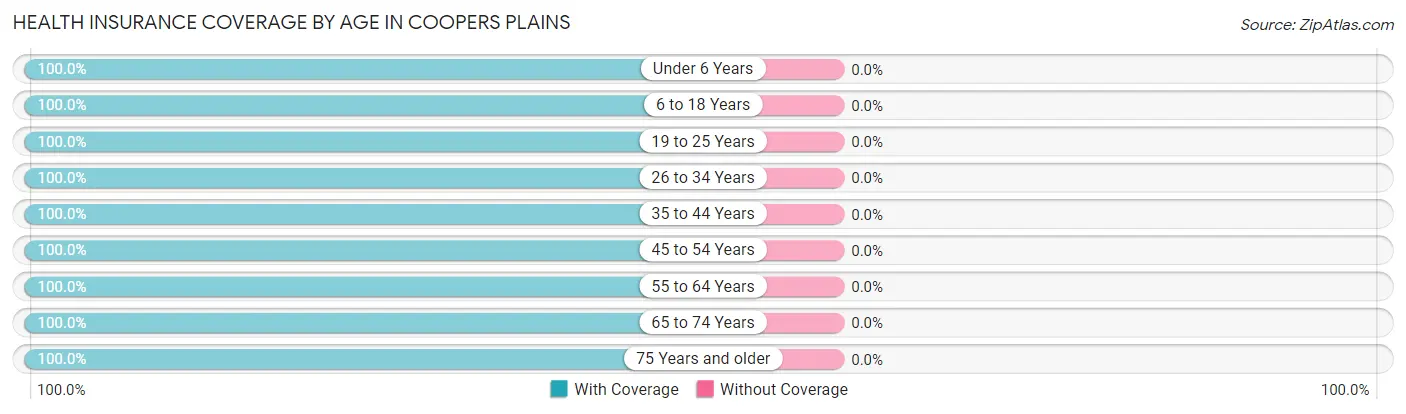
| Age Bracket | With Coverage | Without Coverage |
| Under 6 Years | 60 (100.0%) | 0 (0.0%) |
| 6 to 18 Years | 35 (100.0%) | 0 (0.0%) |
| 19 to 25 Years | 41 (100.0%) | 0 (0.0%) |
| 26 to 34 Years | 57 (100.0%) | 0 (0.0%) |
| 35 to 44 Years | 74 (100.0%) | 0 (0.0%) |
| 45 to 54 Years | 35 (100.0%) | 0 (0.0%) |
| 55 to 64 Years | 76 (100.0%) | 0 (0.0%) |
| 65 to 74 Years | 11 (100.0%) | 0 (0.0%) |
| 75 Years and older | 43 (100.0%) | 0 (0.0%) |
| Total | 432 (100.0%) | 0 (0.0%) |
Health Insurance Coverage by Citizenship Status in Coopers Plains
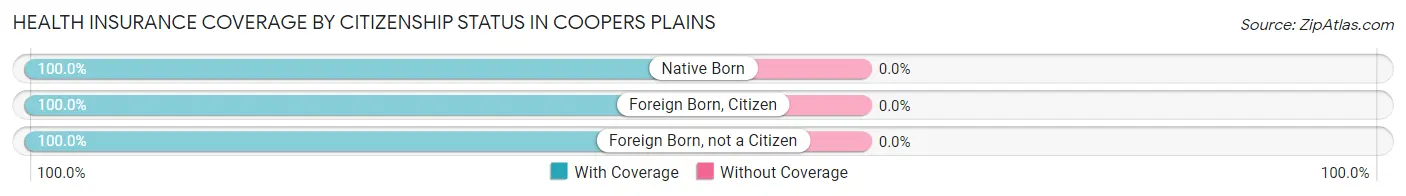
| Citizenship Status | With Coverage | Without Coverage |
| Native Born | 60 (100.0%) | 0 (0.0%) |
| Foreign Born, Citizen | 35 (100.0%) | 0 (0.0%) |
| Foreign Born, not a Citizen | 41 (100.0%) | 0 (0.0%) |
Health Insurance Coverage by Household Income in Coopers Plains
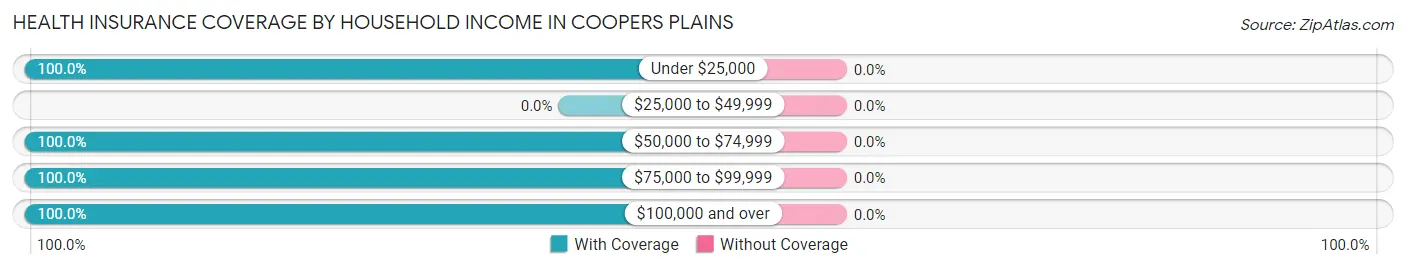
| Household Income | With Coverage | Without Coverage |
| Under $25,000 | 18 (100.0%) | 0 (0.0%) |
| $25,000 to $49,999 | 0 (0.0%) | 0 (0.0%) |
| $50,000 to $74,999 | 71 (100.0%) | 0 (0.0%) |
| $75,000 to $99,999 | 81 (100.0%) | 0 (0.0%) |
| $100,000 and over | 262 (100.0%) | 0 (0.0%) |
Public vs Private Health Insurance Coverage by Age in Coopers Plains
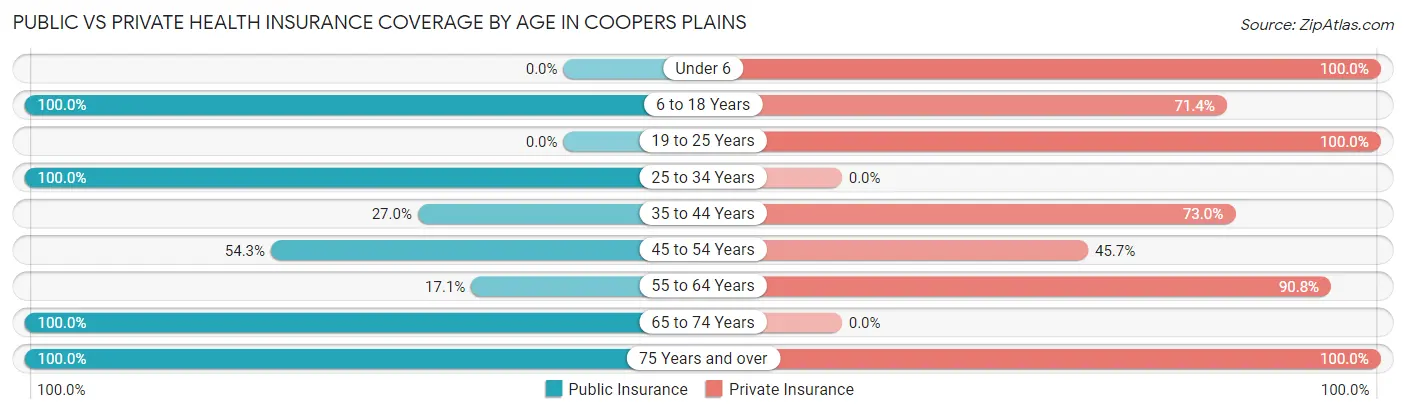
| Age Bracket | Public Insurance | Private Insurance |
| Under 6 | 0 (0.0%) | 60 (100.0%) |
| 6 to 18 Years | 35 (100.0%) | 25 (71.4%) |
| 19 to 25 Years | 0 (0.0%) | 41 (100.0%) |
| 25 to 34 Years | 57 (100.0%) | 0 (0.0%) |
| 35 to 44 Years | 20 (27.0%) | 54 (73.0%) |
| 45 to 54 Years | 19 (54.3%) | 16 (45.7%) |
| 55 to 64 Years | 13 (17.1%) | 69 (90.8%) |
| 65 to 74 Years | 11 (100.0%) | 0 (0.0%) |
| 75 Years and over | 43 (100.0%) | 43 (100.0%) |
| Total | 198 (45.8%) | 308 (71.3%) |
Disability Status by Sex by Age in Coopers Plains
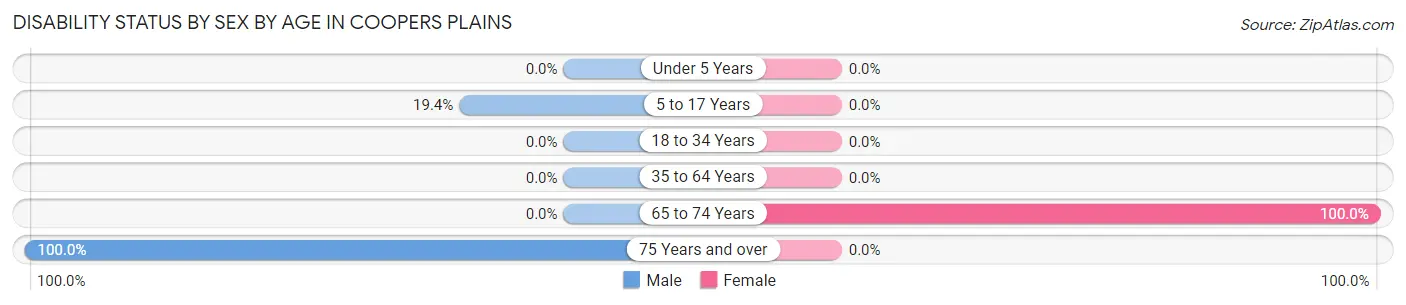
| Age Bracket | Male | Female |
| Under 5 Years | 0 (0.0%) | 0 (0.0%) |
| 5 to 17 Years | 6 (19.4%) | 0 (0.0%) |
| 18 to 34 Years | 0 (0.0%) | 0 (0.0%) |
| 35 to 64 Years | 0 (0.0%) | 0 (0.0%) |
| 65 to 74 Years | 0 (0.0%) | 11 (100.0%) |
| 75 Years and over | 25 (100.0%) | 0 (0.0%) |
Disability Class by Sex by Age in Coopers Plains
Disability Class: Hearing Difficulty
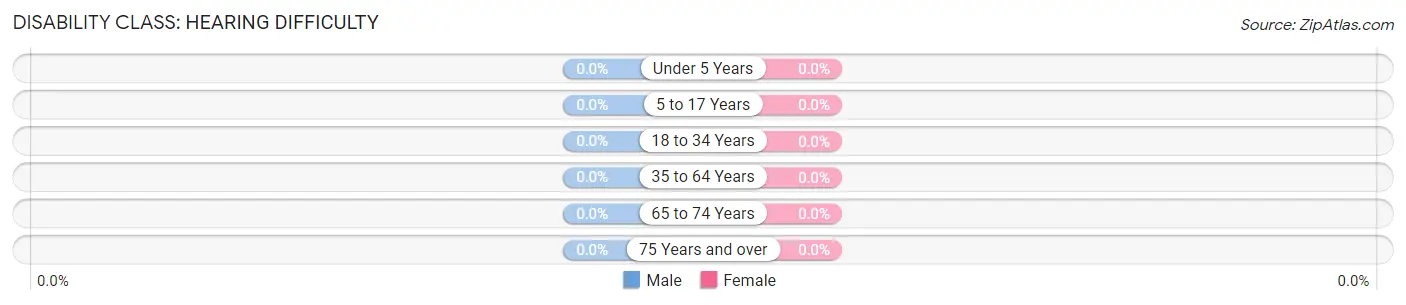
| Age Bracket | Male | Female |
| Under 5 Years | 0 (0.0%) | 0 (0.0%) |
| 5 to 17 Years | 0 (0.0%) | 0 (0.0%) |
| 18 to 34 Years | 0 (0.0%) | 0 (0.0%) |
| 35 to 64 Years | 0 (0.0%) | 0 (0.0%) |
| 65 to 74 Years | 0 (0.0%) | 0 (0.0%) |
| 75 Years and over | 0 (0.0%) | 0 (0.0%) |
Disability Class: Vision Difficulty
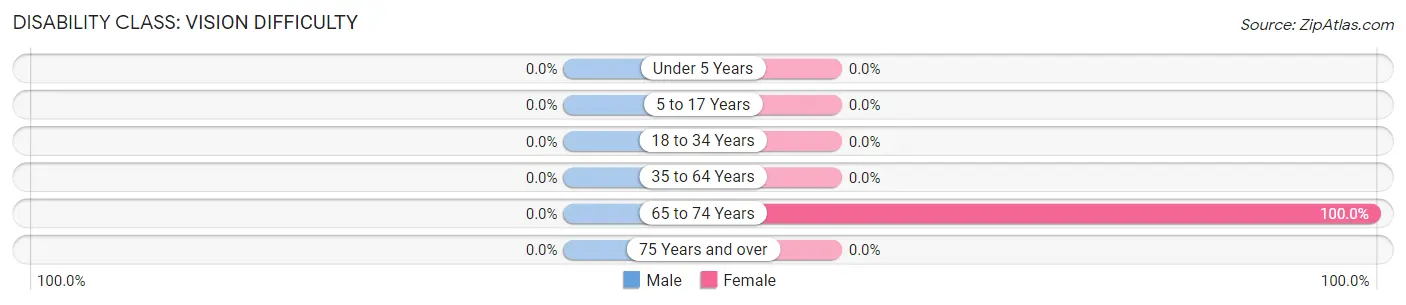
| Age Bracket | Male | Female |
| Under 5 Years | 0 (0.0%) | 0 (0.0%) |
| 5 to 17 Years | 0 (0.0%) | 0 (0.0%) |
| 18 to 34 Years | 0 (0.0%) | 0 (0.0%) |
| 35 to 64 Years | 0 (0.0%) | 0 (0.0%) |
| 65 to 74 Years | 0 (0.0%) | 11 (100.0%) |
| 75 Years and over | 0 (0.0%) | 0 (0.0%) |
Disability Class: Cognitive Difficulty
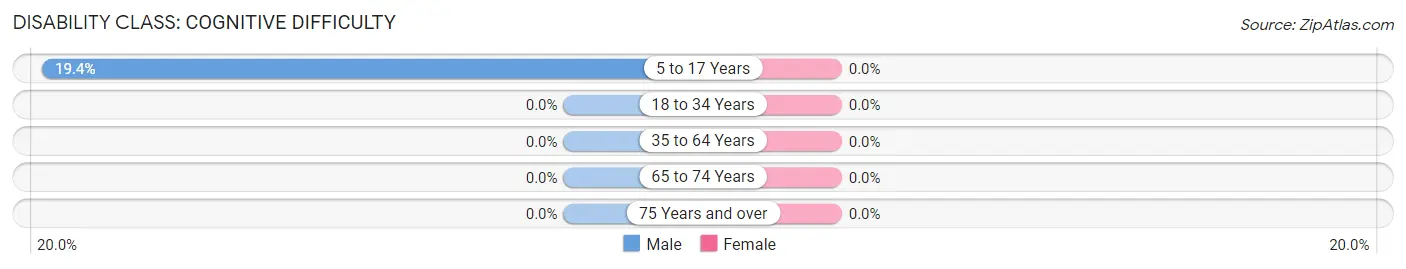
| Age Bracket | Male | Female |
| 5 to 17 Years | 6 (19.4%) | 0 (0.0%) |
| 18 to 34 Years | 0 (0.0%) | 0 (0.0%) |
| 35 to 64 Years | 0 (0.0%) | 0 (0.0%) |
| 65 to 74 Years | 0 (0.0%) | 0 (0.0%) |
| 75 Years and over | 0 (0.0%) | 0 (0.0%) |
Disability Class: Ambulatory Difficulty
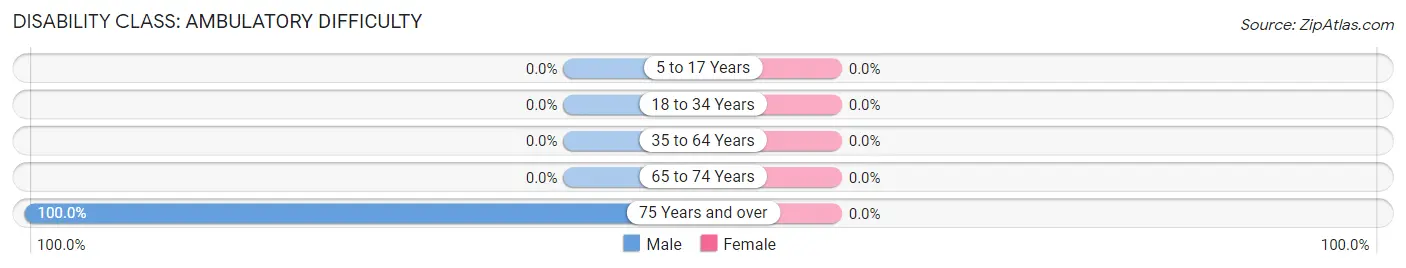
| Age Bracket | Male | Female |
| 5 to 17 Years | 0 (0.0%) | 0 (0.0%) |
| 18 to 34 Years | 0 (0.0%) | 0 (0.0%) |
| 35 to 64 Years | 0 (0.0%) | 0 (0.0%) |
| 65 to 74 Years | 0 (0.0%) | 0 (0.0%) |
| 75 Years and over | 25 (100.0%) | 0 (0.0%) |
Disability Class: Self-Care Difficulty
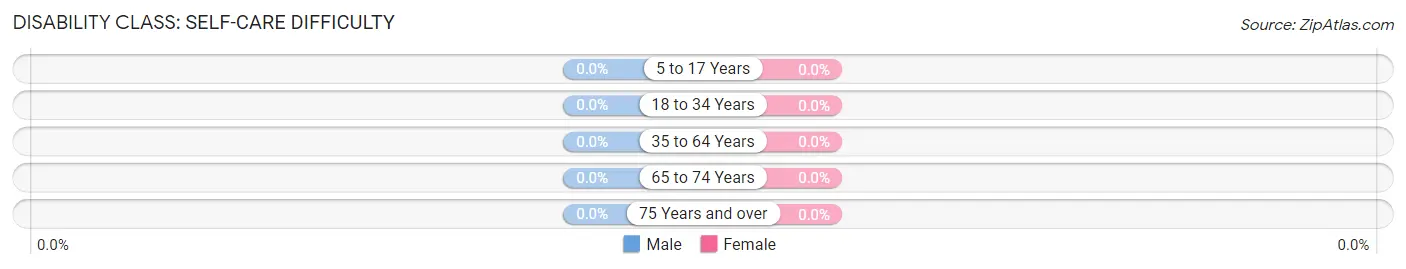
| Age Bracket | Male | Female |
| 5 to 17 Years | 0 (0.0%) | 0 (0.0%) |
| 18 to 34 Years | 0 (0.0%) | 0 (0.0%) |
| 35 to 64 Years | 0 (0.0%) | 0 (0.0%) |
| 65 to 74 Years | 0 (0.0%) | 0 (0.0%) |
| 75 Years and over | 0 (0.0%) | 0 (0.0%) |
Technology Access in Coopers Plains
Computing Device Access in Coopers Plains
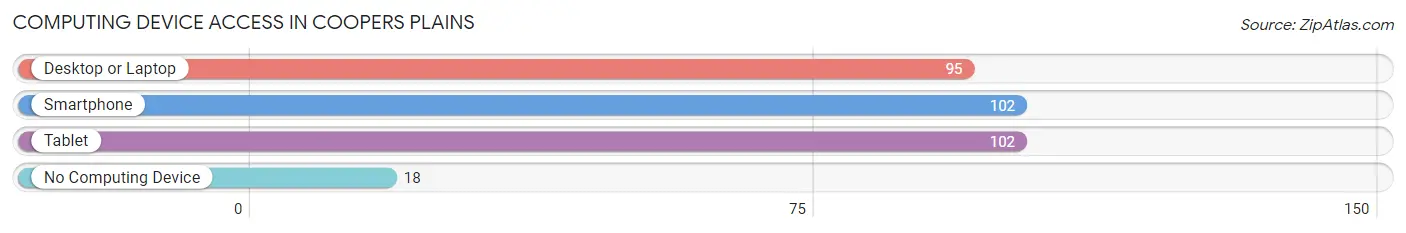
| Device Type | # Households | % Households |
| Desktop or Laptop | 95 | 79.2% |
| Smartphone | 102 | 85.0% |
| Tablet | 102 | 85.0% |
| No Computing Device | 18 | 15.0% |
| Total | 120 | 100.0% |
Internet Access in Coopers Plains
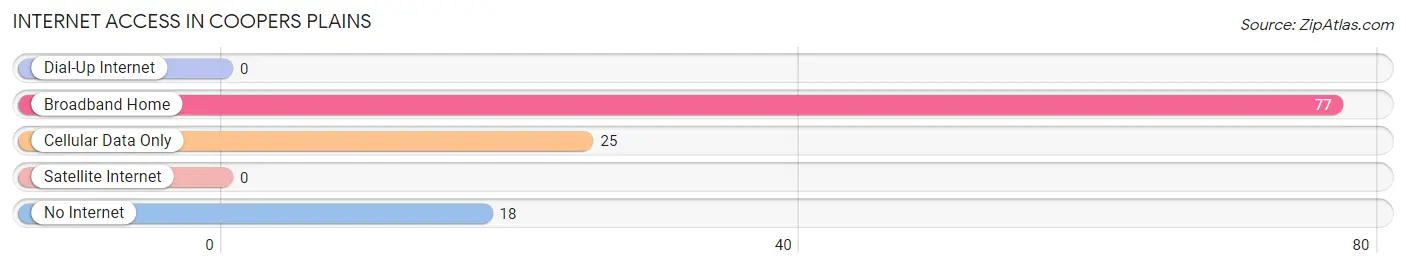
| Internet Type | # Households | % Households |
| Dial-Up Internet | 0 | 0.0% |
| Broadband Home | 77 | 64.2% |
| Cellular Data Only | 25 | 20.8% |
| Satellite Internet | 0 | 0.0% |
| No Internet | 18 | 15.0% |
| Total | 120 | 100.0% |
Coopers Plains Summary
Coopers Plains is a hamlet located in the town of Genesee in Wyoming County, New York. It is situated on the banks of the Genesee River, approximately 10 miles south of the city of Rochester. The hamlet is home to a population of approximately 1,000 people, and is a popular destination for outdoor recreation and fishing.
History
Coopers Plains was first settled in the early 1800s by a group of settlers from Connecticut. The settlers were attracted to the area due to its abundance of natural resources, including timber and fertile soil. The hamlet was named after the Cooper family, who were among the first settlers in the area.
The hamlet grew steadily throughout the 19th century, and by the early 20th century, it had become a popular destination for outdoor recreation and fishing. The hamlet was also home to a number of small businesses, including a sawmill, a gristmill, and a general store.
Geography
Coopers Plains is located in the town of Genesee in Wyoming County, New York. It is situated on the banks of the Genesee River, approximately 10 miles south of the city of Rochester. The hamlet is surrounded by rolling hills and farmland, and is home to a number of small lakes and streams.
The climate in Coopers Plains is generally mild, with temperatures ranging from the low 30s in the winter to the mid-80s in the summer. The area receives an average of 40 inches of precipitation per year, with most of it falling in the form of snow in the winter months.
Economy
The economy of Coopers Plains is largely based on agriculture and tourism. The hamlet is home to a number of small farms, which produce a variety of crops, including corn, soybeans, and hay. The area is also popular with tourists, who come to enjoy the area’s natural beauty and outdoor recreation opportunities.
In addition to agriculture and tourism, Coopers Plains is home to a number of small businesses, including a sawmill, a gristmill, and a general store. The hamlet is also home to a number of restaurants, bars, and other retail establishments.
Demographics
As of the 2010 census, the population of Coopers Plains was 1,000. The population is predominantly white (97.2%), with a small minority population (2.8%). The median household income in the hamlet is $45,000, and the median age is 43.
Coopers Plains is a small, rural hamlet with a strong sense of community. The hamlet is home to a number of churches, and is a popular destination for outdoor recreation and fishing. The hamlet is also home to a number of small businesses, which provide employment opportunities for the local population.
Common Questions
What is Per Capita Income in Coopers Plains?
Per Capita income in Coopers Plains is $56,639.
What is the Median Household income in Coopers Plains?
Median Household Income in Coopers Plains is $90,595.
What is Inequality or Gini Index in Coopers Plains?
Inequality or Gini Index in Coopers Plains is 0.44.
What is the Total Population of Coopers Plains?
Total Population of Coopers Plains is 432.
What is the Total Male Population of Coopers Plains?
Total Male Population of Coopers Plains is 202.
What is the Total Female Population of Coopers Plains?
Total Female Population of Coopers Plains is 230.
What is the Ratio of Males per 100 Females in Coopers Plains?
There are 87.83 Males per 100 Females in Coopers Plains.
What is the Ratio of Females per 100 Males in Coopers Plains?
There are 113.86 Females per 100 Males in Coopers Plains.
What is the Median Population Age in Coopers Plains?
Median Population Age in Coopers Plains is 39.2 Years.
What is the Average Family Size in Coopers Plains
Average Family Size in Coopers Plains is 4.3 People.
What is the Average Household Size in Coopers Plains
Average Household Size in Coopers Plains is 3.6 People.
How Large is the Labor Force in Coopers Plains?
There are 257 People in the Labor Forcein in Coopers Plains.
What is the Percentage of People in the Labor Force in Coopers Plains?
76.3% of People are in the Labor Force in Coopers Plains.
What is the Unemployment Rate in Coopers Plains?
Unemployment Rate in Coopers Plains is 2.7%.