Cities with the Highest Percentage of Scandinavian Population in New York
RELATED REPORTS & OPTIONS
Scandinavian
New York
Compare Cities
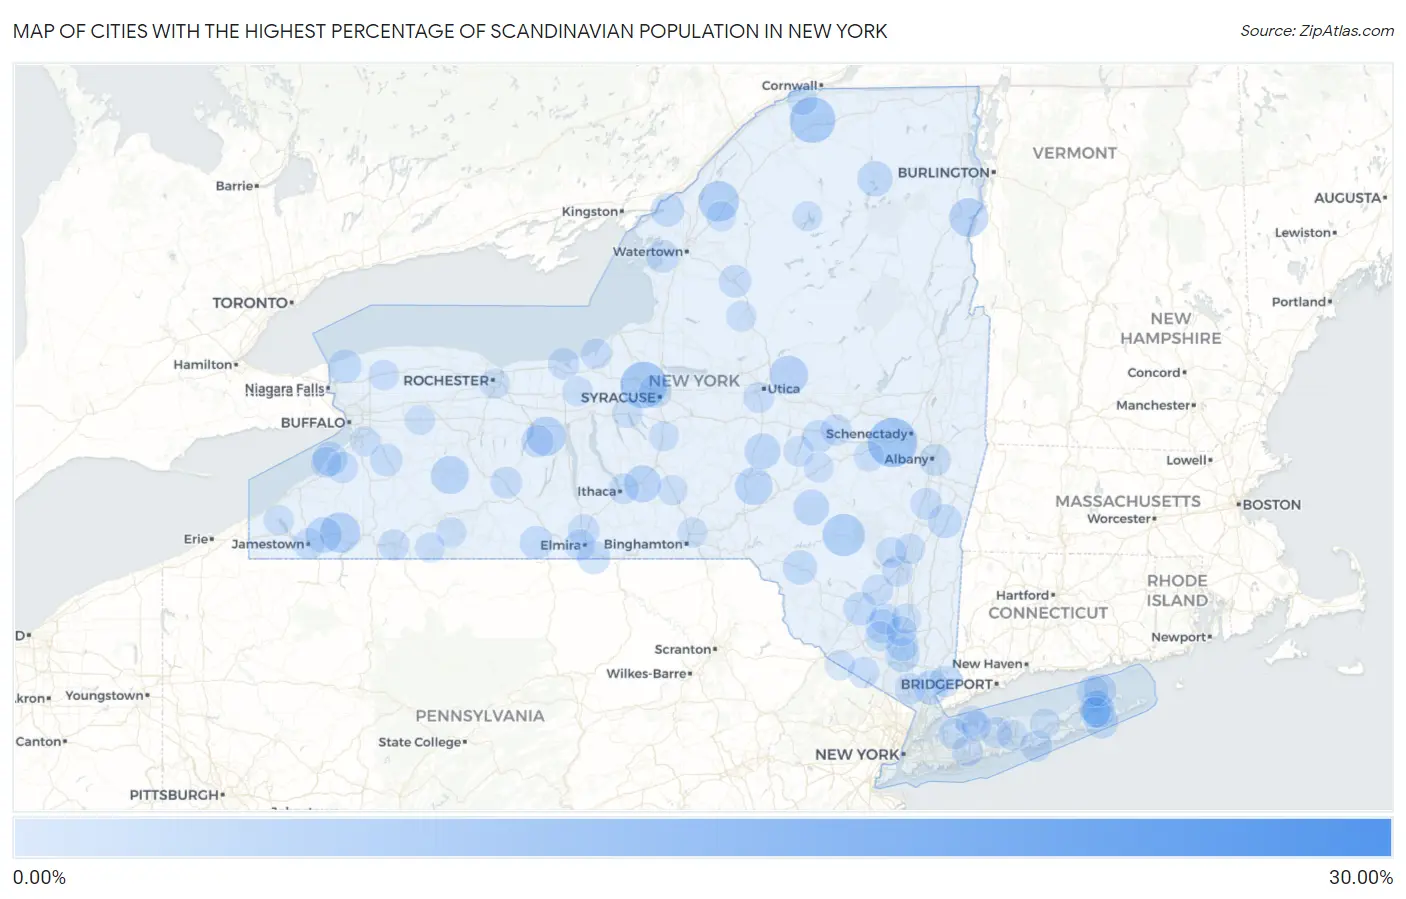
Map of Cities with the Highest Percentage of Scandinavian Population in New York
0.00%
30.00%
Cities with the Highest Percentage of Scandinavian Population in New York
| City | Scandinavian | vs State | vs National | |
| 1. | Willsboro Point | 28.03% | 0.12%(+27.9)#1 | 0.30%(+27.7)#16 |
| 2. | Duane Lake | 8.76% | 0.12%(+8.64)#2 | 0.30%(+8.45)#141 |
| 3. | Highland-On-The-Lake | 8.61% | 0.12%(+8.49)#3 | 0.30%(+8.31)#143 |
| 4. | Seneca Knolls | 7.63% | 0.12%(+7.51)#4 | 0.30%(+7.32)#178 |
| 5. | Winthrop | 7.23% | 0.12%(+7.12)#5 | 0.30%(+6.93)#189 |
| 6. | Fleischmanns | 5.77% | 0.12%(+5.65)#6 | 0.30%(+5.46)#274 |
| 7. | Clifton Gardens | 5.24% | 0.12%(+5.12)#7 | 0.30%(+4.94)#318 |
| 8. | Oxbow | 5.08% | 0.12%(+4.97)#8 | 0.30%(+4.78)#332 |
| 9. | East Randolph | 4.90% | 0.12%(+4.78)#9 | 0.30%(+4.60)#352 |
| 10. | Gorham | 4.43% | 0.12%(+4.31)#10 | 0.30%(+4.13)#406 |
| 11. | Westport | 4.38% | 0.12%(+4.26)#11 | 0.30%(+4.08)#416 |
| 12. | Newport | 4.31% | 0.12%(+4.19)#12 | 0.30%(+4.01)#430 |
| 13. | Hunt | 4.03% | 0.12%(+3.91)#13 | 0.30%(+3.73)#474 |
| 14. | Gilbertsville | 3.86% | 0.12%(+3.74)#14 | 0.30%(+3.55)#512 |
| 15. | Dryden | 3.59% | 0.12%(+3.47)#15 | 0.30%(+3.29)#566 |
| 16. | Walworth | 3.47% | 0.12%(+3.35)#16 | 0.30%(+3.16)#595 |
| 17. | Kennedy | 3.15% | 0.12%(+3.03)#17 | 0.30%(+2.85)#689 |
| 18. | Edmeston | 3.14% | 0.12%(+3.02)#18 | 0.30%(+2.83)#694 |
| 19. | Bloomville | 3.10% | 0.12%(+2.98)#19 | 0.30%(+2.80)#706 |
| 20. | Paul Smiths | 2.92% | 0.12%(+2.80)#20 | 0.30%(+2.62)#771 |
| 21. | Chappaqua | 2.77% | 0.12%(+2.65)#21 | 0.30%(+2.47)#836 |
| 22. | Macdonnell Heights | 2.62% | 0.12%(+2.50)#22 | 0.30%(+2.32)#908 |
| 23. | Sagaponack | 2.62% | 0.12%(+2.50)#23 | 0.30%(+2.31)#914 |
| 24. | Angola On The Lake | 2.50% | 0.12%(+2.38)#24 | 0.30%(+2.20)#965 |
| 25. | Roscoe | 2.49% | 0.12%(+2.37)#25 | 0.30%(+2.18)#974 |
| 26. | West Point | 2.44% | 0.12%(+2.32)#26 | 0.30%(+2.14)#994 |
| 27. | Walden | 2.35% | 0.12%(+2.23)#27 | 0.30%(+2.04)#1,043 |
| 28. | Philmont | 2.31% | 0.12%(+2.19)#28 | 0.30%(+2.00)#1,074 |
| 29. | North Haven | 2.19% | 0.12%(+2.07)#29 | 0.30%(+1.89)#1,154 |
| 30. | Ransomville | 2.19% | 0.12%(+2.07)#30 | 0.30%(+1.88)#1,157 |
| 31. | Varna | 2.15% | 0.12%(+2.03)#31 | 0.30%(+1.84)#1,195 |
| 32. | Clayton | 2.13% | 0.12%(+2.01)#32 | 0.30%(+1.82)#1,205 |
| 33. | Cragsmoor | 2.12% | 0.12%(+2.00)#33 | 0.30%(+1.81)#1,221 |
| 34. | Sag Harbor | 2.09% | 0.12%(+1.97)#34 | 0.30%(+1.78)#1,249 |
| 35. | Wellsburg | 2.05% | 0.12%(+1.93)#35 | 0.30%(+1.74)#1,276 |
| 36. | Addison | 2.01% | 0.12%(+1.89)#36 | 0.30%(+1.71)#1,305 |
| 37. | Sackets Harbor | 1.89% | 0.12%(+1.78)#37 | 0.30%(+1.59)#1,401 |
| 38. | Galeville | 1.83% | 0.12%(+1.71)#38 | 0.30%(+1.53)#1,461 |
| 39. | Lowville | 1.81% | 0.12%(+1.69)#39 | 0.30%(+1.51)#1,481 |
| 40. | Holland | 1.81% | 0.12%(+1.69)#40 | 0.30%(+1.50)#1,484 |
| 41. | Orient | 1.80% | 0.12%(+1.68)#41 | 0.30%(+1.50)#1,491 |
| 42. | Cherry Valley | 1.74% | 0.12%(+1.63)#42 | 0.30%(+1.44)#1,558 |
| 43. | Cornwall On Hudson | 1.68% | 0.12%(+1.56)#43 | 0.30%(+1.37)#1,639 |
| 44. | Rushville | 1.65% | 0.12%(+1.53)#44 | 0.30%(+1.34)#1,677 |
| 45. | Rensselaer | 1.47% | 0.12%(+1.35)#45 | 0.30%(+1.17)#1,886 |
| 46. | Cohocton | 1.45% | 0.12%(+1.33)#46 | 0.30%(+1.15)#1,904 |
| 47. | Coxsackie | 1.41% | 0.12%(+1.29)#47 | 0.30%(+1.11)#1,979 |
| 48. | Sodus Point | 1.37% | 0.12%(+1.25)#48 | 0.30%(+1.06)#2,037 |
| 49. | Horseheads North | 1.37% | 0.12%(+1.25)#49 | 0.30%(+1.06)#2,041 |
| 50. | North Collins | 1.33% | 0.12%(+1.21)#50 | 0.30%(+1.02)#2,116 |
| 51. | Jamestown | 1.33% | 0.12%(+1.21)#51 | 0.30%(+1.02)#2,121 |
| 52. | Village Of The Branch | 1.32% | 0.12%(+1.20)#52 | 0.30%(+1.01)#2,141 |
| 53. | Congers | 1.29% | 0.12%(+1.18)#53 | 0.30%(+0.990)#2,183 |
| 54. | Mastic Beach | 1.29% | 0.12%(+1.17)#54 | 0.30%(+0.987)#2,189 |
| 55. | East Marion | 1.28% | 0.12%(+1.16)#55 | 0.30%(+0.974)#2,214 |
| 56. | Eatons Neck | 1.27% | 0.12%(+1.15)#56 | 0.30%(+0.968)#2,225 |
| 57. | Warwick | 1.25% | 0.12%(+1.13)#57 | 0.30%(+0.943)#2,281 |
| 58. | Wallkill | 1.24% | 0.12%(+1.12)#58 | 0.30%(+0.933)#2,305 |
| 59. | Allegany | 1.23% | 0.12%(+1.11)#59 | 0.30%(+0.928)#2,319 |
| 60. | Bedford | 1.22% | 0.12%(+1.10)#60 | 0.30%(+0.914)#2,340 |
| 61. | Ames | 1.20% | 0.12%(+1.09)#61 | 0.30%(+0.901)#2,373 |
| 62. | West Elmira | 1.19% | 0.12%(+1.07)#62 | 0.30%(+0.884)#2,405 |
| 63. | Washington Mills | 1.15% | 0.12%(+1.03)#63 | 0.30%(+0.848)#2,486 |
| 64. | Accord | 1.14% | 0.12%(+1.02)#64 | 0.30%(+0.839)#2,499 |
| 65. | Lake Erie Beach | 1.13% | 0.12%(+1.01)#65 | 0.30%(+0.823)#2,536 |
| 66. | Upper Brookville | 1.12% | 0.12%(+0.998)#66 | 0.30%(+0.813)#2,561 |
| 67. | Hurley | 1.10% | 0.12%(+0.979)#67 | 0.30%(+0.794)#2,614 |
| 68. | Farmingdale | 1.09% | 0.12%(+0.973)#68 | 0.30%(+0.787)#2,633 |
| 69. | Fair Haven | 1.04% | 0.12%(+0.924)#69 | 0.30%(+0.738)#2,739 |
| 70. | Farmingville | 1.04% | 0.12%(+0.917)#70 | 0.30%(+0.732)#2,767 |
| 71. | Woodstock | 1.01% | 0.12%(+0.890)#71 | 0.30%(+0.705)#2,836 |
| 72. | Gasport | 1.00% | 0.12%(+0.881)#72 | 0.30%(+0.696)#2,853 |
| 73. | Forest Home | 0.99% | 0.12%(+0.875)#73 | 0.30%(+0.689)#2,871 |
| 74. | Cooperstown | 0.98% | 0.12%(+0.864)#74 | 0.30%(+0.679)#2,899 |
| 75. | Constableville | 0.98% | 0.12%(+0.858)#75 | 0.30%(+0.673)#2,916 |
| 76. | Noyack | 0.96% | 0.12%(+0.840)#76 | 0.30%(+0.655)#2,959 |
| 77. | Skaneateles | 0.95% | 0.12%(+0.826)#77 | 0.30%(+0.641)#2,996 |
| 78. | Schoharie | 0.94% | 0.12%(+0.822)#78 | 0.30%(+0.637)#3,012 |
| 79. | Saugerties South | 0.90% | 0.12%(+0.780)#79 | 0.30%(+0.595)#3,140 |
| 80. | Unionville | 0.90% | 0.12%(+0.777)#80 | 0.30%(+0.591)#3,152 |
| 81. | Mayville | 0.89% | 0.12%(+0.767)#81 | 0.30%(+0.581)#3,178 |
| 82. | Orchard Park | 0.88% | 0.12%(+0.757)#82 | 0.30%(+0.571)#3,213 |
| 83. | Massena | 0.87% | 0.12%(+0.752)#83 | 0.30%(+0.567)#3,235 |
| 84. | Marathon | 0.87% | 0.12%(+0.750)#84 | 0.30%(+0.564)#3,244 |
| 85. | Calverton | 0.86% | 0.12%(+0.746)#85 | 0.30%(+0.560)#3,258 |
| 86. | Scio | 0.85% | 0.12%(+0.730)#86 | 0.30%(+0.545)#3,305 |
| 87. | Chenango Bridge | 0.84% | 0.12%(+0.719)#87 | 0.30%(+0.533)#3,350 |
| 88. | Brighton | 0.84% | 0.12%(+0.718)#88 | 0.30%(+0.532)#3,356 |
| 89. | Marlboro | 0.83% | 0.12%(+0.706)#89 | 0.30%(+0.521)#3,402 |
| 90. | Worcester | 0.82% | 0.12%(+0.700)#90 | 0.30%(+0.514)#3,427 |
| 91. | Clyde | 0.82% | 0.12%(+0.699)#91 | 0.30%(+0.514)#3,428 |
| 92. | Tully | 0.81% | 0.12%(+0.693)#92 | 0.30%(+0.508)#3,453 |
| 93. | Chelsea Cove | 0.81% | 0.12%(+0.692)#93 | 0.30%(+0.507)#3,460 |
| 94. | Antwerp | 0.81% | 0.12%(+0.688)#94 | 0.30%(+0.502)#3,478 |
| 95. | Cranberry Lake | 0.81% | 0.12%(+0.688)#95 | 0.30%(+0.502)#3,481 |
| 96. | Maybrook | 0.80% | 0.12%(+0.679)#96 | 0.30%(+0.493)#3,517 |
| 97. | Balmville | 0.79% | 0.12%(+0.674)#97 | 0.30%(+0.489)#3,535 |
| 98. | Alexander | 0.79% | 0.12%(+0.670)#98 | 0.30%(+0.485)#3,554 |
| 99. | Centerport | 0.78% | 0.12%(+0.659)#99 | 0.30%(+0.474)#3,601 |
| 100. | Bolivar | 0.76% | 0.12%(+0.643)#100 | 0.30%(+0.458)#3,669 |
Common Questions
What are the Top 10 Cities with the Highest Percentage of Scandinavian Population in New York?
Top 10 Cities with the Highest Percentage of Scandinavian Population in New York are:
#1
8.76%
#2
7.63%
#3
7.23%
#4
5.77%
#5
5.08%
#6
4.90%
#7
4.43%
#8
4.38%
#9
4.31%
#10
4.03%
What city has the Highest Percentage of Scandinavian Population in New York?
Duane Lake has the Highest Percentage of Scandinavian Population in New York with 8.76%.
What is the Percentage of Scandinavian Population in the State of New York?
Percentage of Scandinavian Population in New York is 0.12%.
What is the Percentage of Scandinavian Population in the United States?
Percentage of Scandinavian Population in the United States is 0.30%.