Claverack Red Mills, NY Map & Demographics
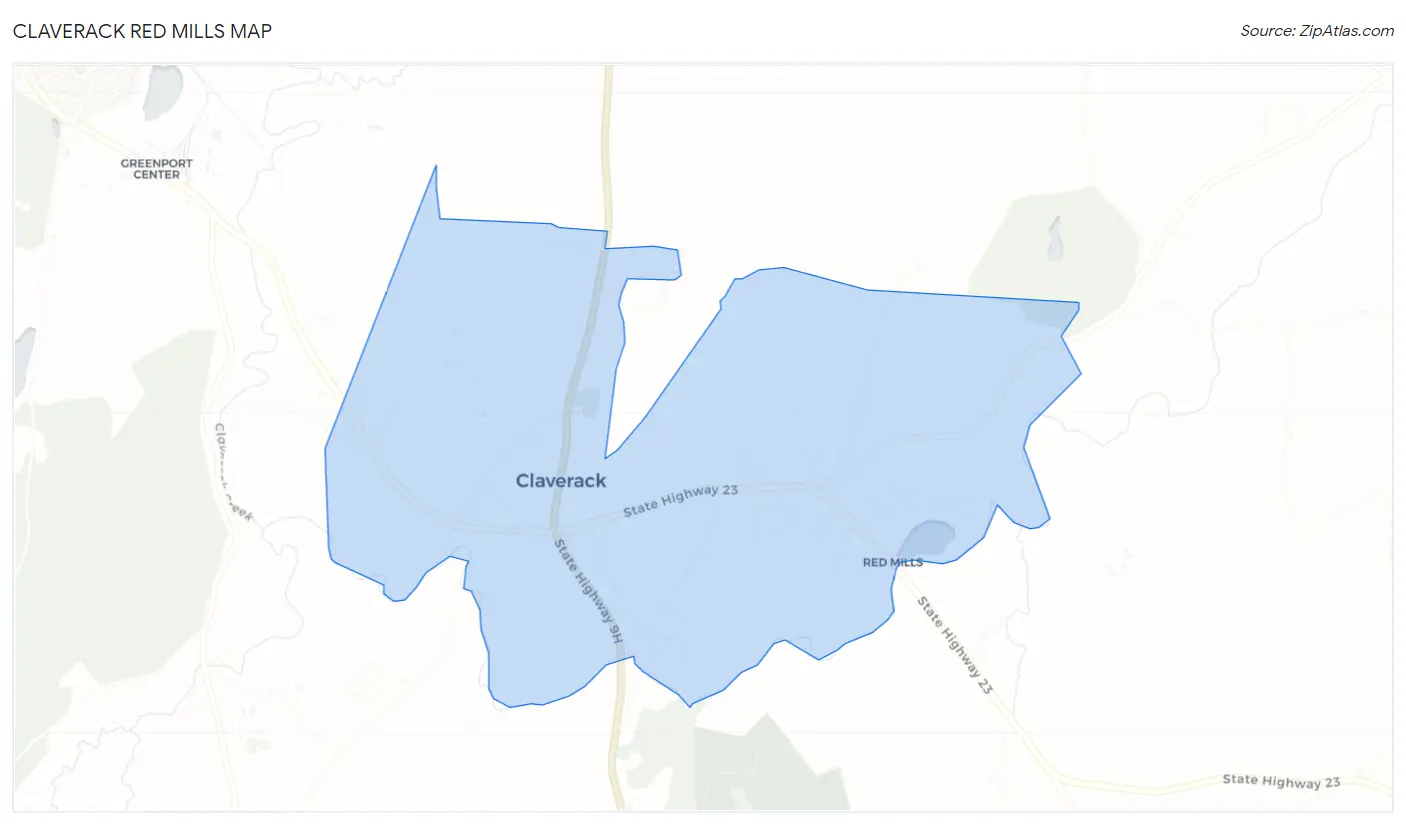
Claverack Red Mills Map
Claverack Red Mills Overview
$63,285
PER CAPITA INCOME
$157,917
AVG FAMILY INCOME
$147,500
AVG HOUSEHOLD INCOME
13.0%
WAGE / INCOME GAP [ % ]
87.0¢/ $1
WAGE / INCOME GAP [ $ ]
0.30
INEQUALITY / GINI INDEX
1,042
TOTAL POPULATION
558
MALE POPULATION
484
FEMALE POPULATION
115.29
MALES / 100 FEMALES
86.74
FEMALES / 100 MALES
55.4
MEDIAN AGE
2.7
AVG FAMILY SIZE
2.5
AVG HOUSEHOLD SIZE
661
LABOR FORCE [ PEOPLE ]
68.1%
PERCENT IN LABOR FORCE
Income in Claverack Red Mills
Income Overview in Claverack Red Mills
Per Capita Income in Claverack Red Mills is $63,285, while median incomes of families and households are $157,917 and $147,500 respectively.
| Characteristic | Number | Measure |
| Per Capita Income | 1,042 | $63,285 |
| Median Family Income | 291 | $157,917 |
| Mean Family Income | 291 | $147,277 |
| Median Household Income | 420 | $147,500 |
| Mean Household Income | 420 | $158,561 |
| Income Deficit | 291 | $0 |
| Wage / Income Gap (%) | 1,042 | 13.05% |
| Wage / Income Gap ($) | 1,042 | 86.95¢ per $1 |
| Gini / Inequality Index | 1,042 | 0.30 |
Earnings by Sex in Claverack Red Mills
Average Earnings in Claverack Red Mills are $57,650, $55,697 for men and $64,053 for women, a difference of 13.1%.
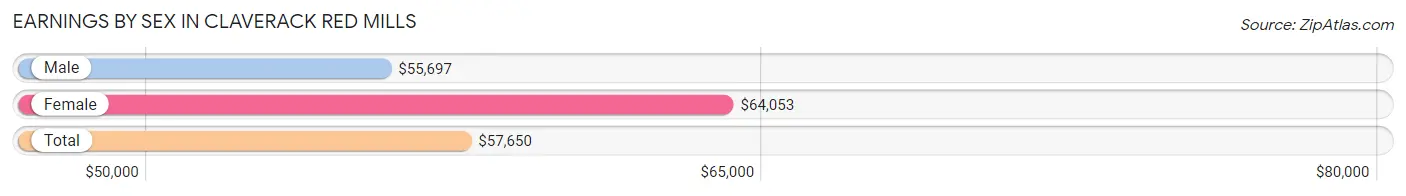
| Sex | Number | Average Earnings |
| Male | 342 (48.1%) | $55,697 |
| Female | 369 (51.9%) | $64,053 |
| Total | 711 (100.0%) | $57,650 |
Earnings by Sex by Income Bracket in Claverack Red Mills
The most common earnings brackets in Claverack Red Mills are $100,000+ for men (74 | 21.6%) and $5,000 to $7,499 for women (87 | 23.6%).
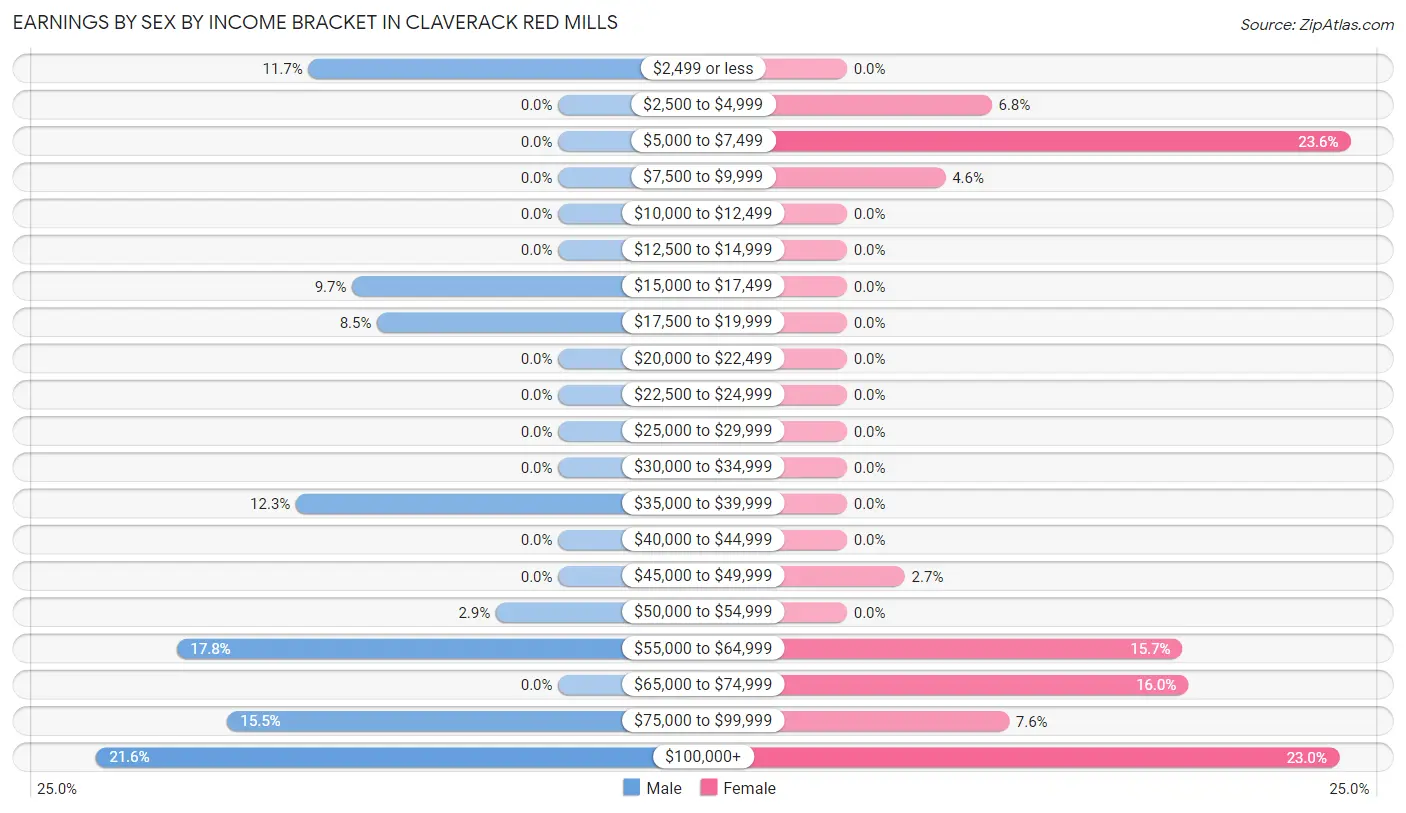
| Income | Male | Female |
| $2,499 or less | 40 (11.7%) | 0 (0.0%) |
| $2,500 to $4,999 | 0 (0.0%) | 25 (6.8%) |
| $5,000 to $7,499 | 0 (0.0%) | 87 (23.6%) |
| $7,500 to $9,999 | 0 (0.0%) | 17 (4.6%) |
| $10,000 to $12,499 | 0 (0.0%) | 0 (0.0%) |
| $12,500 to $14,999 | 0 (0.0%) | 0 (0.0%) |
| $15,000 to $17,499 | 33 (9.7%) | 0 (0.0%) |
| $17,500 to $19,999 | 29 (8.5%) | 0 (0.0%) |
| $20,000 to $22,499 | 0 (0.0%) | 0 (0.0%) |
| $22,500 to $24,999 | 0 (0.0%) | 0 (0.0%) |
| $25,000 to $29,999 | 0 (0.0%) | 0 (0.0%) |
| $30,000 to $34,999 | 0 (0.0%) | 0 (0.0%) |
| $35,000 to $39,999 | 42 (12.3%) | 0 (0.0%) |
| $40,000 to $44,999 | 0 (0.0%) | 0 (0.0%) |
| $45,000 to $49,999 | 0 (0.0%) | 10 (2.7%) |
| $50,000 to $54,999 | 10 (2.9%) | 0 (0.0%) |
| $55,000 to $64,999 | 61 (17.8%) | 58 (15.7%) |
| $65,000 to $74,999 | 0 (0.0%) | 59 (16.0%) |
| $75,000 to $99,999 | 53 (15.5%) | 28 (7.6%) |
| $100,000+ | 74 (21.6%) | 85 (23.0%) |
| Total | 342 (100.0%) | 369 (100.0%) |
Earnings by Sex by Educational Attainment in Claverack Red Mills
Average earnings in Claverack Red Mills are $56,721 for men and $68,814 for women, a difference of 17.6%. Men with an educational attainment of graduate degree enjoy the highest average annual earnings of $86,769, while those with college or associate's degree education earn the least with $55,717. Women with an educational attainment of bachelor's degree earn the most with the average annual earnings of $68,284, while those with bachelor's degree education have the smallest earnings of $68,284.
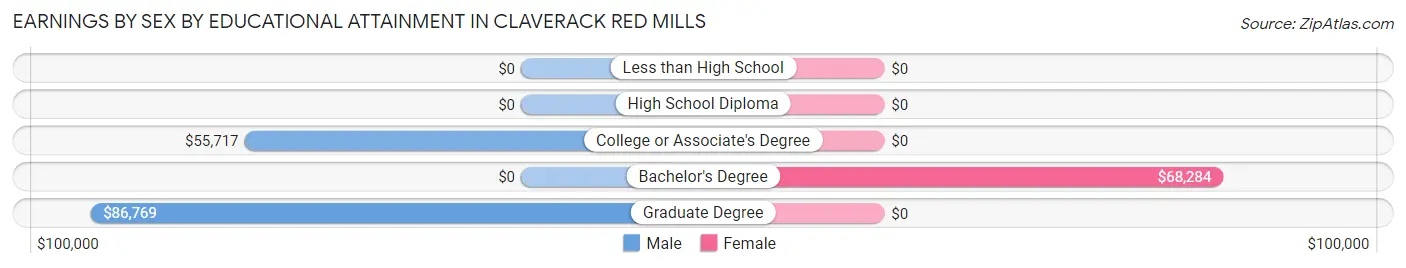
| Educational Attainment | Male Income | Female Income |
| Less than High School | - | - |
| High School Diploma | - | - |
| College or Associate's Degree | $55,717 | $0 |
| Bachelor's Degree | - | - |
| Graduate Degree | $86,769 | $0 |
| Total | $56,721 | $68,814 |
Family Income in Claverack Red Mills
Family Income Brackets in Claverack Red Mills
According to the Claverack Red Mills family income data, there are 93 families falling into the $200,000+ income range, which is the most common income bracket and makes up 32.0% of all families.
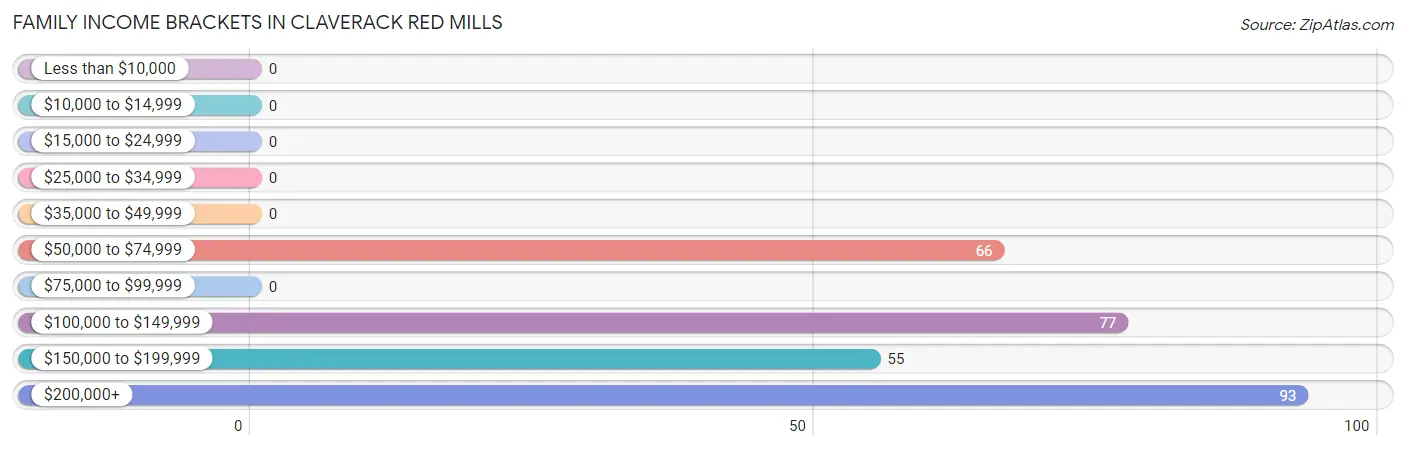
| Income Bracket | # Families | % Families |
| Less than $10,000 | 0 | 0.0% |
| $10,000 to $14,999 | 0 | 0.0% |
| $15,000 to $24,999 | 0 | 0.0% |
| $25,000 to $34,999 | 0 | 0.0% |
| $35,000 to $49,999 | 0 | 0.0% |
| $50,000 to $74,999 | 66 | 22.7% |
| $75,000 to $99,999 | 0 | 0.0% |
| $100,000 to $149,999 | 77 | 26.5% |
| $150,000 to $199,999 | 55 | 18.9% |
| $200,000+ | 93 | 32.0% |
Family Income by Famaliy Size in Claverack Red Mills
2-person families (188 | 64.6%) account for the highest median family income in Claverack Red Mills with $123,409 per family, while 2-person families (188 | 64.6%) have the highest median income of $61,704 per family member.
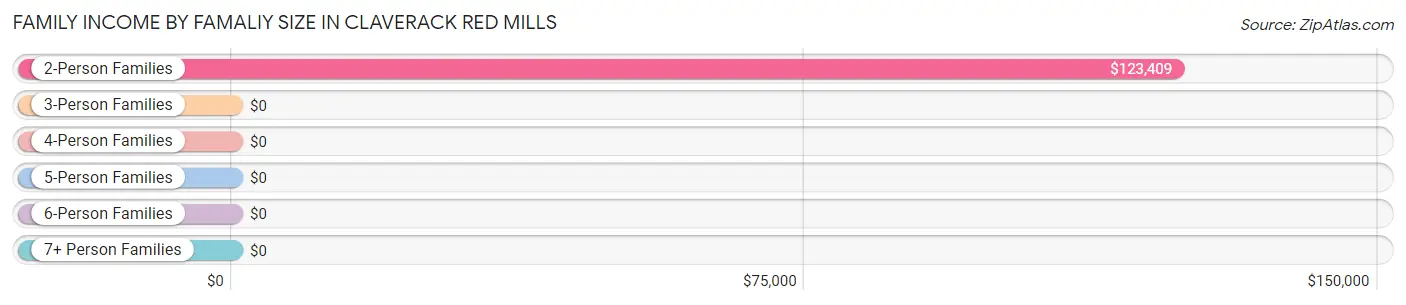
| Income Bracket | # Families | Median Income |
| 2-Person Families | 188 (64.6%) | $123,409 |
| 3-Person Families | 39 (13.4%) | $0 |
| 4-Person Families | 64 (22.0%) | $0 |
| 5-Person Families | 0 (0.0%) | $0 |
| 6-Person Families | 0 (0.0%) | $0 |
| 7+ Person Families | 0 (0.0%) | $0 |
| Total | 291 (100.0%) | $157,917 |
Family Income by Number of Earners in Claverack Red Mills
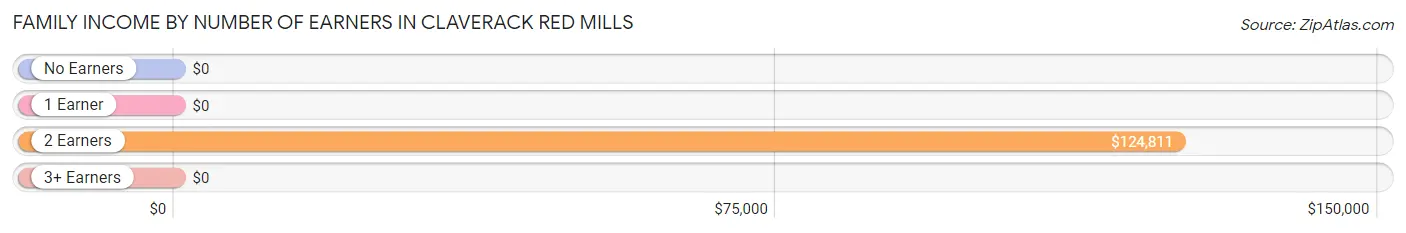
| Number of Earners | # Families | Median Income |
| No Earners | 63 (21.6%) | $0 |
| 1 Earner | 15 (5.1%) | $0 |
| 2 Earners | 139 (47.8%) | $124,811 |
| 3+ Earners | 74 (25.4%) | $0 |
| Total | 291 (100.0%) | $157,917 |
Household Income in Claverack Red Mills
Household Income Brackets in Claverack Red Mills
With 155 households falling in the category, the $200,000+ income range is the most frequent in Claverack Red Mills, accounting for 36.9% of all households.
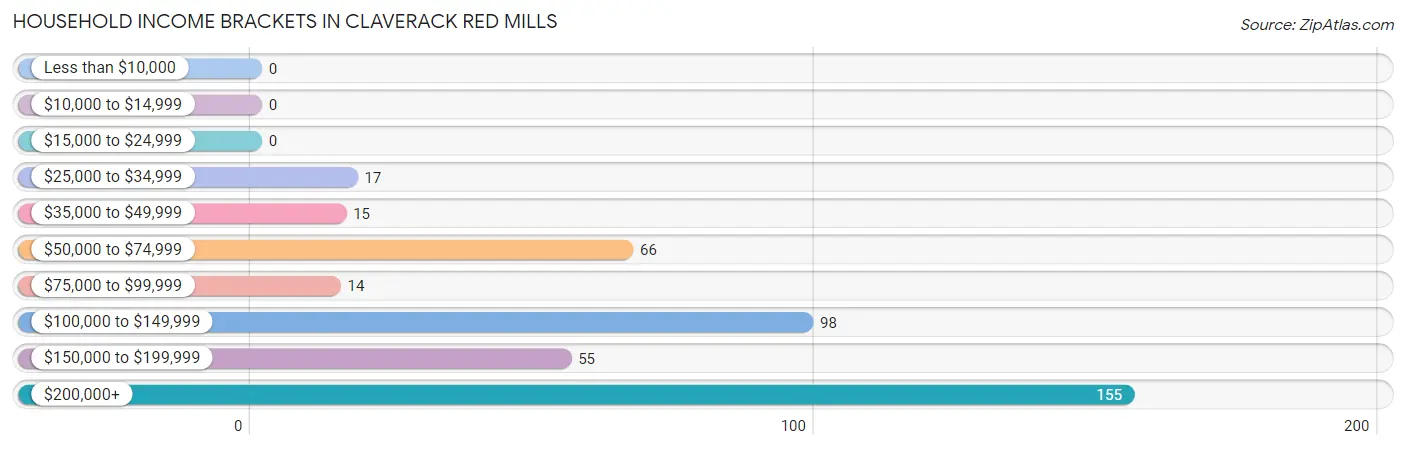
| Income Bracket | # Households | % Households |
| Less than $10,000 | 0 | 0.0% |
| $10,000 to $14,999 | 0 | 0.0% |
| $15,000 to $24,999 | 0 | 0.0% |
| $25,000 to $34,999 | 17 | 4.0% |
| $35,000 to $49,999 | 15 | 3.6% |
| $50,000 to $74,999 | 66 | 15.7% |
| $75,000 to $99,999 | 14 | 3.3% |
| $100,000 to $149,999 | 98 | 23.3% |
| $150,000 to $199,999 | 55 | 13.1% |
| $200,000+ | 155 | 36.9% |
Household Income by Householder Age in Claverack Red Mills
The median household income in Claverack Red Mills is $147,500, with the highest median household income of $222,598 found in the 45 to 64 years age bracket for the primary householder. A total of 247 households (58.8%) fall into this category.
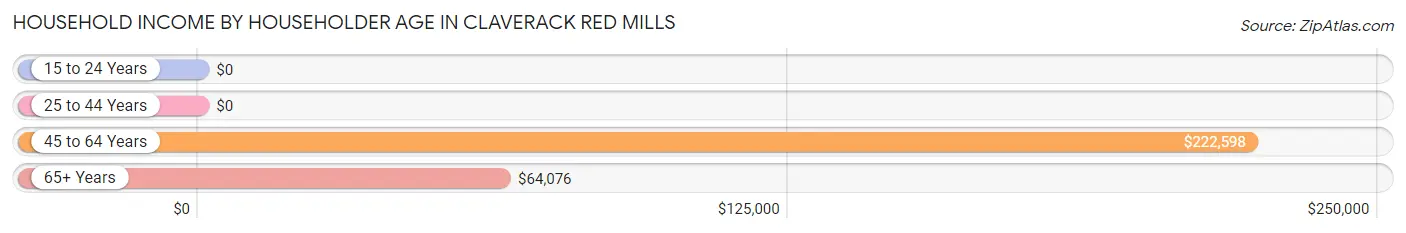
| Income Bracket | # Households | Median Income |
| 15 to 24 Years | 0 (0.0%) | $0 |
| 25 to 44 Years | 28 (6.7%) | $0 |
| 45 to 64 Years | 247 (58.8%) | $222,598 |
| 65+ Years | 145 (34.5%) | $64,076 |
| Total | 420 (100.0%) | $147,500 |
Poverty in Claverack Red Mills
Income Below Poverty by Sex and Age in Claverack Red Mills
| Age Bracket | Male | Female |
| Under 5 Years | 0 (0.0%) | 0 (0.0%) |
| 5 Years | 0 (0.0%) | 0 (0.0%) |
| 6 to 11 Years | 0 (0.0%) | 0 (0.0%) |
| 12 to 14 Years | 0 (0.0%) | 0 (0.0%) |
| 15 Years | 0 (0.0%) | 0 (0.0%) |
| 16 and 17 Years | 0 (0.0%) | 0 (0.0%) |
| 18 to 24 Years | 0 (0.0%) | 0 (0.0%) |
| 25 to 34 Years | 0 (0.0%) | 0 (0.0%) |
| 35 to 44 Years | 0 (0.0%) | 0 (0.0%) |
| 45 to 54 Years | 0 (0.0%) | 0 (0.0%) |
| 55 to 64 Years | 0 (0.0%) | 0 (0.0%) |
| 65 to 74 Years | 0 (0.0%) | 0 (0.0%) |
| 75 Years and over | 0 (0.0%) | 0 (0.0%) |
| Total | 0 (0.0%) | 0 (0.0%) |
Income Above Poverty by Sex and Age in Claverack Red Mills
According to the poverty statistics in Claverack Red Mills, males aged 12 to 14 years and females aged 18 to 24 years are the age groups that are most secure financially, with 100.0% of males and 100.0% of females in these age groups living above the poverty line.
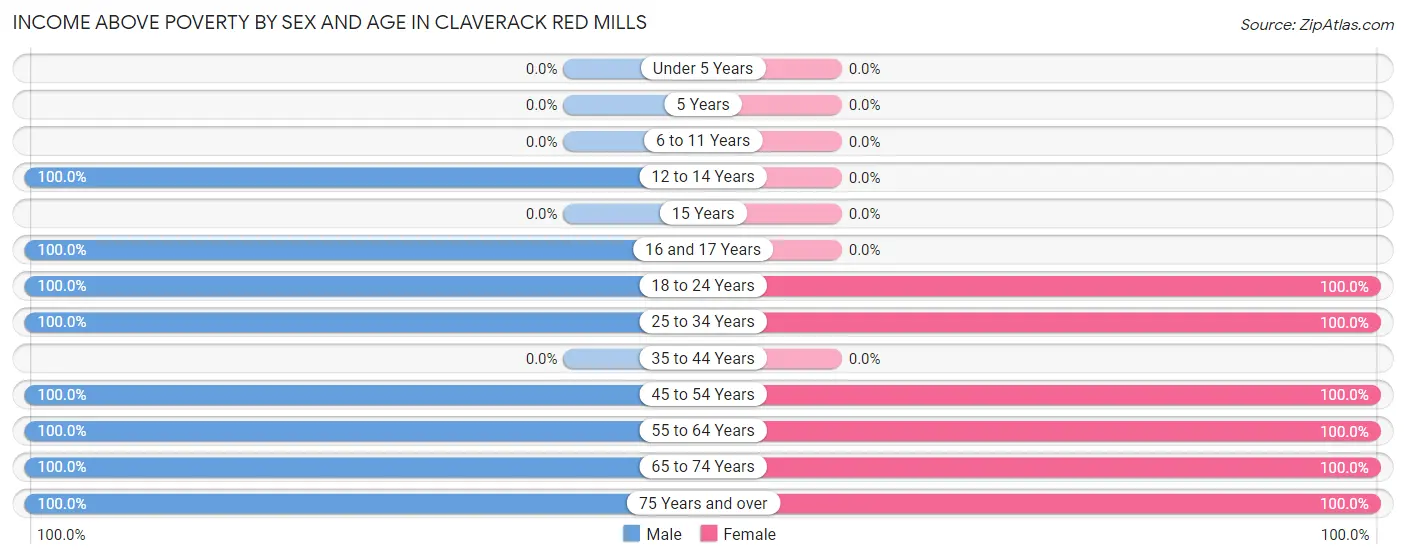
| Age Bracket | Male | Female |
| Under 5 Years | 0 (0.0%) | 0 (0.0%) |
| 5 Years | 0 (0.0%) | 0 (0.0%) |
| 6 to 11 Years | 0 (0.0%) | 0 (0.0%) |
| 12 to 14 Years | 71 (100.0%) | 0 (0.0%) |
| 15 Years | 0 (0.0%) | 0 (0.0%) |
| 16 and 17 Years | 17 (100.0%) | 0 (0.0%) |
| 18 to 24 Years | 33 (100.0%) | 87 (100.0%) |
| 25 to 34 Years | 26 (100.0%) | 28 (100.0%) |
| 35 to 44 Years | 0 (0.0%) | 0 (0.0%) |
| 45 to 54 Years | 71 (100.0%) | 130 (100.0%) |
| 55 to 64 Years | 168 (100.0%) | 131 (100.0%) |
| 65 to 74 Years | 81 (100.0%) | 22 (100.0%) |
| 75 Years and over | 91 (100.0%) | 86 (100.0%) |
| Total | 558 (100.0%) | 484 (100.0%) |
Income Below Poverty Among Married-Couple Families in Claverack Red Mills
| Children | Above Poverty | Below Poverty |
| No Children | 217 (100.0%) | 0 (0.0%) |
| 1 or 2 Children | 74 (100.0%) | 0 (0.0%) |
| 3 or 4 Children | 0 (0.0%) | 0 (0.0%) |
| 5 or more Children | 0 (0.0%) | 0 (0.0%) |
| Total | 291 (100.0%) | 0 (0.0%) |
Income Below Poverty Among Single-Parent Households in Claverack Red Mills
| Children | Single Father | Single Mother |
| No Children | 0 (0.0%) | 0 (0.0%) |
| 1 or 2 Children | 0 (0.0%) | 0 (0.0%) |
| 3 or 4 Children | 0 (0.0%) | 0 (0.0%) |
| 5 or more Children | 0 (0.0%) | 0 (0.0%) |
| Total | 0 (0.0%) | 0 (0.0%) |
Income Below Poverty Among Married-Couple vs Single-Parent Households in Claverack Red Mills
| Children | Married-Couple Families | Single-Parent Households |
| No Children | 0 (0.0%) | 0 (0.0%) |
| 1 or 2 Children | 0 (0.0%) | 0 (0.0%) |
| 3 or 4 Children | 0 (0.0%) | 0 (0.0%) |
| 5 or more Children | 0 (0.0%) | 0 (0.0%) |
| Total | 0 (0.0%) | 0 (0.0%) |
Race in Claverack Red Mills
The most populous races in Claverack Red Mills are White / Caucasian (1,028 | 98.7%), and Asian (14 | 1.3%).
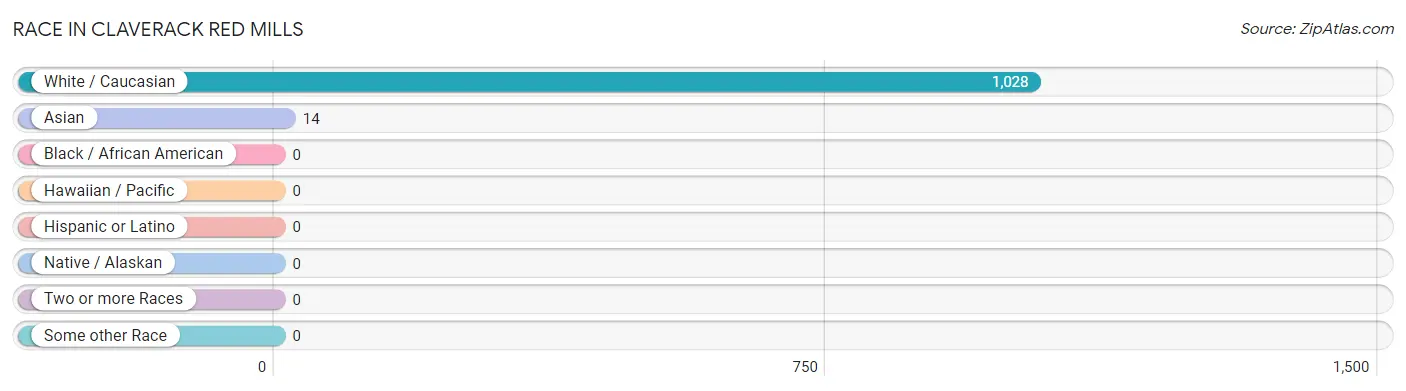
| Race | # Population | % Population |
| Asian | 14 | 1.3% |
| Black / African American | 0 | 0.0% |
| Hawaiian / Pacific | 0 | 0.0% |
| Hispanic or Latino | 0 | 0.0% |
| Native / Alaskan | 0 | 0.0% |
| White / Caucasian | 1,028 | 98.7% |
| Two or more Races | 0 | 0.0% |
| Some other Race | 0 | 0.0% |
| Total | 1,042 | 100.0% |
Ancestry in Claverack Red Mills
The most populous ancestries reported in Claverack Red Mills are Italian (293 | 28.1%), French Canadian (217 | 20.8%), German (212 | 20.3%), French (129 | 12.4%), and Irish (119 | 11.4%), together accounting for 93.1% of all Claverack Red Mills residents.
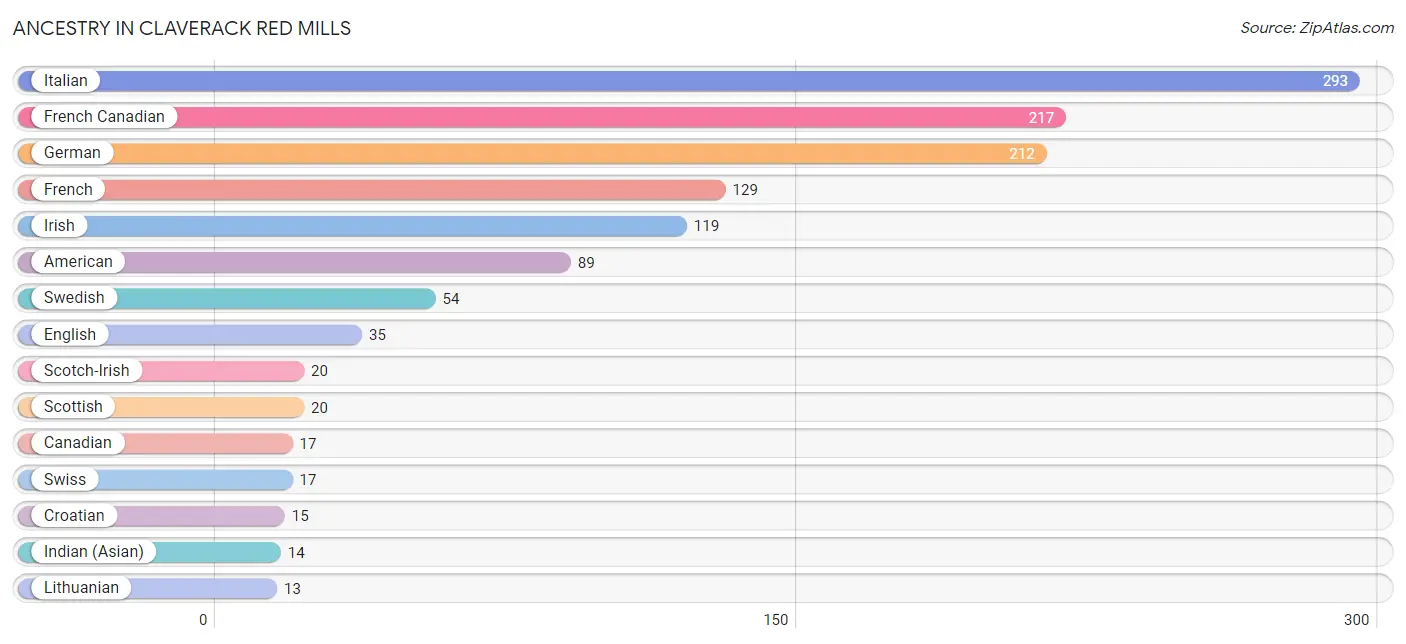
| Ancestry | # Population | % Population |
| American | 89 | 8.5% |
| Canadian | 17 | 1.6% |
| Croatian | 15 | 1.4% |
| English | 35 | 3.4% |
| French | 129 | 12.4% |
| French Canadian | 217 | 20.8% |
| German | 212 | 20.3% |
| Indian (Asian) | 14 | 1.3% |
| Irish | 119 | 11.4% |
| Italian | 293 | 28.1% |
| Lithuanian | 13 | 1.3% |
| Scotch-Irish | 20 | 1.9% |
| Scottish | 20 | 1.9% |
| Swedish | 54 | 5.2% |
| Swiss | 17 | 1.6% |
| Ukrainian | 10 | 1.0% | View All 16 Rows |
Immigrants in Claverack Red Mills
The most numerous immigrant groups reported in Claverack Red Mills came from Brazil (25 | 2.4%), Latin America (25 | 2.4%), South America (25 | 2.4%), Canada (17 | 1.6%), and Asia (14 | 1.3%), together accounting for 10.2% of all Claverack Red Mills residents.
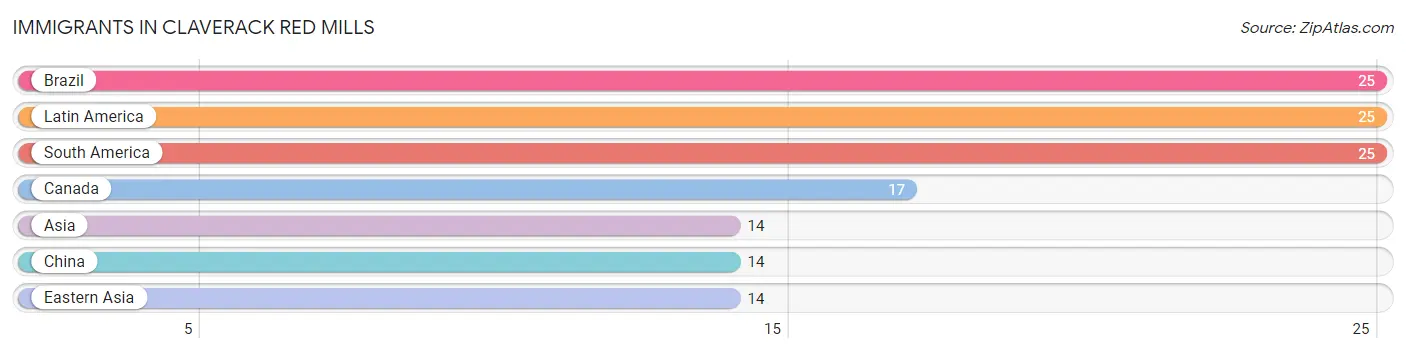
| Immigration Origin | # Population | % Population |
| Asia | 14 | 1.3% |
| Brazil | 25 | 2.4% |
| Canada | 17 | 1.6% |
| China | 14 | 1.3% |
| Eastern Asia | 14 | 1.3% |
| Latin America | 25 | 2.4% |
| South America | 25 | 2.4% | View All 7 Rows |
Sex and Age in Claverack Red Mills
Sex and Age in Claverack Red Mills
The most populous age groups in Claverack Red Mills are 55 to 59 Years (153 | 27.4%) for men and 55 to 59 Years (131 | 27.1%) for women.
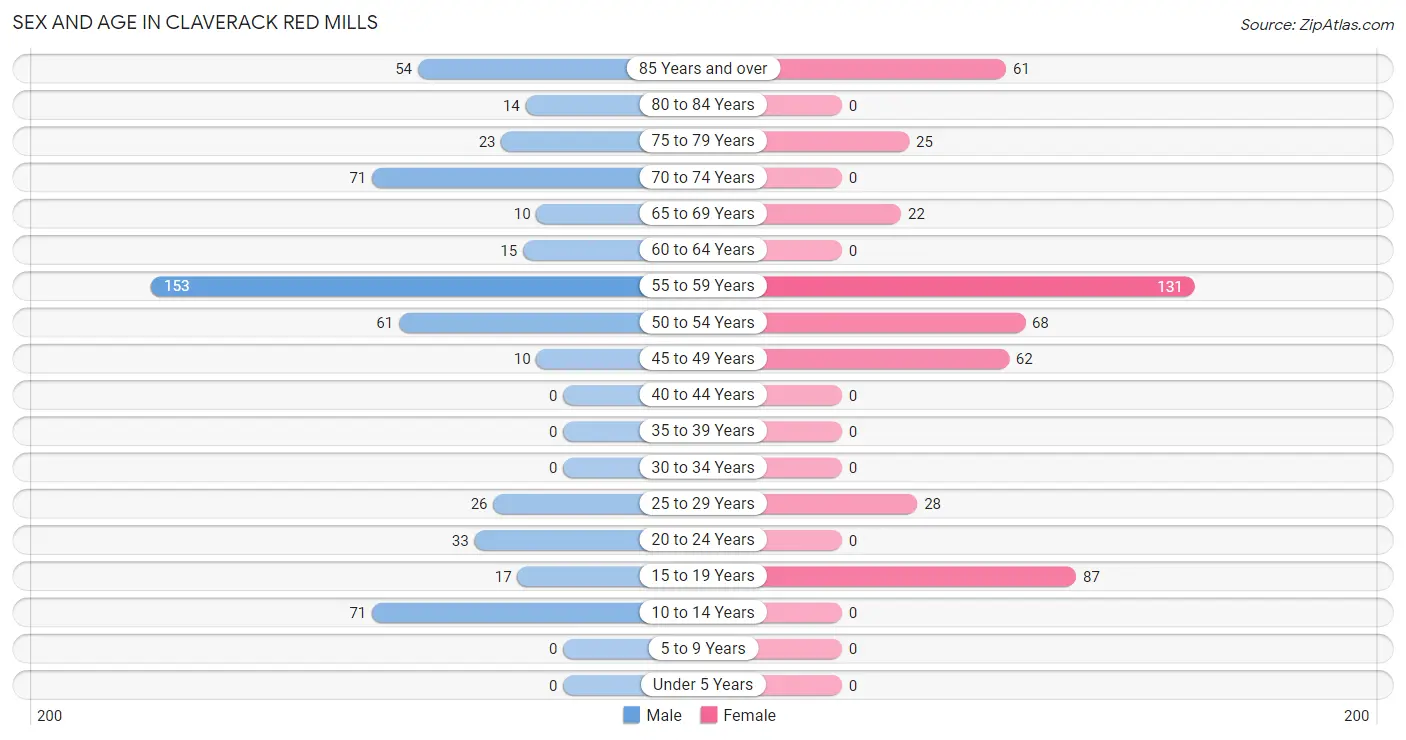
| Age Bracket | Male | Female |
| Under 5 Years | 0 (0.0%) | 0 (0.0%) |
| 5 to 9 Years | 0 (0.0%) | 0 (0.0%) |
| 10 to 14 Years | 71 (12.7%) | 0 (0.0%) |
| 15 to 19 Years | 17 (3.0%) | 87 (18.0%) |
| 20 to 24 Years | 33 (5.9%) | 0 (0.0%) |
| 25 to 29 Years | 26 (4.7%) | 28 (5.8%) |
| 30 to 34 Years | 0 (0.0%) | 0 (0.0%) |
| 35 to 39 Years | 0 (0.0%) | 0 (0.0%) |
| 40 to 44 Years | 0 (0.0%) | 0 (0.0%) |
| 45 to 49 Years | 10 (1.8%) | 62 (12.8%) |
| 50 to 54 Years | 61 (10.9%) | 68 (14.1%) |
| 55 to 59 Years | 153 (27.4%) | 131 (27.1%) |
| 60 to 64 Years | 15 (2.7%) | 0 (0.0%) |
| 65 to 69 Years | 10 (1.8%) | 22 (4.5%) |
| 70 to 74 Years | 71 (12.7%) | 0 (0.0%) |
| 75 to 79 Years | 23 (4.1%) | 25 (5.2%) |
| 80 to 84 Years | 14 (2.5%) | 0 (0.0%) |
| 85 Years and over | 54 (9.7%) | 61 (12.6%) |
| Total | 558 (100.0%) | 484 (100.0%) |
Families and Households in Claverack Red Mills
Median Family Size in Claverack Red Mills
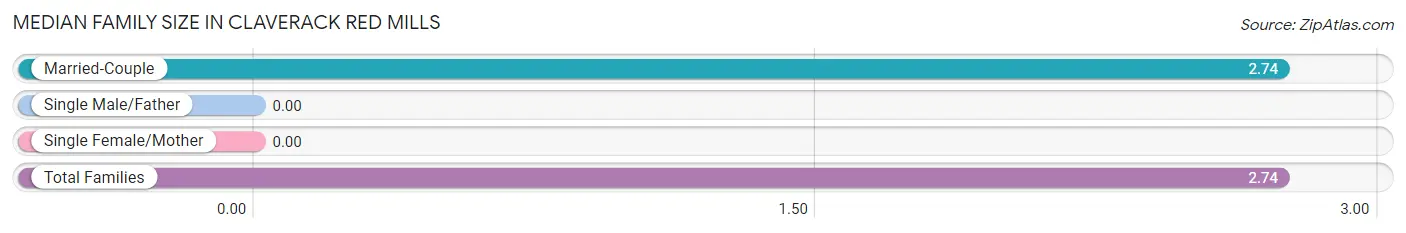
| Family Type | # Families | Family Size |
| Married-Couple | 291 (100.0%) | 2.74 |
| Single Male/Father | 0 (0.0%) | - |
| Single Female/Mother | 0 (0.0%) | - |
| Total Families | 291 (100.0%) | 2.74 |
Median Household Size in Claverack Red Mills
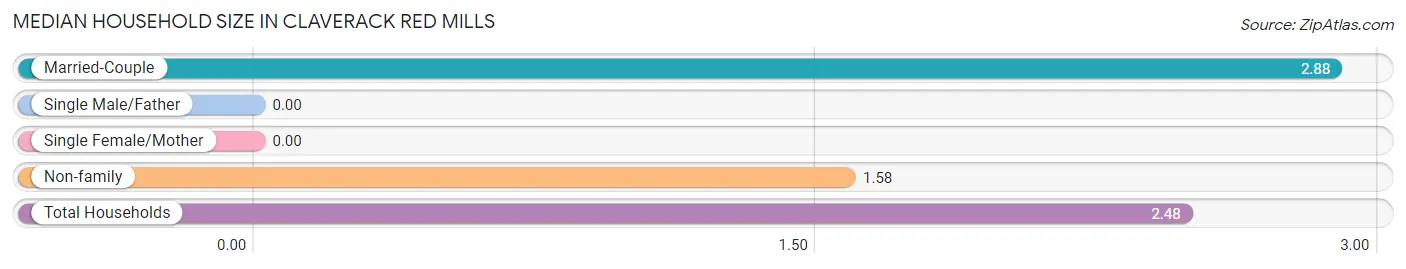
| Household Type | # Households | Household Size |
| Married-Couple | 291 (69.3%) | 2.88 |
| Single Male/Father | 0 (0.0%) | - |
| Single Female/Mother | 0 (0.0%) | - |
| Non-family | 129 (30.7%) | 1.58 |
| Total Households | 420 (100.0%) | 2.48 |
Household Size by Marriage Status in Claverack Red Mills
Out of a total of 420 households in Claverack Red Mills, 291 (69.3%) are family households, while 129 (30.7%) are nonfamily households. The most numerous type of family households are 2-person households, comprising 188, and the most common type of nonfamily households are 2-person households, comprising 83.
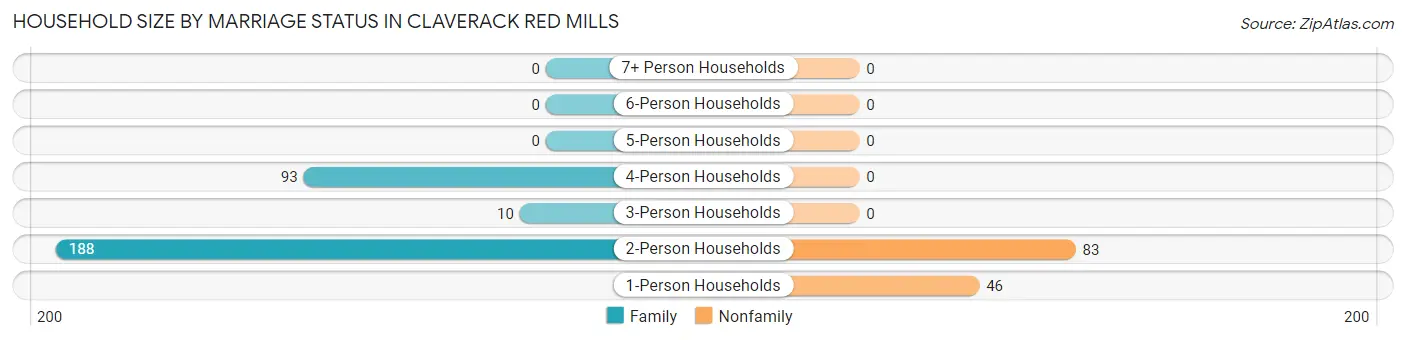
| Household Size | Family Households | Nonfamily Households |
| 1-Person Households | - | 46 (11.0%) |
| 2-Person Households | 188 (44.8%) | 83 (19.8%) |
| 3-Person Households | 10 (2.4%) | 0 (0.0%) |
| 4-Person Households | 93 (22.1%) | 0 (0.0%) |
| 5-Person Households | 0 (0.0%) | 0 (0.0%) |
| 6-Person Households | 0 (0.0%) | 0 (0.0%) |
| 7+ Person Households | 0 (0.0%) | 0 (0.0%) |
| Total | 291 (69.3%) | 129 (30.7%) |
Female Fertility in Claverack Red Mills
Fertility by Age in Claverack Red Mills
| Age Bracket | Women with Births | Births / 1,000 Women |
| 15 to 19 years | 0 (0.0%) | 0.0 |
| 20 to 34 years | 0 (0.0%) | 0.0 |
| 35 to 50 years | 0 (0.0%) | 0.0 |
| Total | 0 (0.0%) | 0.0 |
Fertility by Age by Marriage Status in Claverack Red Mills
| Age Bracket | Married | Unmarried |
| 15 to 19 years | 0 (0.0%) | 0 (0.0%) |
| 20 to 34 years | 0 (0.0%) | 0 (0.0%) |
| 35 to 50 years | 0 (0.0%) | 0 (0.0%) |
| Total | 0 (0.0%) | 0 (0.0%) |
Fertility by Education in Claverack Red Mills
| Educational Attainment | Women with Births | Births / 1,000 Women |
| Less than High School | 0 (0.0%) | 0.0 |
| High School Diploma | 0 (0.0%) | 0.0 |
| College or Associate's Degree | 0 (0.0%) | 0.0 |
| Bachelor's Degree | 0 (0.0%) | 0.0 |
| Graduate Degree | 0 (0.0%) | 0.0 |
| Total | 0 (0.0%) | 0.0 |
Fertility by Education by Marriage Status in Claverack Red Mills
| Educational Attainment | Married | Unmarried |
| Less than High School | 0 (0.0%) | 0 (0.0%) |
| High School Diploma | 0 (0.0%) | 0 (0.0%) |
| College or Associate's Degree | 0 (0.0%) | 0 (0.0%) |
| Bachelor's Degree | 0 (0.0%) | 0 (0.0%) |
| Graduate Degree | 0 (0.0%) | 0 (0.0%) |
| Total | 0 (0.0%) | 0 (0.0%) |
Employment Characteristics in Claverack Red Mills
Employment by Class of Employer in Claverack Red Mills
Among the 661 employed individuals in Claverack Red Mills, private company employees (271 | 41.0%), local government employees (112 | 16.9%), and not-for-profit organizations (97 | 14.7%) make up the most common classes of employment.
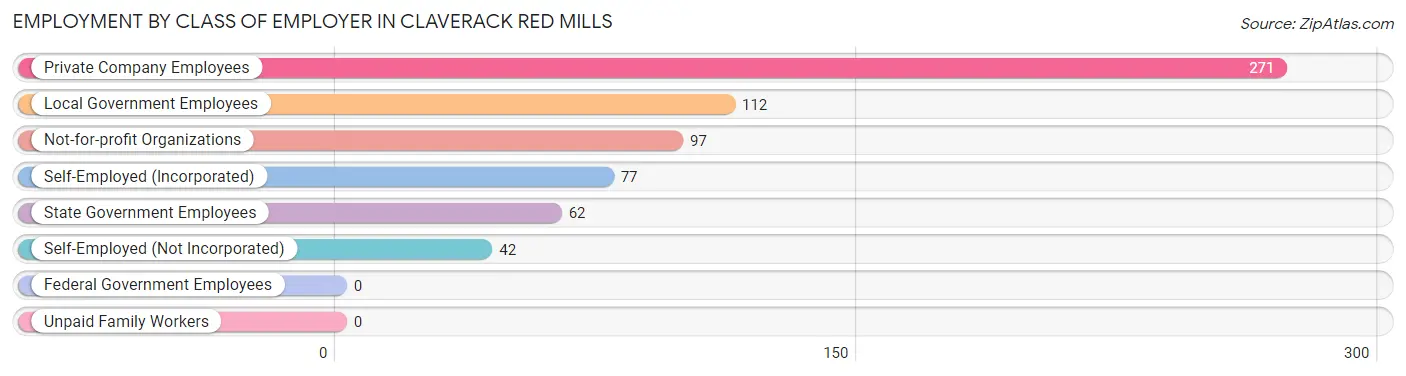
| Employer Class | # Employees | % Employees |
| Private Company Employees | 271 | 41.0% |
| Self-Employed (Incorporated) | 77 | 11.7% |
| Self-Employed (Not Incorporated) | 42 | 6.4% |
| Not-for-profit Organizations | 97 | 14.7% |
| Local Government Employees | 112 | 16.9% |
| State Government Employees | 62 | 9.4% |
| Federal Government Employees | 0 | 0.0% |
| Unpaid Family Workers | 0 | 0.0% |
| Total | 661 | 100.0% |
Employment Status by Age in Claverack Red Mills
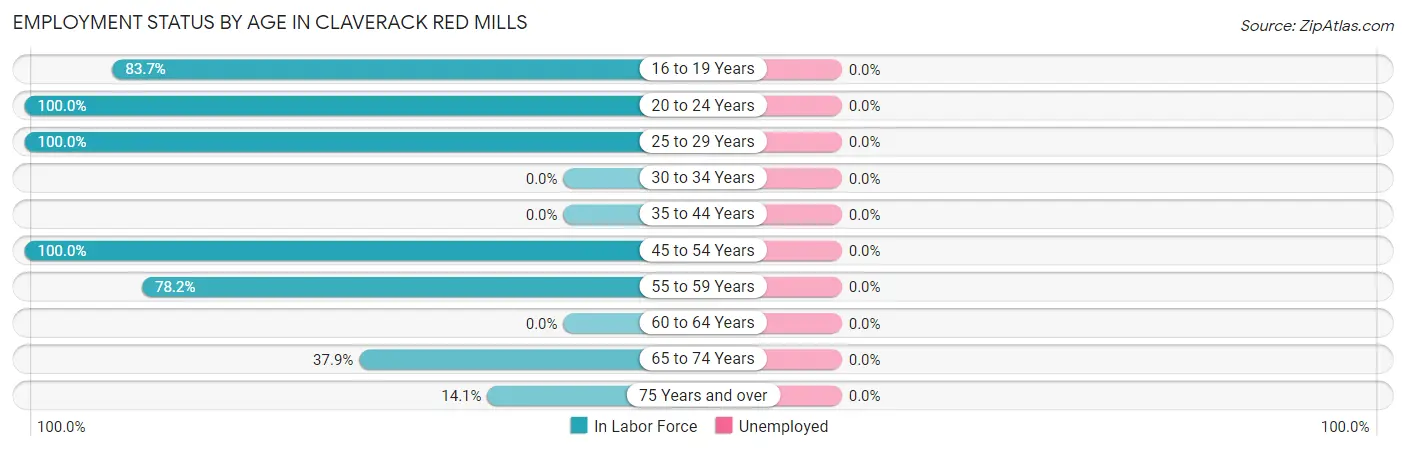
| Age Bracket | In Labor Force | Unemployed |
| 16 to 19 Years | 87 (83.7%) | 0 (0.0%) |
| 20 to 24 Years | 33 (100.0%) | 0 (0.0%) |
| 25 to 29 Years | 54 (100.0%) | 0 (0.0%) |
| 30 to 34 Years | 0 (0.0%) | 0 (0.0%) |
| 35 to 44 Years | 0 (0.0%) | 0 (0.0%) |
| 45 to 54 Years | 201 (100.0%) | 0 (0.0%) |
| 55 to 59 Years | 222 (78.2%) | 0 (0.0%) |
| 60 to 64 Years | 0 (0.0%) | 0 (0.0%) |
| 65 to 74 Years | 39 (37.9%) | 0 (0.0%) |
| 75 Years and over | 25 (14.1%) | 0 (0.0%) |
| Total | 661 (68.1%) | 0 (0.0%) |
Employment Status by Educational Attainment in Claverack Red Mills
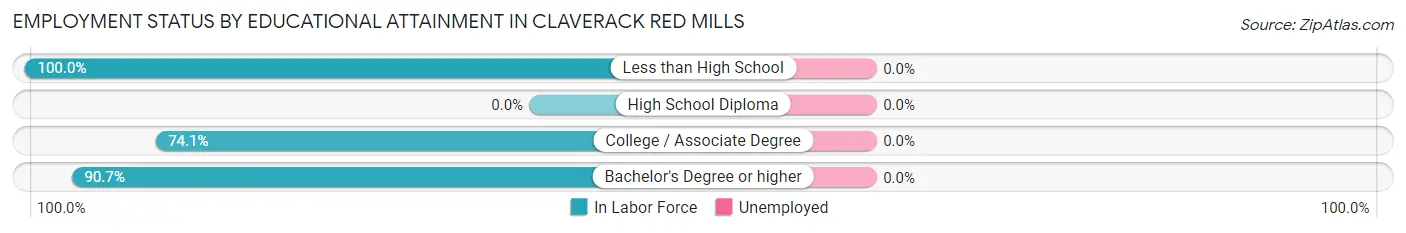
| Educational Attainment | In Labor Force | Unemployed |
| Less than High School | 16 (100.0%) | 0 (0.0%) |
| High School Diploma | 0 (0.0%) | 0 (0.0%) |
| College / Associate Degree | 120 (74.1%) | 0 (0.0%) |
| Bachelor's Degree or higher | 341 (90.7%) | 0 (0.0%) |
| Total | 477 (86.1%) | 0 (0.0%) |
Employment Occupations by Sex in Claverack Red Mills
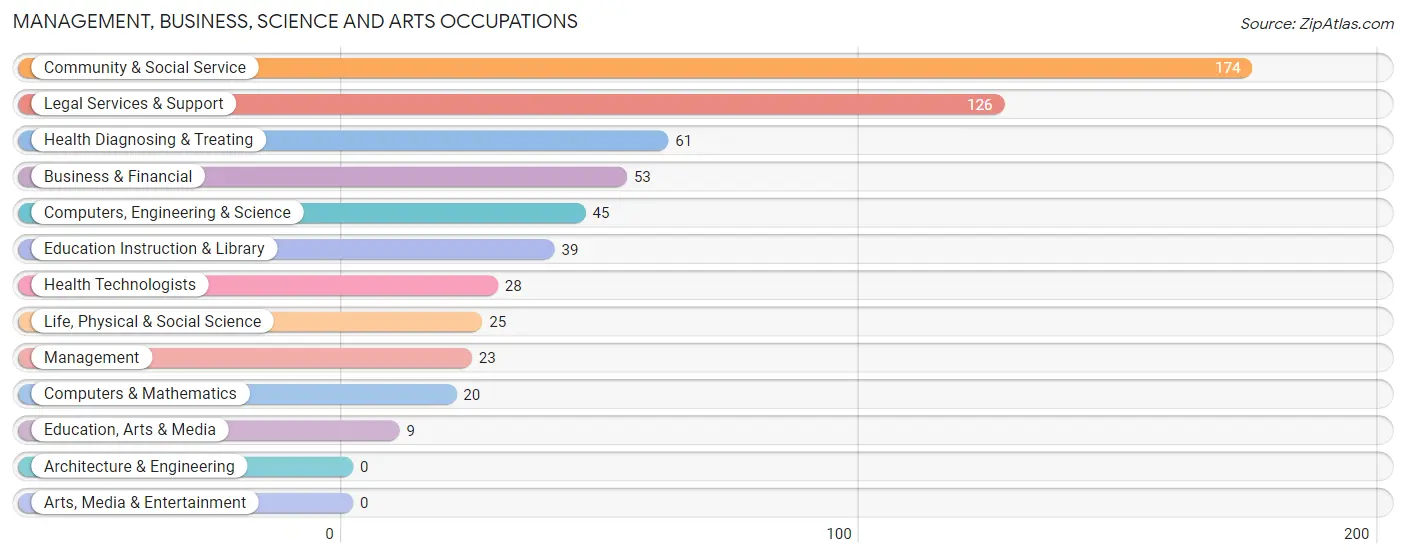
Management, Business, Science and Arts Occupations
The most common Management, Business, Science and Arts occupations in Claverack Red Mills are Community & Social Service (174 | 26.3%), Legal Services & Support (126 | 19.1%), Health Diagnosing & Treating (61 | 9.2%), Business & Financial (53 | 8.0%), and Computers, Engineering & Science (45 | 6.8%).
Management, Business, Science and Arts Occupations by Sex
Within the Management, Business, Science and Arts occupations in Claverack Red Mills, the most male-oriented occupations are Business & Financial (100.0%), Computers & Mathematics (100.0%), and Education Instruction & Library (100.0%), while the most female-oriented occupations are Management (100.0%), Life, Physical & Social Science (100.0%), and Education, Arts & Media (100.0%).
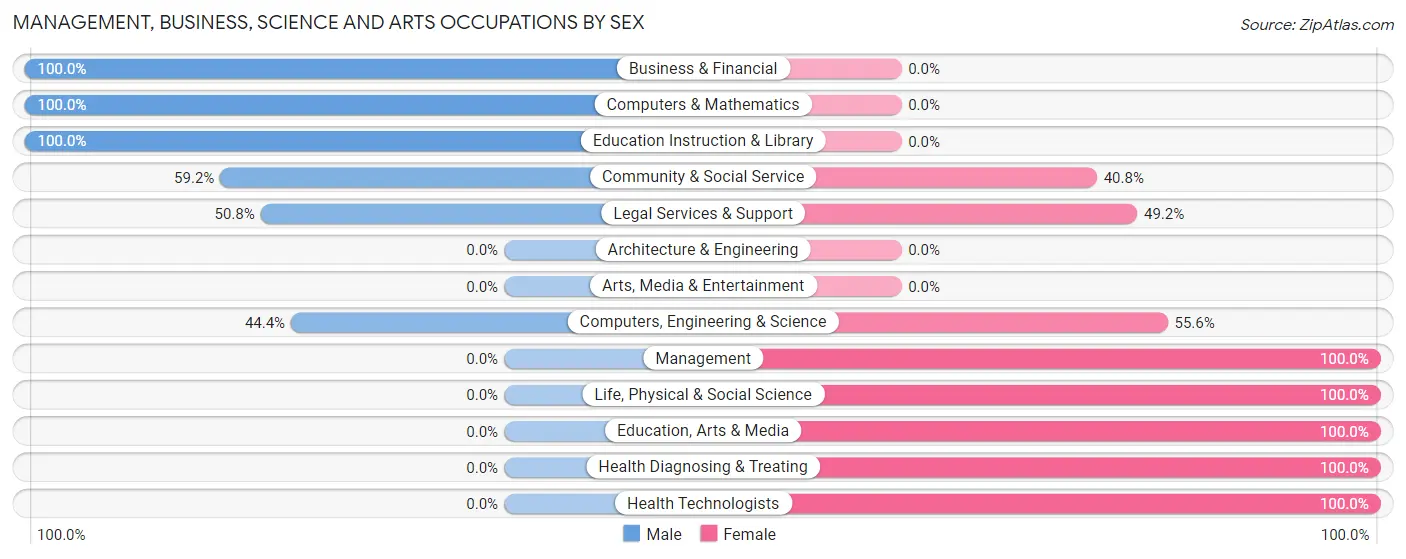
| Occupation | Male | Female |
| Management | 0 (0.0%) | 23 (100.0%) |
| Business & Financial | 53 (100.0%) | 0 (0.0%) |
| Computers, Engineering & Science | 20 (44.4%) | 25 (55.6%) |
| Computers & Mathematics | 20 (100.0%) | 0 (0.0%) |
| Architecture & Engineering | 0 (0.0%) | 0 (0.0%) |
| Life, Physical & Social Science | 0 (0.0%) | 25 (100.0%) |
| Community & Social Service | 103 (59.2%) | 71 (40.8%) |
| Education, Arts & Media | 0 (0.0%) | 9 (100.0%) |
| Legal Services & Support | 64 (50.8%) | 62 (49.2%) |
| Education Instruction & Library | 39 (100.0%) | 0 (0.0%) |
| Arts, Media & Entertainment | 0 (0.0%) | 0 (0.0%) |
| Health Diagnosing & Treating | 0 (0.0%) | 61 (100.0%) |
| Health Technologists | 0 (0.0%) | 28 (100.0%) |
| Total (Category) | 176 (49.4%) | 180 (50.6%) |
| Total (Overall) | 302 (45.7%) | 359 (54.3%) |
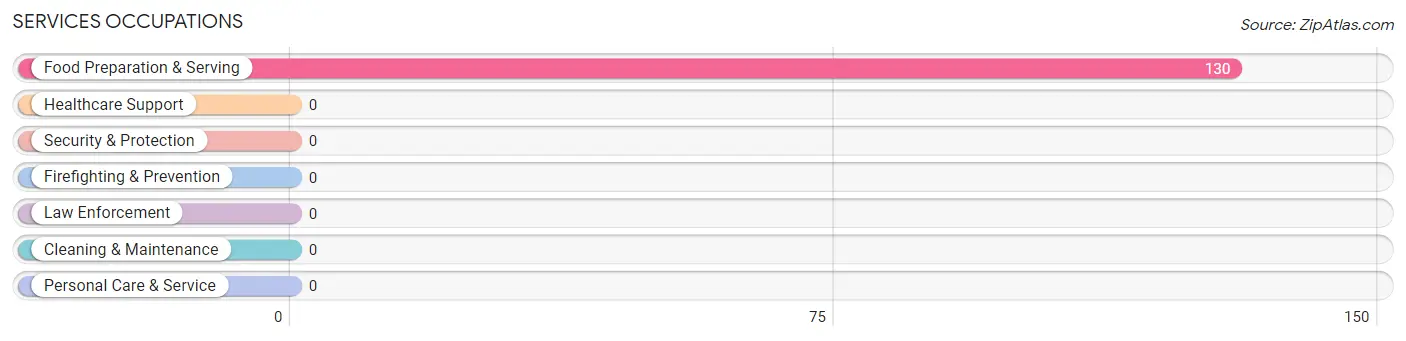
Services Occupations
The most common Services occupations in Claverack Red Mills are , and Food Preparation & Serving (130 | 19.7%).
Services Occupations by Sex
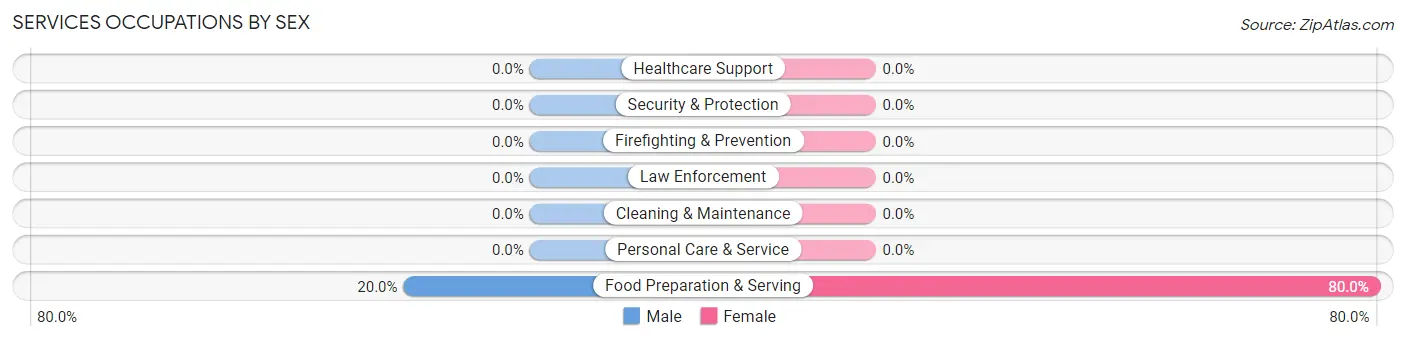
| Occupation | Male | Female |
| Healthcare Support | 0 (0.0%) | 0 (0.0%) |
| Security & Protection | 0 (0.0%) | 0 (0.0%) |
| Firefighting & Prevention | 0 (0.0%) | 0 (0.0%) |
| Law Enforcement | 0 (0.0%) | 0 (0.0%) |
| Food Preparation & Serving | 26 (20.0%) | 104 (80.0%) |
| Cleaning & Maintenance | 0 (0.0%) | 0 (0.0%) |
| Personal Care & Service | 0 (0.0%) | 0 (0.0%) |
| Total (Category) | 26 (20.0%) | 104 (80.0%) |
| Total (Overall) | 302 (45.7%) | 359 (54.3%) |
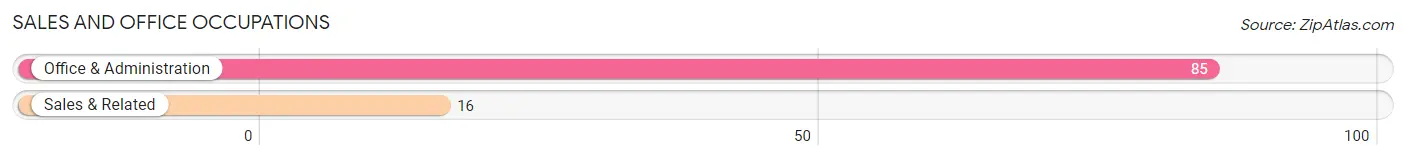
Sales and Office Occupations
The most common Sales and Office occupations in Claverack Red Mills are Office & Administration (85 | 12.9%), and Sales & Related (16 | 2.4%).
Sales and Office Occupations by Sex
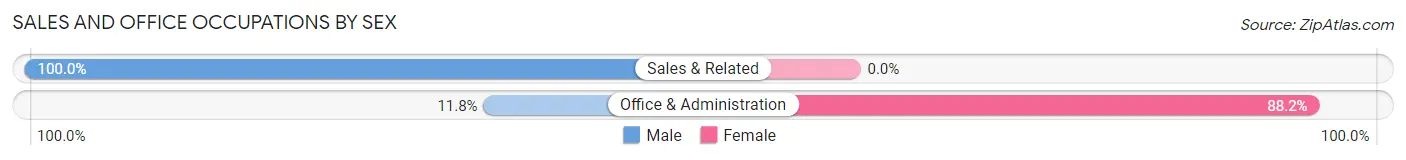
| Occupation | Male | Female |
| Sales & Related | 16 (100.0%) | 0 (0.0%) |
| Office & Administration | 10 (11.8%) | 75 (88.2%) |
| Total (Category) | 26 (25.7%) | 75 (74.3%) |
| Total (Overall) | 302 (45.7%) | 359 (54.3%) |
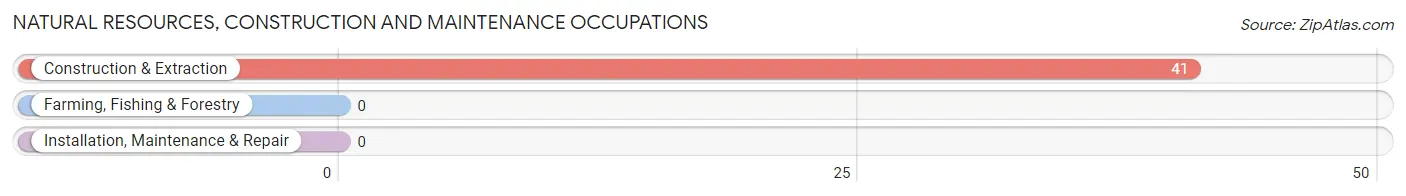
Natural Resources, Construction and Maintenance Occupations
The most common Natural Resources, Construction and Maintenance occupations in Claverack Red Mills are , and Construction & Extraction (41 | 6.2%).
Natural Resources, Construction and Maintenance Occupations by Sex
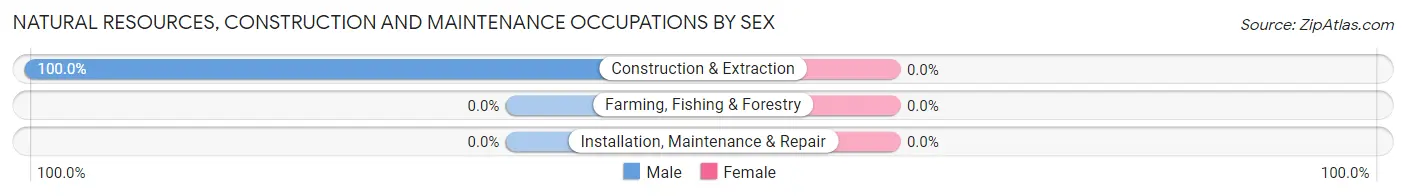
| Occupation | Male | Female |
| Farming, Fishing & Forestry | 0 (0.0%) | 0 (0.0%) |
| Construction & Extraction | 41 (100.0%) | 0 (0.0%) |
| Installation, Maintenance & Repair | 0 (0.0%) | 0 (0.0%) |
| Total (Category) | 41 (100.0%) | 0 (0.0%) |
| Total (Overall) | 302 (45.7%) | 359 (54.3%) |
Production, Transportation and Moving Occupations
The most common Production, Transportation and Moving occupations in Claverack Red Mills are , and Material Moving (33 | 5.0%).
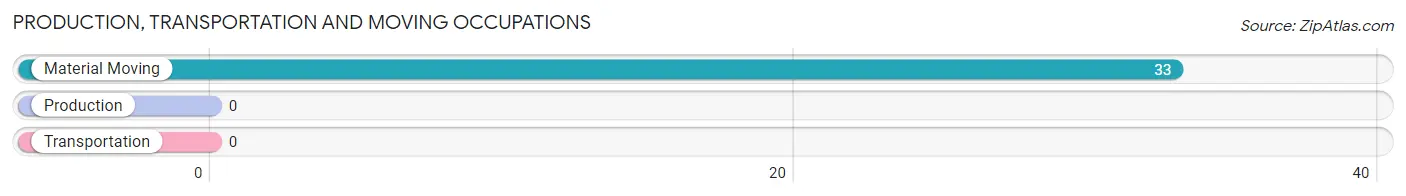
Production, Transportation and Moving Occupations by Sex
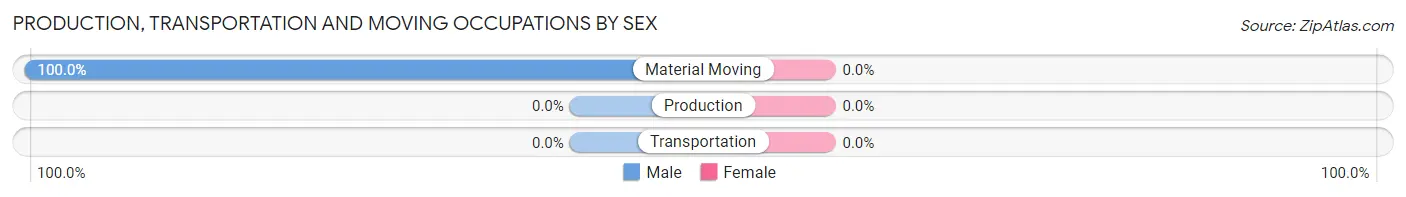
| Occupation | Male | Female |
| Production | 0 (0.0%) | 0 (0.0%) |
| Transportation | 0 (0.0%) | 0 (0.0%) |
| Material Moving | 33 (100.0%) | 0 (0.0%) |
| Total (Category) | 33 (100.0%) | 0 (0.0%) |
| Total (Overall) | 302 (45.7%) | 359 (54.3%) |
Employment Industries by Sex in Claverack Red Mills
Employment Industries in Claverack Red Mills
The major employment industries in Claverack Red Mills include Health Care & Social Assistance (210 | 31.8%), Accommodation & Food Services (113 | 17.1%), Finance & Insurance (82 | 12.4%), Public Administration (62 | 9.4%), and Educational Services (59 | 8.9%).
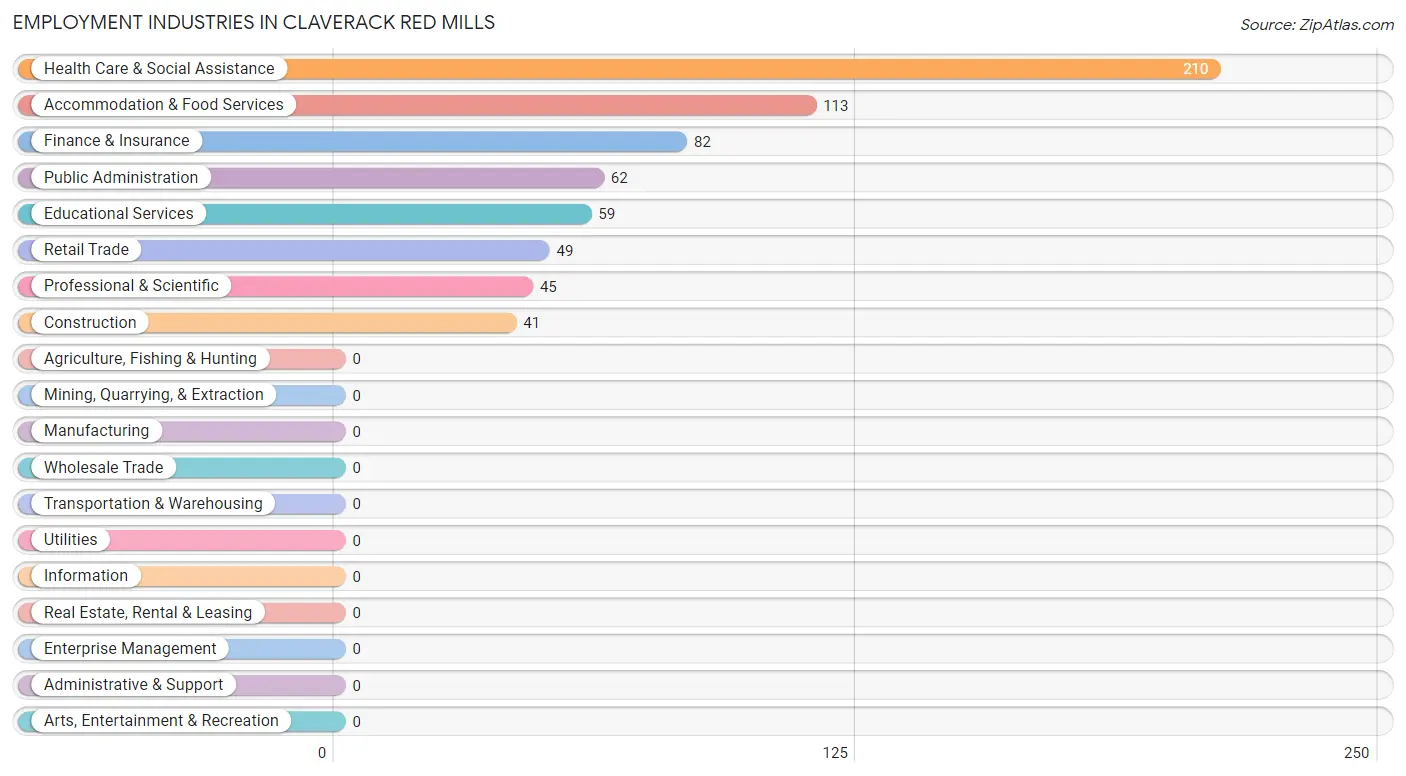
Employment Industries by Sex in Claverack Red Mills
The Claverack Red Mills industries that see more men than women are Construction (100.0%), Retail Trade (100.0%), and Educational Services (83.1%), whereas the industries that tend to have a higher number of women are Public Administration (100.0%), Accommodation & Food Services (77.0%), and Health Care & Social Assistance (69.5%).
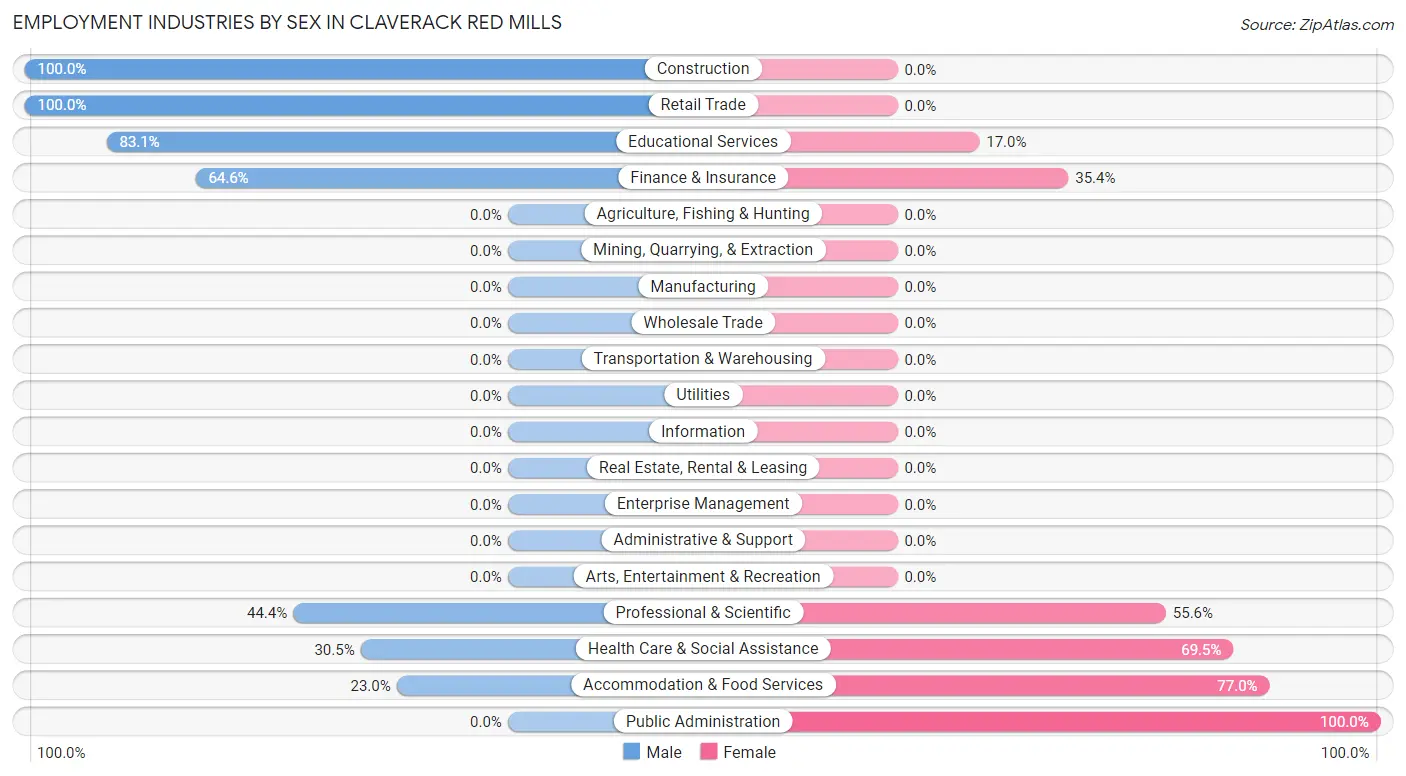
| Industry | Male | Female |
| Agriculture, Fishing & Hunting | 0 (0.0%) | 0 (0.0%) |
| Mining, Quarrying, & Extraction | 0 (0.0%) | 0 (0.0%) |
| Construction | 41 (100.0%) | 0 (0.0%) |
| Manufacturing | 0 (0.0%) | 0 (0.0%) |
| Wholesale Trade | 0 (0.0%) | 0 (0.0%) |
| Retail Trade | 49 (100.0%) | 0 (0.0%) |
| Transportation & Warehousing | 0 (0.0%) | 0 (0.0%) |
| Utilities | 0 (0.0%) | 0 (0.0%) |
| Information | 0 (0.0%) | 0 (0.0%) |
| Finance & Insurance | 53 (64.6%) | 29 (35.4%) |
| Real Estate, Rental & Leasing | 0 (0.0%) | 0 (0.0%) |
| Professional & Scientific | 20 (44.4%) | 25 (55.6%) |
| Enterprise Management | 0 (0.0%) | 0 (0.0%) |
| Administrative & Support | 0 (0.0%) | 0 (0.0%) |
| Educational Services | 49 (83.1%) | 10 (17.0%) |
| Health Care & Social Assistance | 64 (30.5%) | 146 (69.5%) |
| Arts, Entertainment & Recreation | 0 (0.0%) | 0 (0.0%) |
| Accommodation & Food Services | 26 (23.0%) | 87 (77.0%) |
| Public Administration | 0 (0.0%) | 62 (100.0%) |
| Total | 302 (45.7%) | 359 (54.3%) |
Education in Claverack Red Mills
School Enrollment in Claverack Red Mills
The most common levels of schooling among the 175 students in Claverack Red Mills are college / undergraduate (87 | 49.7%), middle school (71 | 40.6%), and high school (17 | 9.7%).
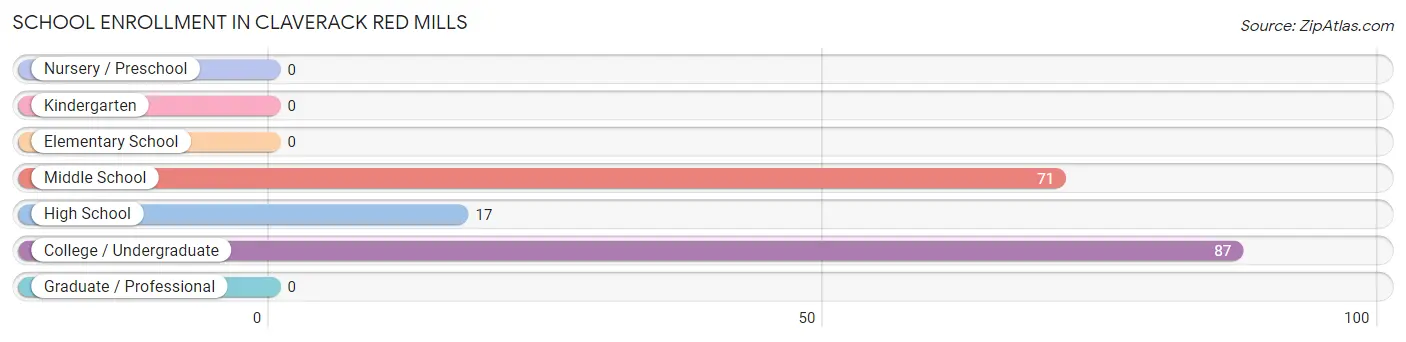
| School Level | # Students | % Students |
| Nursery / Preschool | 0 | 0.0% |
| Kindergarten | 0 | 0.0% |
| Elementary School | 0 | 0.0% |
| Middle School | 71 | 40.6% |
| High School | 17 | 9.7% |
| College / Undergraduate | 87 | 49.7% |
| Graduate / Professional | 0 | 0.0% |
| Total | 175 | 100.0% |
School Enrollment by Age by Funding Source in Claverack Red Mills
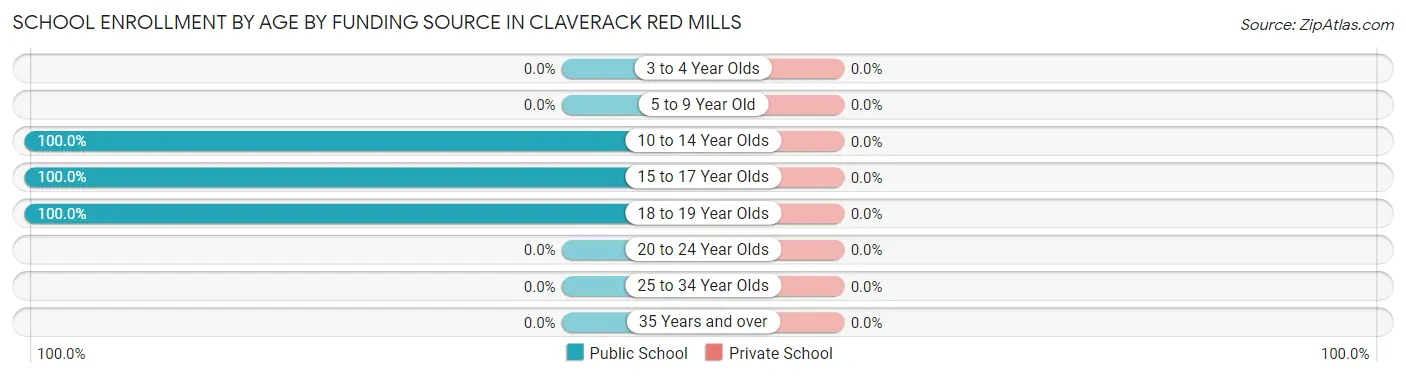
| Age Bracket | Public School | Private School |
| 3 to 4 Year Olds | 0 (0.0%) | 0 (0.0%) |
| 5 to 9 Year Old | 0 (0.0%) | 0 (0.0%) |
| 10 to 14 Year Olds | 71 (100.0%) | 0 (0.0%) |
| 15 to 17 Year Olds | 17 (100.0%) | 0 (0.0%) |
| 18 to 19 Year Olds | 87 (100.0%) | 0 (0.0%) |
| 20 to 24 Year Olds | 0 (0.0%) | 0 (0.0%) |
| 25 to 34 Year Olds | 0 (0.0%) | 0 (0.0%) |
| 35 Years and over | 0 (0.0%) | 0 (0.0%) |
| Total | 175 (100.0%) | 0 (0.0%) |
Educational Attainment by Field of Study in Claverack Red Mills
Business (107 | 21.1%), education (93 | 18.3%), arts & humanities (74 | 14.6%), communications (72 | 14.2%), and social sciences (48 | 9.5%) are the most common fields of study among 508 individuals in Claverack Red Mills who have obtained a bachelor's degree or higher.
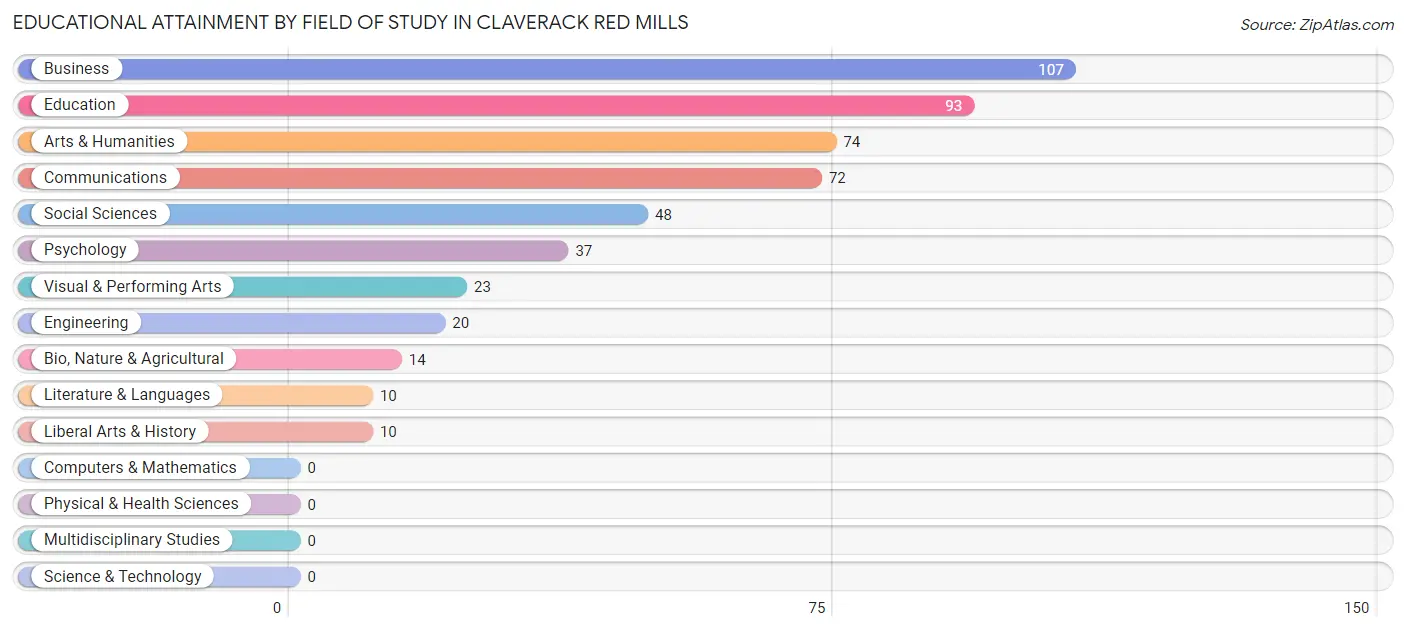
| Field of Study | # Graduates | % Graduates |
| Computers & Mathematics | 0 | 0.0% |
| Bio, Nature & Agricultural | 14 | 2.8% |
| Physical & Health Sciences | 0 | 0.0% |
| Psychology | 37 | 7.3% |
| Social Sciences | 48 | 9.5% |
| Engineering | 20 | 3.9% |
| Multidisciplinary Studies | 0 | 0.0% |
| Science & Technology | 0 | 0.0% |
| Business | 107 | 21.1% |
| Education | 93 | 18.3% |
| Literature & Languages | 10 | 2.0% |
| Liberal Arts & History | 10 | 2.0% |
| Visual & Performing Arts | 23 | 4.5% |
| Communications | 72 | 14.2% |
| Arts & Humanities | 74 | 14.6% |
| Total | 508 | 100.0% |
Transportation & Commute in Claverack Red Mills
Vehicle Availability by Sex in Claverack Red Mills
The most prevalent vehicle ownership categories in Claverack Red Mills are males with 3 vehicles (183, accounting for 60.6%) and females with 3 vehicles (189, making up 51.0%).
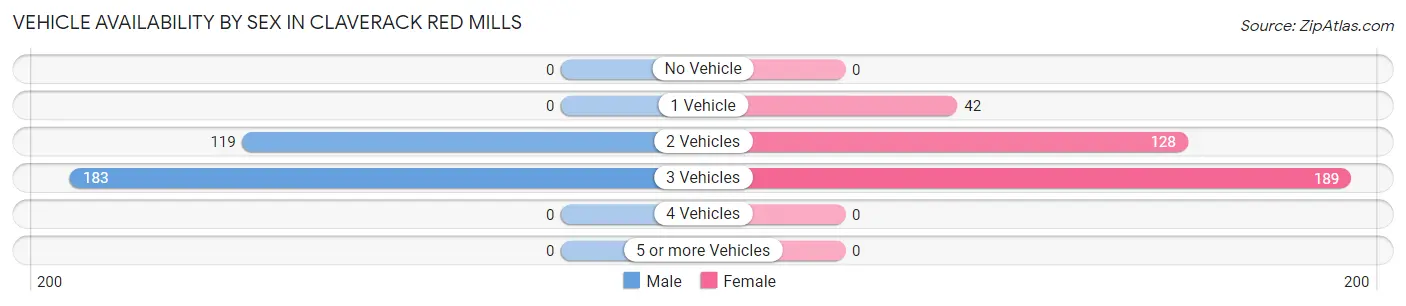
| Vehicles Available | Male | Female |
| No Vehicle | 0 (0.0%) | 0 (0.0%) |
| 1 Vehicle | 0 (0.0%) | 42 (11.7%) |
| 2 Vehicles | 119 (39.4%) | 128 (35.6%) |
| 3 Vehicles | 183 (60.6%) | 189 (52.6%) |
| 4 Vehicles | 0 (0.0%) | 0 (0.0%) |
| 5 or more Vehicles | 0 (0.0%) | 0 (0.0%) |
| Total | 302 (100.0%) | 359 (100.0%) |
Commute Time in Claverack Red Mills
The most frequently occuring commute durations in Claverack Red Mills are 5 to 9 minutes (217 commuters, 35.4%), 10 to 14 minutes (184 commuters, 30.0%), and 20 to 24 minutes (121 commuters, 19.7%).
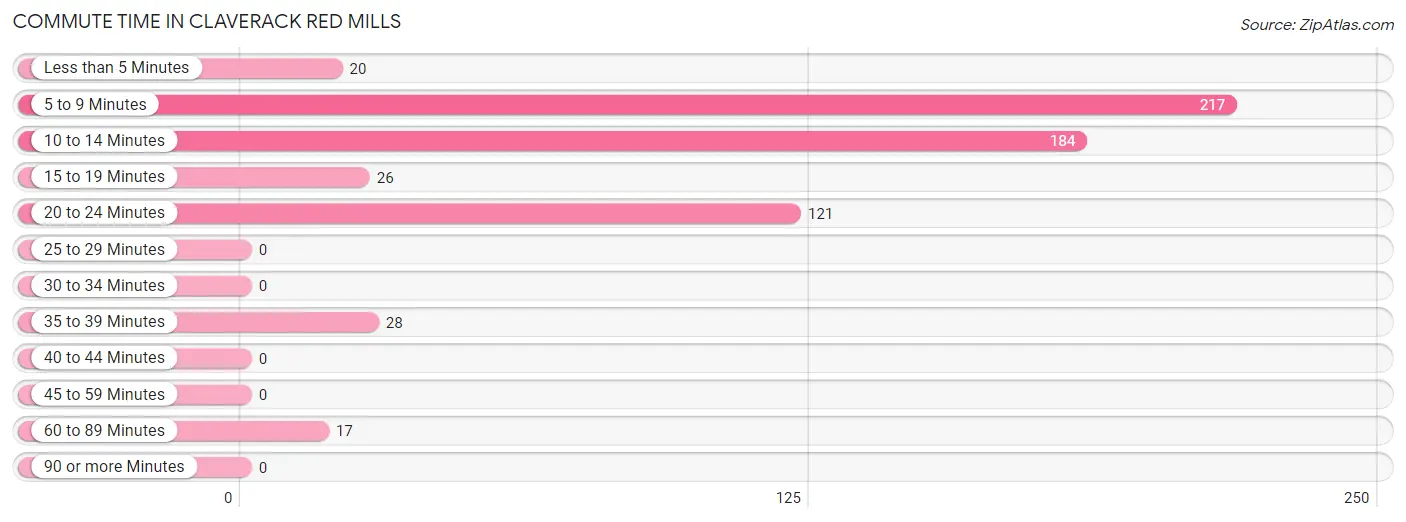
| Commute Time | # Commuters | % Commuters |
| Less than 5 Minutes | 20 | 3.3% |
| 5 to 9 Minutes | 217 | 35.4% |
| 10 to 14 Minutes | 184 | 30.0% |
| 15 to 19 Minutes | 26 | 4.2% |
| 20 to 24 Minutes | 121 | 19.7% |
| 25 to 29 Minutes | 0 | 0.0% |
| 30 to 34 Minutes | 0 | 0.0% |
| 35 to 39 Minutes | 28 | 4.6% |
| 40 to 44 Minutes | 0 | 0.0% |
| 45 to 59 Minutes | 0 | 0.0% |
| 60 to 89 Minutes | 17 | 2.8% |
| 90 or more Minutes | 0 | 0.0% |
Commute Time by Sex in Claverack Red Mills
The most common commute times in Claverack Red Mills are 5 to 9 minutes (158 commuters, 52.3%) for males and 20 to 24 minutes (111 commuters, 35.7%) for females.
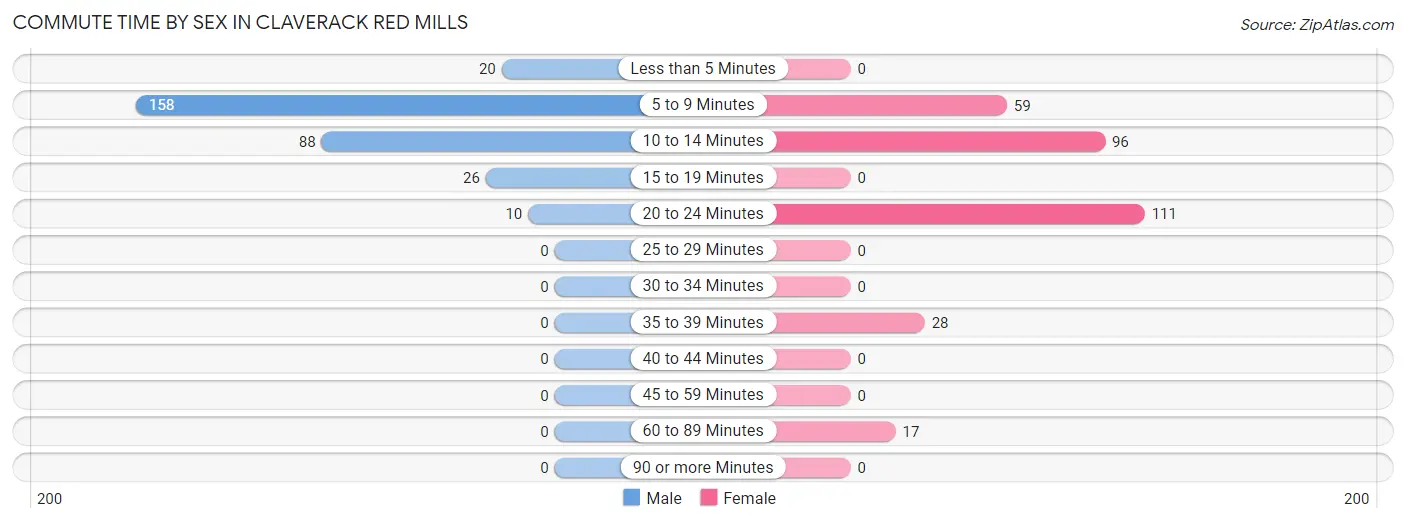
| Commute Time | Male | Female |
| Less than 5 Minutes | 20 (6.6%) | 0 (0.0%) |
| 5 to 9 Minutes | 158 (52.3%) | 59 (19.0%) |
| 10 to 14 Minutes | 88 (29.1%) | 96 (30.9%) |
| 15 to 19 Minutes | 26 (8.6%) | 0 (0.0%) |
| 20 to 24 Minutes | 10 (3.3%) | 111 (35.7%) |
| 25 to 29 Minutes | 0 (0.0%) | 0 (0.0%) |
| 30 to 34 Minutes | 0 (0.0%) | 0 (0.0%) |
| 35 to 39 Minutes | 0 (0.0%) | 28 (9.0%) |
| 40 to 44 Minutes | 0 (0.0%) | 0 (0.0%) |
| 45 to 59 Minutes | 0 (0.0%) | 0 (0.0%) |
| 60 to 89 Minutes | 0 (0.0%) | 17 (5.5%) |
| 90 or more Minutes | 0 (0.0%) | 0 (0.0%) |
Time of Departure to Work by Sex in Claverack Red Mills
The most frequent times of departure to work in Claverack Red Mills are 6:00 AM to 6:29 AM (157, 52.0%) for males and 7:00 AM to 7:29 AM (182, 58.5%) for females.
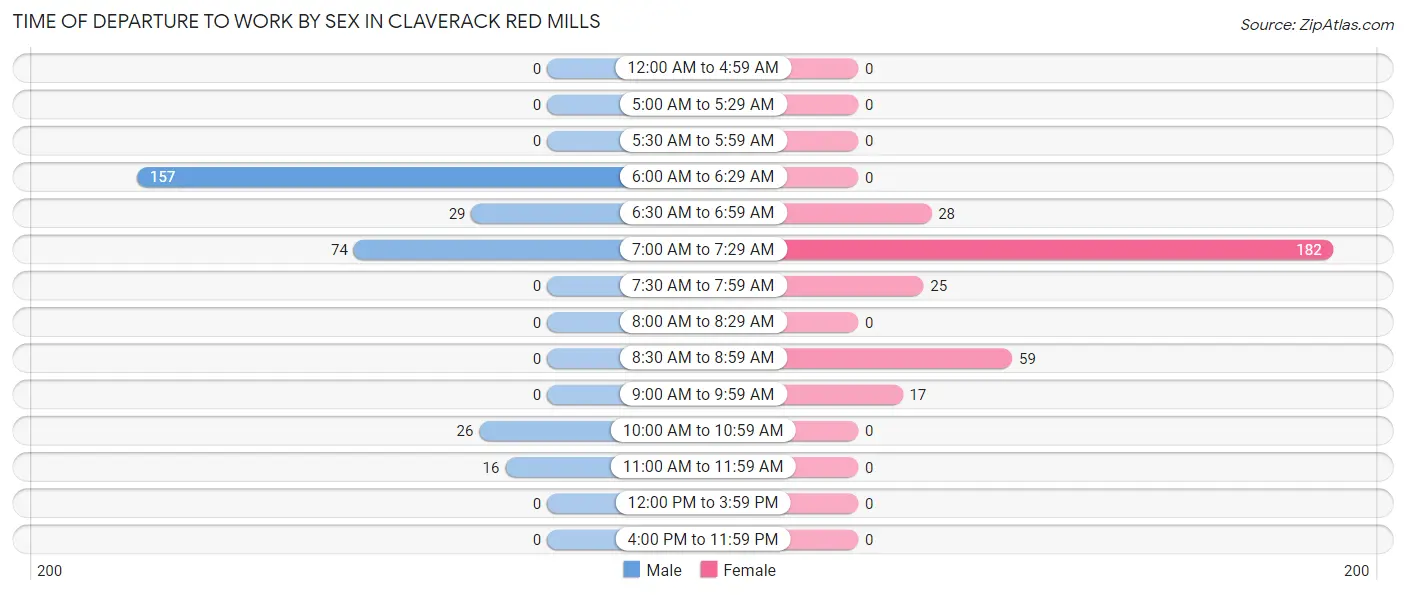
| Time of Departure | Male | Female |
| 12:00 AM to 4:59 AM | 0 (0.0%) | 0 (0.0%) |
| 5:00 AM to 5:29 AM | 0 (0.0%) | 0 (0.0%) |
| 5:30 AM to 5:59 AM | 0 (0.0%) | 0 (0.0%) |
| 6:00 AM to 6:29 AM | 157 (52.0%) | 0 (0.0%) |
| 6:30 AM to 6:59 AM | 29 (9.6%) | 28 (9.0%) |
| 7:00 AM to 7:29 AM | 74 (24.5%) | 182 (58.5%) |
| 7:30 AM to 7:59 AM | 0 (0.0%) | 25 (8.0%) |
| 8:00 AM to 8:29 AM | 0 (0.0%) | 0 (0.0%) |
| 8:30 AM to 8:59 AM | 0 (0.0%) | 59 (19.0%) |
| 9:00 AM to 9:59 AM | 0 (0.0%) | 17 (5.5%) |
| 10:00 AM to 10:59 AM | 26 (8.6%) | 0 (0.0%) |
| 11:00 AM to 11:59 AM | 16 (5.3%) | 0 (0.0%) |
| 12:00 PM to 3:59 PM | 0 (0.0%) | 0 (0.0%) |
| 4:00 PM to 11:59 PM | 0 (0.0%) | 0 (0.0%) |
| Total | 302 (100.0%) | 311 (100.0%) |
Housing Occupancy in Claverack Red Mills
Occupancy by Ownership in Claverack Red Mills
Of the total 420 dwellings in Claverack Red Mills, owner-occupied units account for 389 (92.6%), while renter-occupied units make up 31 (7.4%).
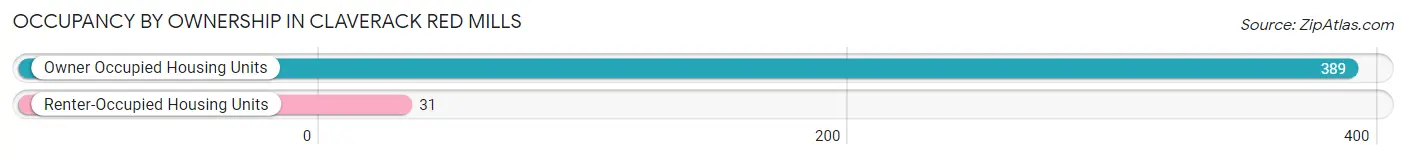
| Occupancy | # Housing Units | % Housing Units |
| Owner Occupied Housing Units | 389 | 92.6% |
| Renter-Occupied Housing Units | 31 | 7.4% |
| Total Occupied Housing Units | 420 | 100.0% |
Occupancy by Household Size in Claverack Red Mills
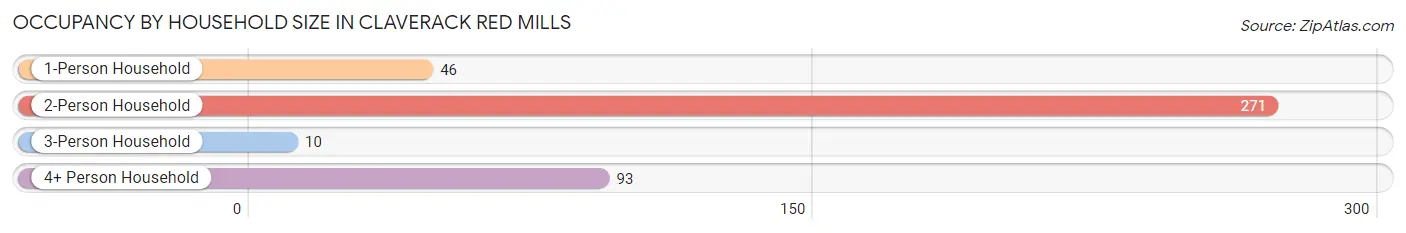
| Household Size | # Housing Units | % Housing Units |
| 1-Person Household | 46 | 11.0% |
| 2-Person Household | 271 | 64.5% |
| 3-Person Household | 10 | 2.4% |
| 4+ Person Household | 93 | 22.1% |
| Total Housing Units | 420 | 100.0% |
Occupancy by Ownership by Household Size in Claverack Red Mills
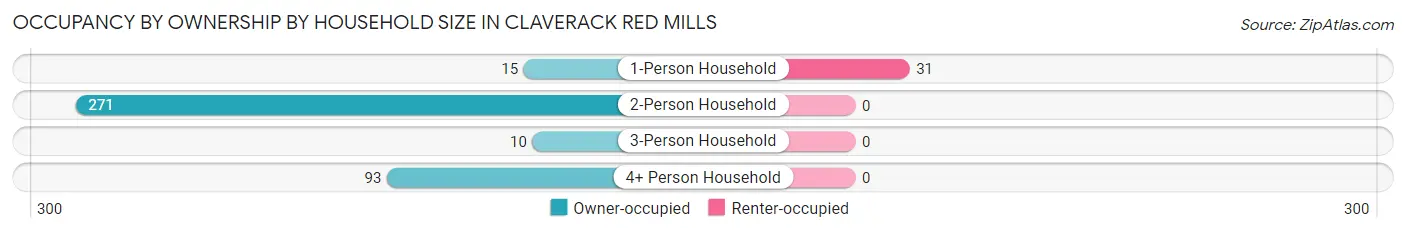
| Household Size | Owner-occupied | Renter-occupied |
| 1-Person Household | 15 (32.6%) | 31 (67.4%) |
| 2-Person Household | 271 (100.0%) | 0 (0.0%) |
| 3-Person Household | 10 (100.0%) | 0 (0.0%) |
| 4+ Person Household | 93 (100.0%) | 0 (0.0%) |
| Total Housing Units | 389 (92.6%) | 31 (7.4%) |
Occupancy by Educational Attainment in Claverack Red Mills
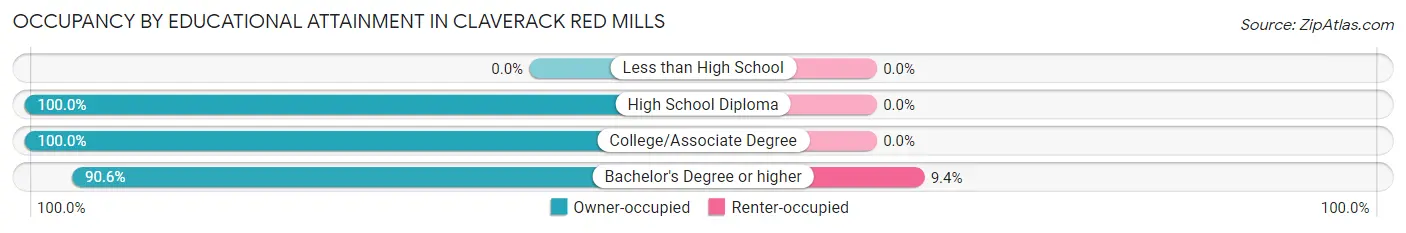
| Household Size | Owner-occupied | Renter-occupied |
| Less than High School | 0 (0.0%) | 0 (0.0%) |
| High School Diploma | 58 (100.0%) | 0 (0.0%) |
| College/Associate Degree | 33 (100.0%) | 0 (0.0%) |
| Bachelor's Degree or higher | 298 (90.6%) | 31 (9.4%) |
Occupancy by Age of Householder in Claverack Red Mills
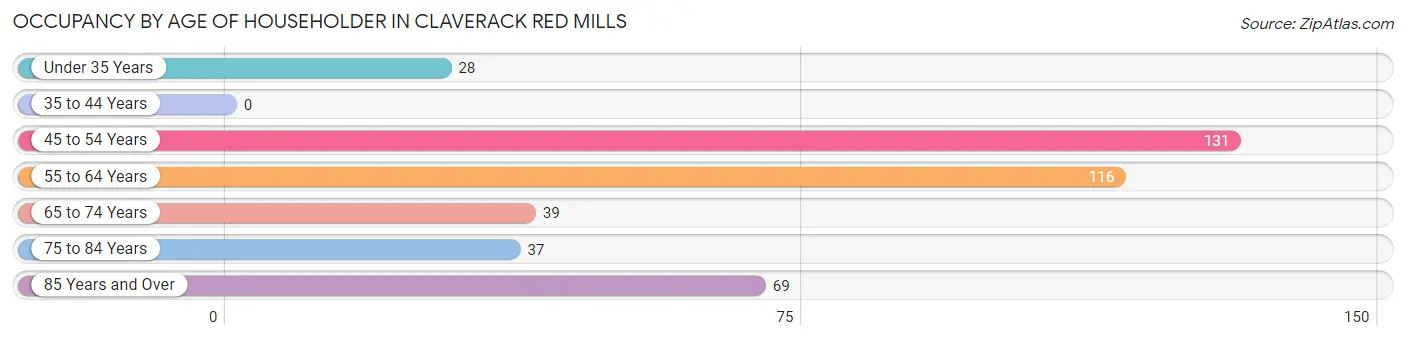
| Age Bracket | # Households | % Households |
| Under 35 Years | 28 | 6.7% |
| 35 to 44 Years | 0 | 0.0% |
| 45 to 54 Years | 131 | 31.2% |
| 55 to 64 Years | 116 | 27.6% |
| 65 to 74 Years | 39 | 9.3% |
| 75 to 84 Years | 37 | 8.8% |
| 85 Years and Over | 69 | 16.4% |
| Total | 420 | 100.0% |
Housing Finances in Claverack Red Mills
Median Income by Occupancy in Claverack Red Mills
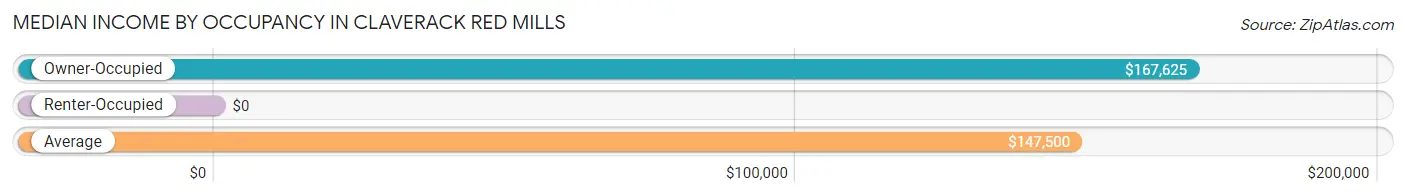
| Occupancy Type | # Households | Median Income |
| Owner-Occupied | 389 (92.6%) | $167,625 |
| Renter-Occupied | 31 (7.4%) | $0 |
| Average | 420 (100.0%) | $147,500 |
Occupancy by Householder Income Bracket in Claverack Red Mills
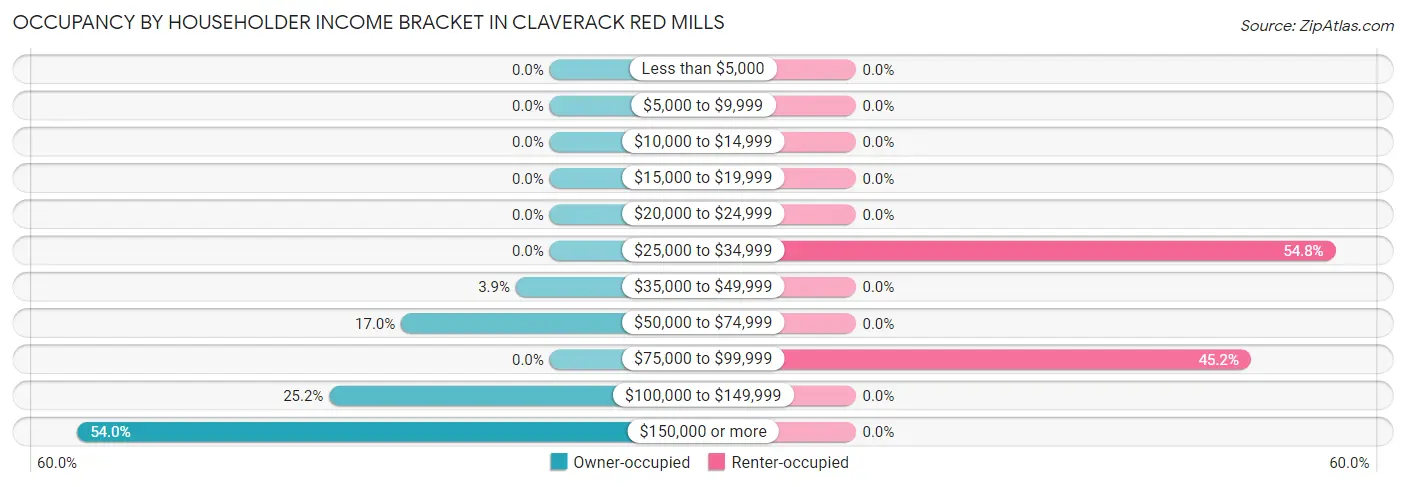
| Income Bracket | Owner-occupied | Renter-occupied |
| Less than $5,000 | 0 (0.0%) | 0 (0.0%) |
| $5,000 to $9,999 | 0 (0.0%) | 0 (0.0%) |
| $10,000 to $14,999 | 0 (0.0%) | 0 (0.0%) |
| $15,000 to $19,999 | 0 (0.0%) | 0 (0.0%) |
| $20,000 to $24,999 | 0 (0.0%) | 0 (0.0%) |
| $25,000 to $34,999 | 0 (0.0%) | 17 (54.8%) |
| $35,000 to $49,999 | 15 (3.9%) | 0 (0.0%) |
| $50,000 to $74,999 | 66 (17.0%) | 0 (0.0%) |
| $75,000 to $99,999 | 0 (0.0%) | 14 (45.2%) |
| $100,000 to $149,999 | 98 (25.2%) | 0 (0.0%) |
| $150,000 or more | 210 (54.0%) | 0 (0.0%) |
| Total | 389 (100.0%) | 31 (100.0%) |
Monthly Housing Cost Tiers in Claverack Red Mills
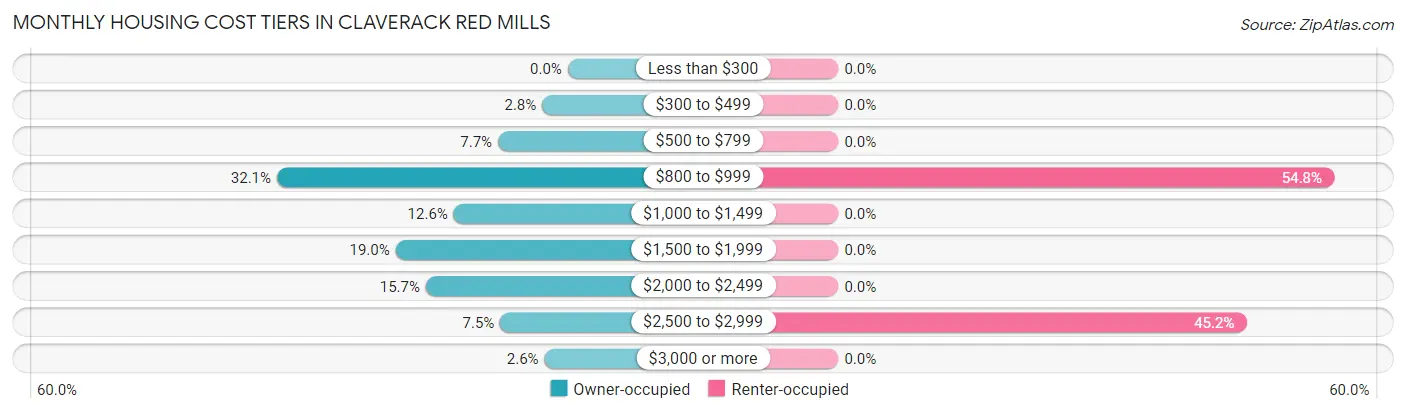
| Monthly Cost | Owner-occupied | Renter-occupied |
| Less than $300 | 0 (0.0%) | 0 (0.0%) |
| $300 to $499 | 11 (2.8%) | 0 (0.0%) |
| $500 to $799 | 30 (7.7%) | 0 (0.0%) |
| $800 to $999 | 125 (32.1%) | 17 (54.8%) |
| $1,000 to $1,499 | 49 (12.6%) | 0 (0.0%) |
| $1,500 to $1,999 | 74 (19.0%) | 0 (0.0%) |
| $2,000 to $2,499 | 61 (15.7%) | 0 (0.0%) |
| $2,500 to $2,999 | 29 (7.5%) | 14 (45.2%) |
| $3,000 or more | 10 (2.6%) | 0 (0.0%) |
| Total | 389 (100.0%) | 31 (100.0%) |
Physical Housing Characteristics in Claverack Red Mills
Housing Structures in Claverack Red Mills
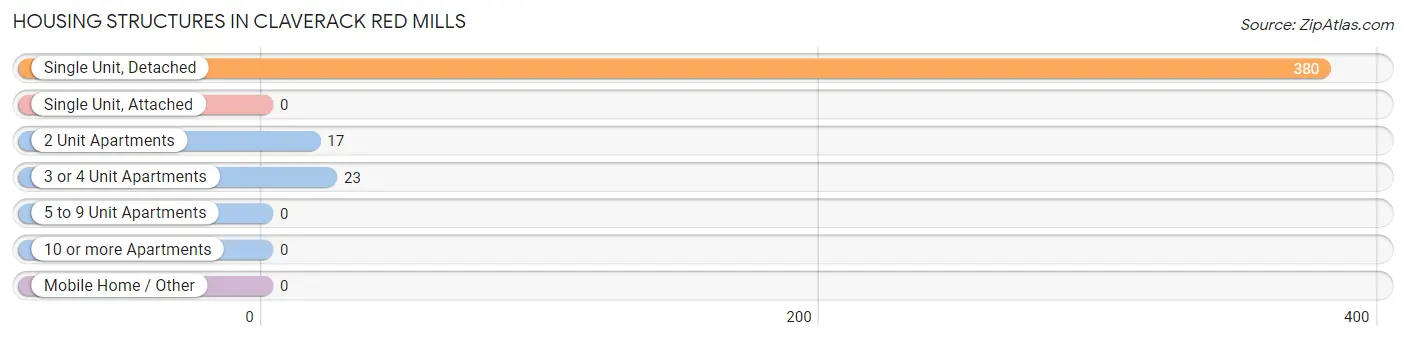
| Structure Type | # Housing Units | % Housing Units |
| Single Unit, Detached | 380 | 90.5% |
| Single Unit, Attached | 0 | 0.0% |
| 2 Unit Apartments | 17 | 4.1% |
| 3 or 4 Unit Apartments | 23 | 5.5% |
| 5 to 9 Unit Apartments | 0 | 0.0% |
| 10 or more Apartments | 0 | 0.0% |
| Mobile Home / Other | 0 | 0.0% |
| Total | 420 | 100.0% |
Housing Structures by Occupancy in Claverack Red Mills
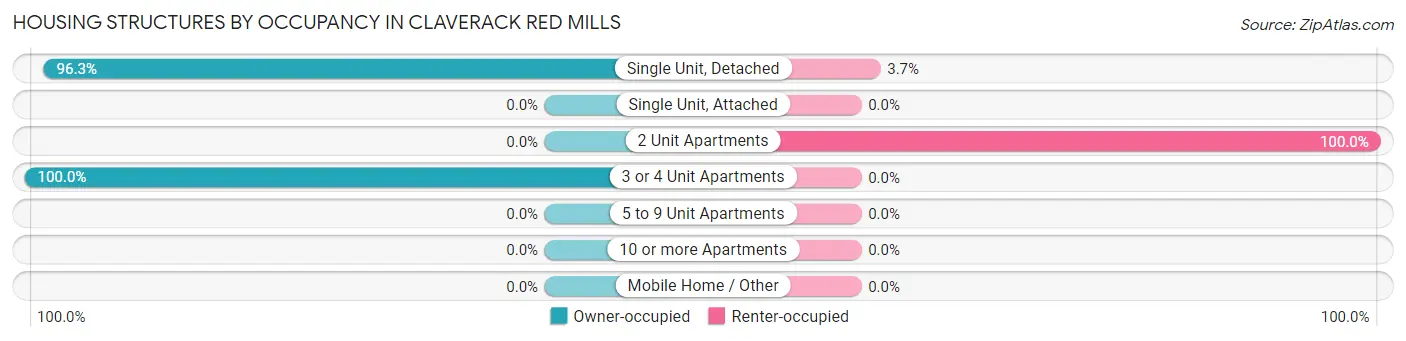
| Structure Type | Owner-occupied | Renter-occupied |
| Single Unit, Detached | 366 (96.3%) | 14 (3.7%) |
| Single Unit, Attached | 0 (0.0%) | 0 (0.0%) |
| 2 Unit Apartments | 0 (0.0%) | 17 (100.0%) |
| 3 or 4 Unit Apartments | 23 (100.0%) | 0 (0.0%) |
| 5 to 9 Unit Apartments | 0 (0.0%) | 0 (0.0%) |
| 10 or more Apartments | 0 (0.0%) | 0 (0.0%) |
| Mobile Home / Other | 0 (0.0%) | 0 (0.0%) |
| Total | 389 (92.6%) | 31 (7.4%) |
Housing Structures by Number of Rooms in Claverack Red Mills
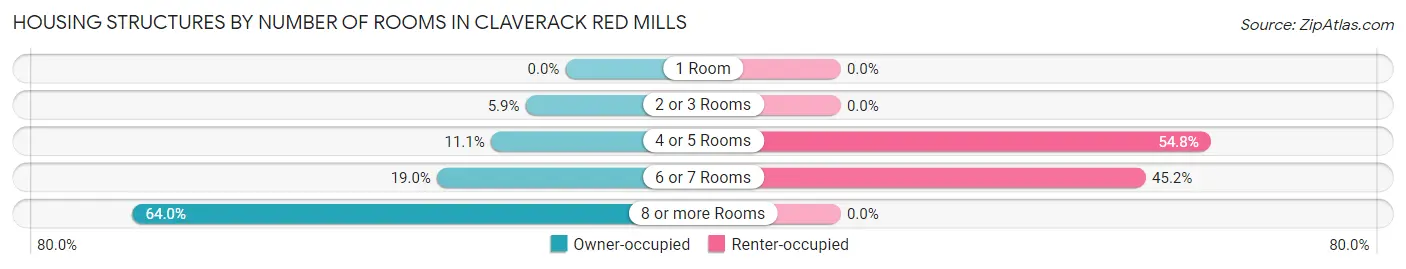
| Number of Rooms | Owner-occupied | Renter-occupied |
| 1 Room | 0 (0.0%) | 0 (0.0%) |
| 2 or 3 Rooms | 23 (5.9%) | 0 (0.0%) |
| 4 or 5 Rooms | 43 (11.1%) | 17 (54.8%) |
| 6 or 7 Rooms | 74 (19.0%) | 14 (45.2%) |
| 8 or more Rooms | 249 (64.0%) | 0 (0.0%) |
| Total | 389 (100.0%) | 31 (100.0%) |
Housing Structure by Heating Type in Claverack Red Mills
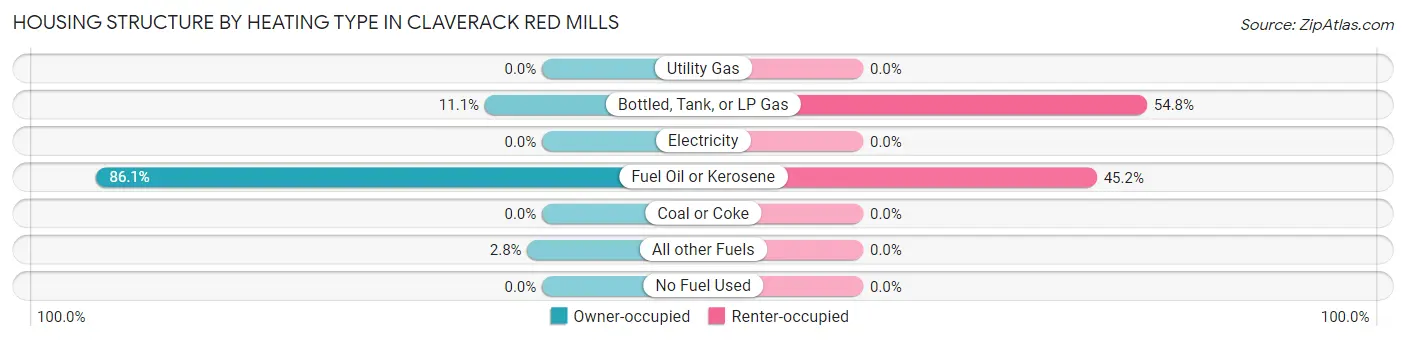
| Heating Type | Owner-occupied | Renter-occupied |
| Utility Gas | 0 (0.0%) | 0 (0.0%) |
| Bottled, Tank, or LP Gas | 43 (11.1%) | 17 (54.8%) |
| Electricity | 0 (0.0%) | 0 (0.0%) |
| Fuel Oil or Kerosene | 335 (86.1%) | 14 (45.2%) |
| Coal or Coke | 0 (0.0%) | 0 (0.0%) |
| All other Fuels | 11 (2.8%) | 0 (0.0%) |
| No Fuel Used | 0 (0.0%) | 0 (0.0%) |
| Total | 389 (100.0%) | 31 (100.0%) |
Household Vehicle Usage in Claverack Red Mills
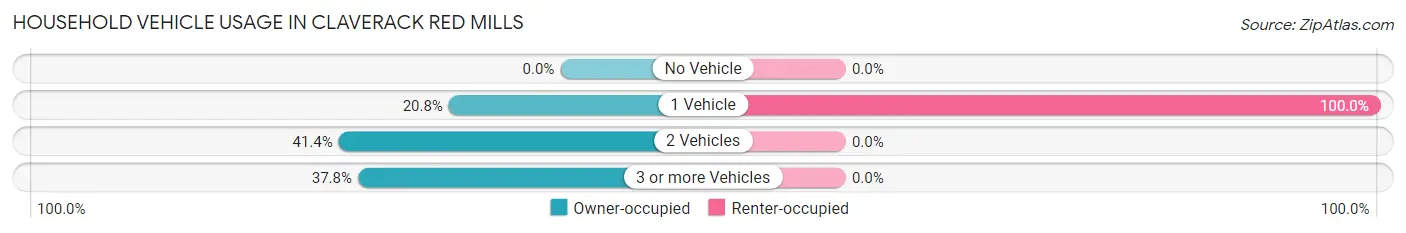
| Vehicles per Household | Owner-occupied | Renter-occupied |
| No Vehicle | 0 (0.0%) | 0 (0.0%) |
| 1 Vehicle | 81 (20.8%) | 31 (100.0%) |
| 2 Vehicles | 161 (41.4%) | 0 (0.0%) |
| 3 or more Vehicles | 147 (37.8%) | 0 (0.0%) |
| Total | 389 (100.0%) | 31 (100.0%) |
Real Estate & Mortgages in Claverack Red Mills
Real Estate and Mortgage Overview in Claverack Red Mills
| Characteristic | Without Mortgage | With Mortgage |
| Housing Units | 166 | 223 |
| Median Property Value | $232,300 | $237,500 |
| Median Household Income | - | - |
| Monthly Housing Costs | $840 | $10 |
| Real Estate Taxes | - | - |
Property Value by Mortgage Status in Claverack Red Mills
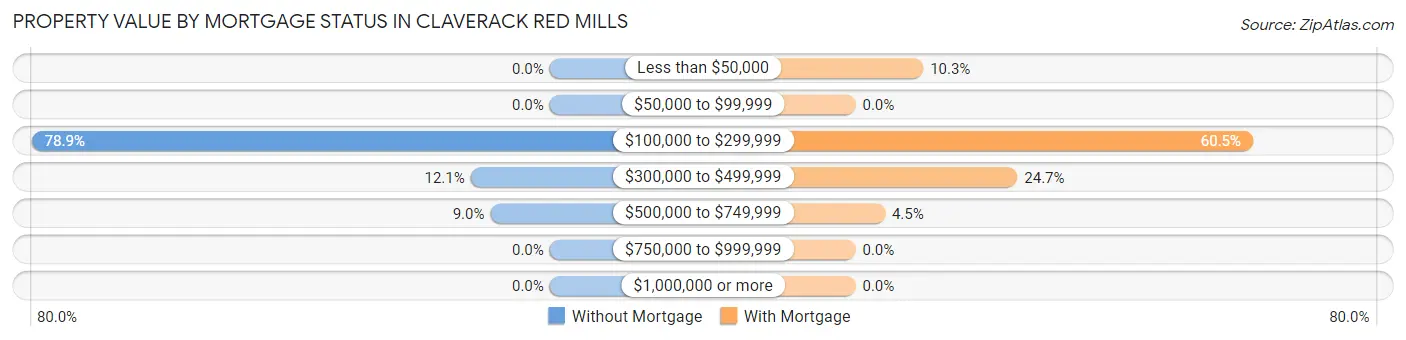
| Property Value | Without Mortgage | With Mortgage |
| Less than $50,000 | 0 (0.0%) | 23 (10.3%) |
| $50,000 to $99,999 | 0 (0.0%) | 0 (0.0%) |
| $100,000 to $299,999 | 131 (78.9%) | 135 (60.5%) |
| $300,000 to $499,999 | 20 (12.0%) | 55 (24.7%) |
| $500,000 to $749,999 | 15 (9.0%) | 10 (4.5%) |
| $750,000 to $999,999 | 0 (0.0%) | 0 (0.0%) |
| $1,000,000 or more | 0 (0.0%) | 0 (0.0%) |
| Total | 166 (100.0%) | 223 (100.0%) |
Household Income by Mortgage Status in Claverack Red Mills
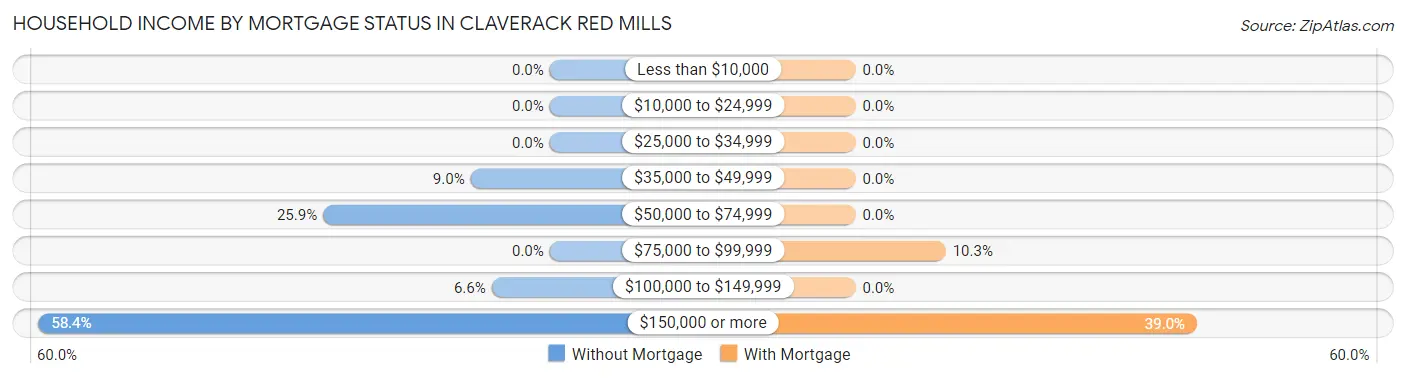
| Household Income | Without Mortgage | With Mortgage |
| Less than $10,000 | 0 (0.0%) | 0 (0.0%) |
| $10,000 to $24,999 | 0 (0.0%) | 0 (0.0%) |
| $25,000 to $34,999 | 0 (0.0%) | 0 (0.0%) |
| $35,000 to $49,999 | 15 (9.0%) | 0 (0.0%) |
| $50,000 to $74,999 | 43 (25.9%) | 0 (0.0%) |
| $75,000 to $99,999 | 0 (0.0%) | 23 (10.3%) |
| $100,000 to $149,999 | 11 (6.6%) | 0 (0.0%) |
| $150,000 or more | 97 (58.4%) | 87 (39.0%) |
| Total | 166 (100.0%) | 223 (100.0%) |
Property Value to Household Income Ratio in Claverack Red Mills
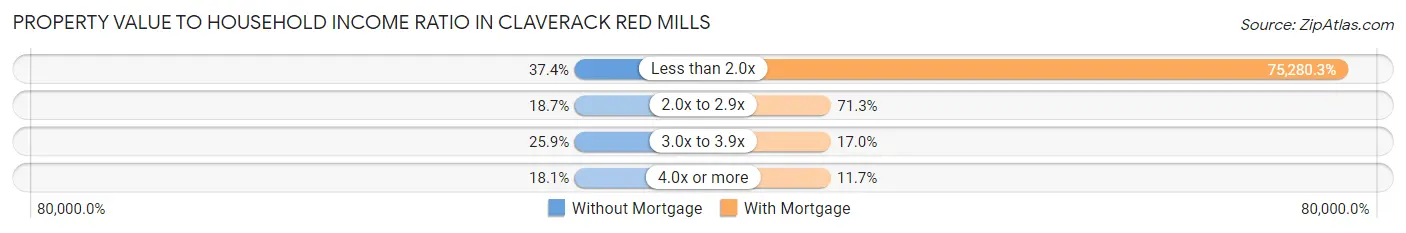
| Value-to-Income Ratio | Without Mortgage | With Mortgage |
| Less than 2.0x | 62 (37.3%) | 167,875 (75,280.3%) |
| 2.0x to 2.9x | 31 (18.7%) | 159 (71.3%) |
| 3.0x to 3.9x | 43 (25.9%) | 38 (17.0%) |
| 4.0x or more | 30 (18.1%) | 26 (11.7%) |
| Total | 166 (100.0%) | 223 (100.0%) |
Real Estate Taxes by Mortgage Status in Claverack Red Mills
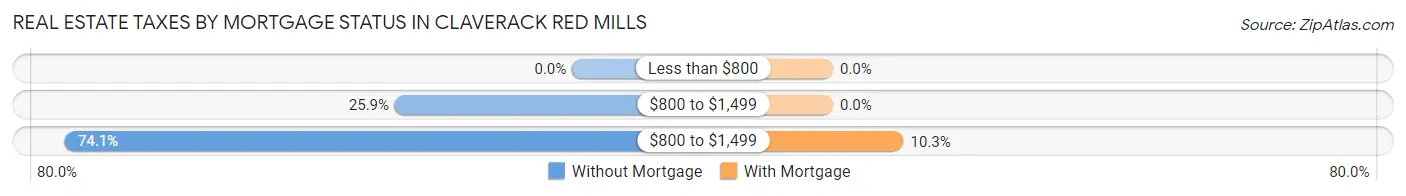
| Property Taxes | Without Mortgage | With Mortgage |
| Less than $800 | 0 (0.0%) | 0 (0.0%) |
| $800 to $1,499 | 43 (25.9%) | 0 (0.0%) |
| $800 to $1,499 | 123 (74.1%) | 23 (10.3%) |
| Total | 166 (100.0%) | 223 (100.0%) |
Health & Disability in Claverack Red Mills
Health Insurance Coverage by Age in Claverack Red Mills
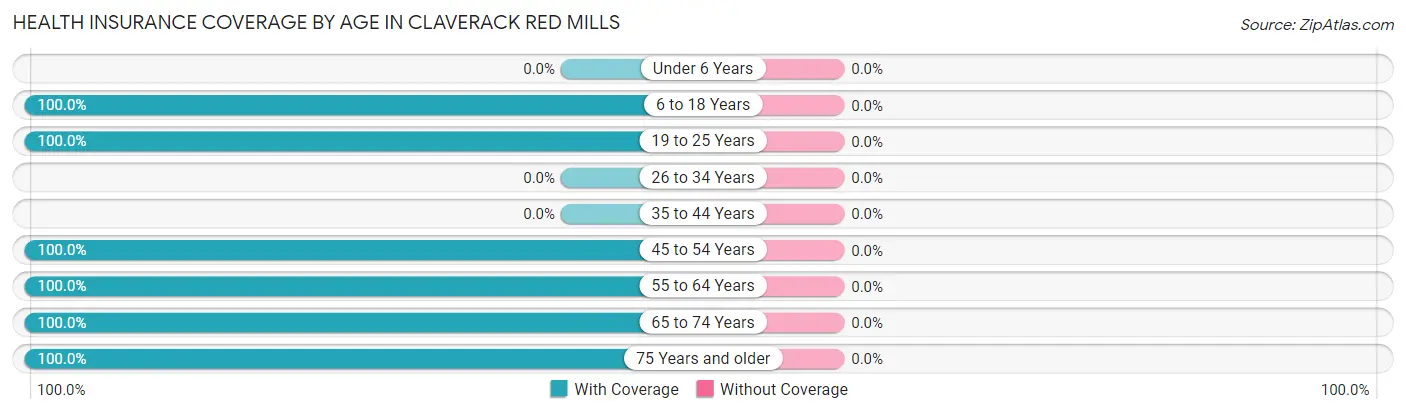
| Age Bracket | With Coverage | Without Coverage |
| Under 6 Years | 0 (0.0%) | 0 (0.0%) |
| 6 to 18 Years | 88 (100.0%) | 0 (0.0%) |
| 19 to 25 Years | 174 (100.0%) | 0 (0.0%) |
| 26 to 34 Years | 0 (0.0%) | 0 (0.0%) |
| 35 to 44 Years | 0 (0.0%) | 0 (0.0%) |
| 45 to 54 Years | 201 (100.0%) | 0 (0.0%) |
| 55 to 64 Years | 299 (100.0%) | 0 (0.0%) |
| 65 to 74 Years | 103 (100.0%) | 0 (0.0%) |
| 75 Years and older | 177 (100.0%) | 0 (0.0%) |
| Total | 1,042 (100.0%) | 0 (0.0%) |
Health Insurance Coverage by Citizenship Status in Claverack Red Mills
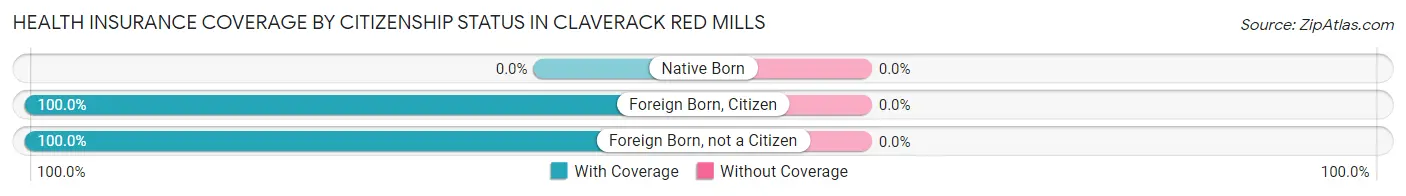
| Citizenship Status | With Coverage | Without Coverage |
| Native Born | 0 (0.0%) | 0 (0.0%) |
| Foreign Born, Citizen | 88 (100.0%) | 0 (0.0%) |
| Foreign Born, not a Citizen | 174 (100.0%) | 0 (0.0%) |
Health Insurance Coverage by Household Income in Claverack Red Mills
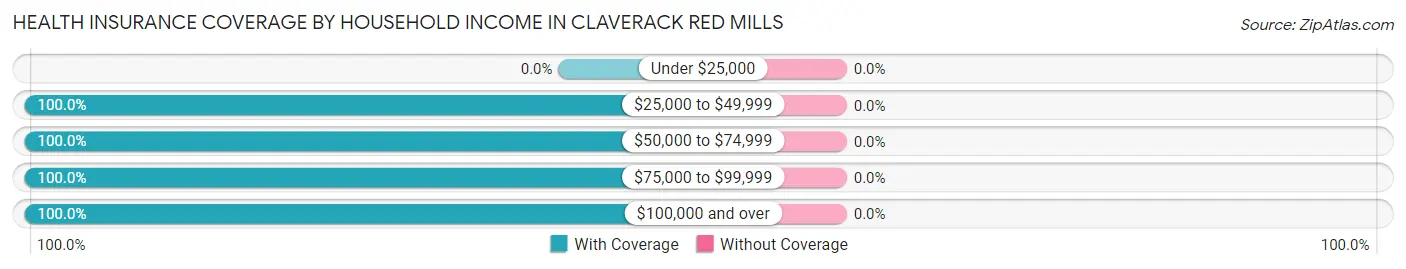
| Household Income | With Coverage | Without Coverage |
| Under $25,000 | 0 (0.0%) | 0 (0.0%) |
| $25,000 to $49,999 | 32 (100.0%) | 0 (0.0%) |
| $50,000 to $74,999 | 137 (100.0%) | 0 (0.0%) |
| $75,000 to $99,999 | 14 (100.0%) | 0 (0.0%) |
| $100,000 and over | 859 (100.0%) | 0 (0.0%) |
Public vs Private Health Insurance Coverage by Age in Claverack Red Mills
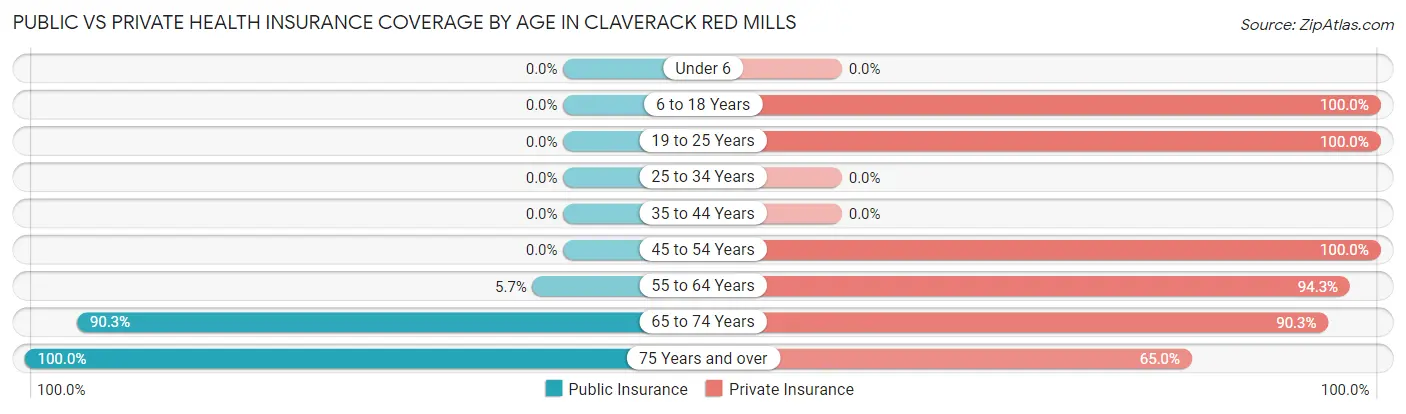
| Age Bracket | Public Insurance | Private Insurance |
| Under 6 | 0 (0.0%) | 0 (0.0%) |
| 6 to 18 Years | 0 (0.0%) | 88 (100.0%) |
| 19 to 25 Years | 0 (0.0%) | 174 (100.0%) |
| 25 to 34 Years | 0 (0.0%) | 0 (0.0%) |
| 35 to 44 Years | 0 (0.0%) | 0 (0.0%) |
| 45 to 54 Years | 0 (0.0%) | 201 (100.0%) |
| 55 to 64 Years | 17 (5.7%) | 282 (94.3%) |
| 65 to 74 Years | 93 (90.3%) | 93 (90.3%) |
| 75 Years and over | 177 (100.0%) | 115 (65.0%) |
| Total | 287 (27.5%) | 953 (91.5%) |
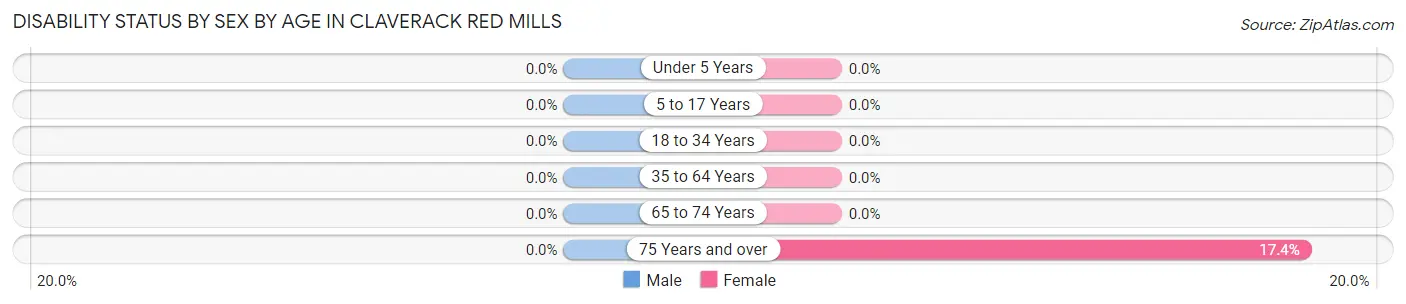
Disability Status by Sex by Age in Claverack Red Mills
| Age Bracket | Male | Female |
| Under 5 Years | 0 (0.0%) | 0 (0.0%) |
| 5 to 17 Years | 0 (0.0%) | 0 (0.0%) |
| 18 to 34 Years | 0 (0.0%) | 0 (0.0%) |
| 35 to 64 Years | 0 (0.0%) | 0 (0.0%) |
| 65 to 74 Years | 0 (0.0%) | 0 (0.0%) |
| 75 Years and over | 0 (0.0%) | 15 (17.4%) |
Disability Class by Sex by Age in Claverack Red Mills
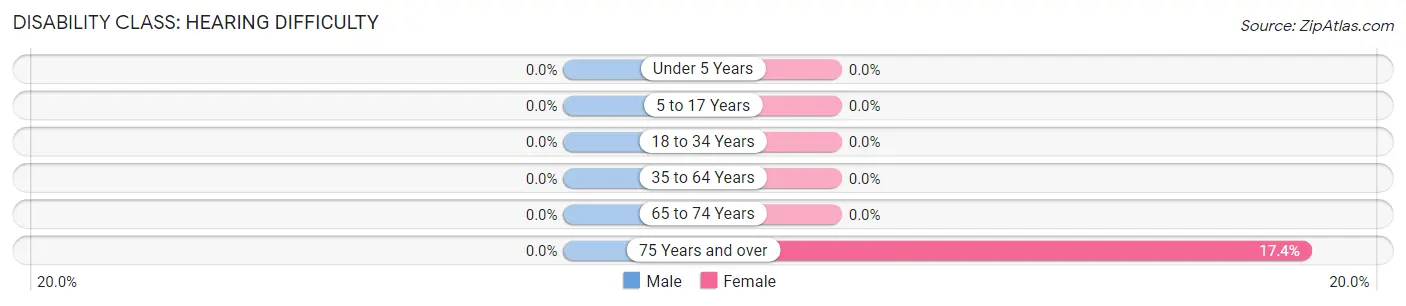
Disability Class: Hearing Difficulty
| Age Bracket | Male | Female |
| Under 5 Years | 0 (0.0%) | 0 (0.0%) |
| 5 to 17 Years | 0 (0.0%) | 0 (0.0%) |
| 18 to 34 Years | 0 (0.0%) | 0 (0.0%) |
| 35 to 64 Years | 0 (0.0%) | 0 (0.0%) |
| 65 to 74 Years | 0 (0.0%) | 0 (0.0%) |
| 75 Years and over | 0 (0.0%) | 15 (17.4%) |
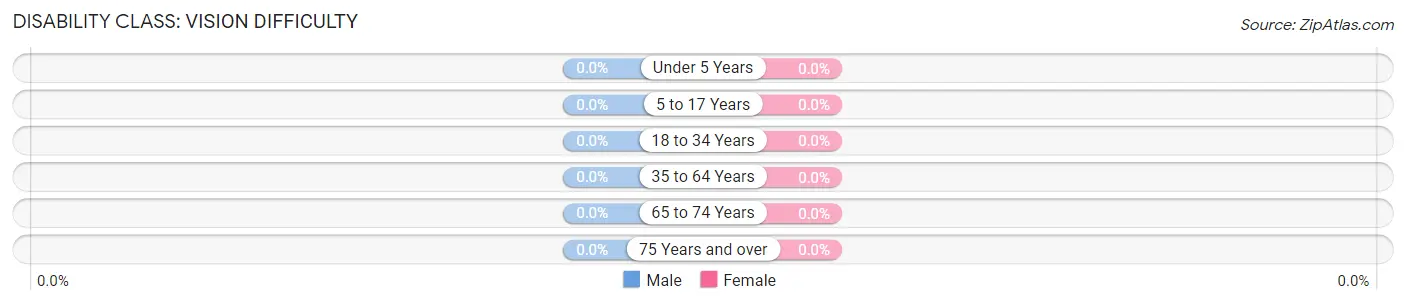
Disability Class: Vision Difficulty
| Age Bracket | Male | Female |
| Under 5 Years | 0 (0.0%) | 0 (0.0%) |
| 5 to 17 Years | 0 (0.0%) | 0 (0.0%) |
| 18 to 34 Years | 0 (0.0%) | 0 (0.0%) |
| 35 to 64 Years | 0 (0.0%) | 0 (0.0%) |
| 65 to 74 Years | 0 (0.0%) | 0 (0.0%) |
| 75 Years and over | 0 (0.0%) | 0 (0.0%) |
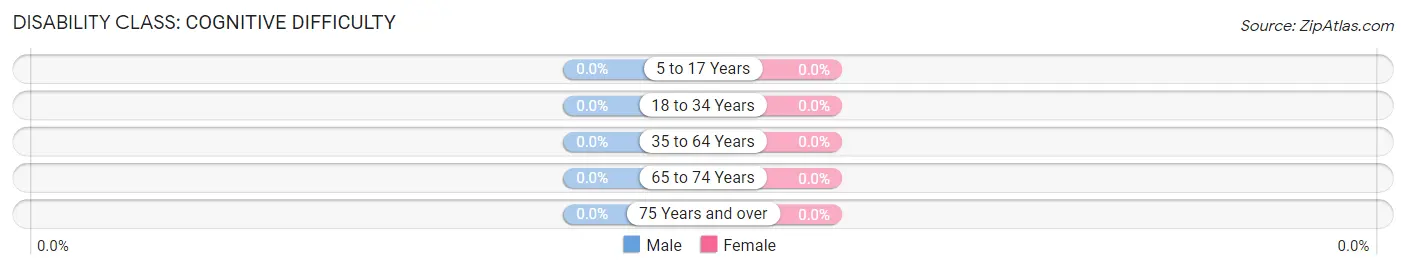
Disability Class: Cognitive Difficulty
| Age Bracket | Male | Female |
| 5 to 17 Years | 0 (0.0%) | 0 (0.0%) |
| 18 to 34 Years | 0 (0.0%) | 0 (0.0%) |
| 35 to 64 Years | 0 (0.0%) | 0 (0.0%) |
| 65 to 74 Years | 0 (0.0%) | 0 (0.0%) |
| 75 Years and over | 0 (0.0%) | 0 (0.0%) |
Disability Class: Ambulatory Difficulty
| Age Bracket | Male | Female |
| 5 to 17 Years | 0 (0.0%) | 0 (0.0%) |
| 18 to 34 Years | 0 (0.0%) | 0 (0.0%) |
| 35 to 64 Years | 0 (0.0%) | 0 (0.0%) |
| 65 to 74 Years | 0 (0.0%) | 0 (0.0%) |
| 75 Years and over | 0 (0.0%) | 0 (0.0%) |
Disability Class: Self-Care Difficulty
| Age Bracket | Male | Female |
| 5 to 17 Years | 0 (0.0%) | 0 (0.0%) |
| 18 to 34 Years | 0 (0.0%) | 0 (0.0%) |
| 35 to 64 Years | 0 (0.0%) | 0 (0.0%) |
| 65 to 74 Years | 0 (0.0%) | 0 (0.0%) |
| 75 Years and over | 0 (0.0%) | 0 (0.0%) |
Technology Access in Claverack Red Mills
Computing Device Access in Claverack Red Mills
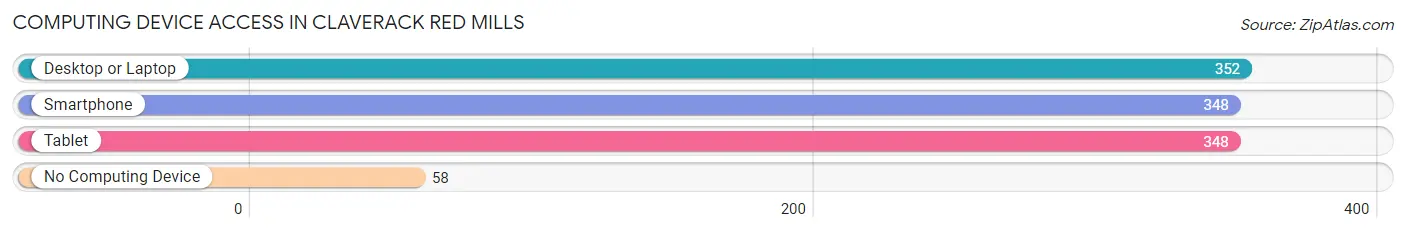
| Device Type | # Households | % Households |
| Desktop or Laptop | 352 | 83.8% |
| Smartphone | 348 | 82.9% |
| Tablet | 348 | 82.9% |
| No Computing Device | 58 | 13.8% |
| Total | 420 | 100.0% |
Internet Access in Claverack Red Mills
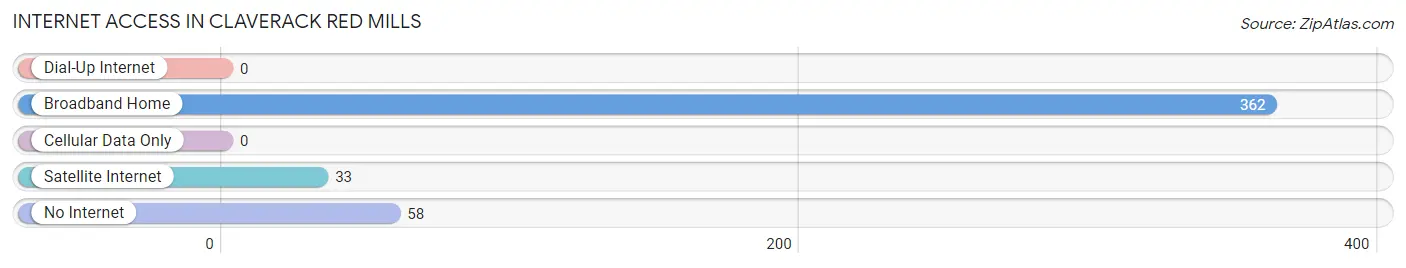
| Internet Type | # Households | % Households |
| Dial-Up Internet | 0 | 0.0% |
| Broadband Home | 362 | 86.2% |
| Cellular Data Only | 0 | 0.0% |
| Satellite Internet | 33 | 7.9% |
| No Internet | 58 | 13.8% |
| Total | 420 | 100.0% |
Claverack Red Mills Summary
Claverack Red Mills is a small hamlet located in Columbia County, New York. It is situated on the east bank of the Hudson River, about two miles south of the city of Hudson. The hamlet is part of the Town of Claverack, and is home to a population of approximately 1,000 people.
History
Claverack Red Mills has a long and storied history. The area was first settled in the late 17th century by Dutch and English settlers. The hamlet was originally known as Claverack Landing, and was a major port for the transportation of goods and people along the Hudson River. In the early 19th century, the hamlet was renamed Claverack Red Mills, after the red-brick grist mill that was built in the area. The mill was owned and operated by the Claverack Manufacturing Company, which was founded in 1820. The company was one of the first to produce cotton cloth in the United States.
The hamlet was also home to a number of other industries, including a paper mill, a sawmill, a tannery, and a blacksmith shop. In the late 19th century, the hamlet was home to a number of wealthy families, who built large homes in the area. The hamlet was also home to a number of churches, including the Dutch Reformed Church, the Methodist Episcopal Church, and the Episcopal Church.
Geography
Claverack Red Mills is located in Columbia County, New York, on the east bank of the Hudson River. The hamlet is situated about two miles south of the city of Hudson. The hamlet is part of the Town of Claverack, and is bordered by the hamlets of Claverack, Mellenville, and Stottville. The hamlet is located in a rural area, and is surrounded by rolling hills and farmland.
Economy
Claverack Red Mills is a small, rural hamlet with a limited economy. The hamlet is home to a number of small businesses, including a grocery store, a hardware store, a gas station, and a few restaurants. The hamlet is also home to a number of small farms, which produce a variety of crops, including corn, soybeans, and hay.
Demographics
As of the 2010 census, the population of Claverack Red Mills was 1,000 people. The population is predominantly white, with a small minority population. The median household income in the hamlet is $45,000, and the median home value is $150,000. The hamlet is served by the Hudson City School District.
Conclusion
Claverack Red Mills is a small hamlet located in Columbia County, New York. It is situated on the east bank of the Hudson River, about two miles south of the city of Hudson. The hamlet has a long and storied history, and was once home to a number of industries, including a paper mill, a sawmill, a tannery, and a blacksmith shop. Today, the hamlet is home to a population of approximately 1,000 people, and is served by the Hudson City School District. The hamlet is home to a number of small businesses, and is surrounded by rolling hills and farmland.
Common Questions
What is Per Capita Income in Claverack Red Mills?
Per Capita income in Claverack Red Mills is $63,285.
What is the Median Family Income in Claverack Red Mills?
Median Family Income in Claverack Red Mills is $157,917.
What is the Median Household income in Claverack Red Mills?
Median Household Income in Claverack Red Mills is $147,500.
What is Income or Wage Gap in Claverack Red Mills?
Income or Wage Gap in Claverack Red Mills is 13.0%.
Women in Claverack Red Mills earn 87.0 cents for every dollar earned by a man.
What is Inequality or Gini Index in Claverack Red Mills?
Inequality or Gini Index in Claverack Red Mills is 0.30.
What is the Total Population of Claverack Red Mills?
Total Population of Claverack Red Mills is 1,042.
What is the Total Male Population of Claverack Red Mills?
Total Male Population of Claverack Red Mills is 558.
What is the Total Female Population of Claverack Red Mills?
Total Female Population of Claverack Red Mills is 484.
What is the Ratio of Males per 100 Females in Claverack Red Mills?
There are 115.29 Males per 100 Females in Claverack Red Mills.
What is the Ratio of Females per 100 Males in Claverack Red Mills?
There are 86.74 Females per 100 Males in Claverack Red Mills.
What is the Median Population Age in Claverack Red Mills?
Median Population Age in Claverack Red Mills is 55.4 Years.
What is the Average Family Size in Claverack Red Mills
Average Family Size in Claverack Red Mills is 2.7 People.
What is the Average Household Size in Claverack Red Mills
Average Household Size in Claverack Red Mills is 2.5 People.
How Large is the Labor Force in Claverack Red Mills?
There are 661 People in the Labor Forcein in Claverack Red Mills.
What is the Percentage of People in the Labor Force in Claverack Red Mills?
68.1% of People are in the Labor Force in Claverack Red Mills.