Cities with the Largest Lithuanian Community in New York
RELATED REPORTS & OPTIONS
Lithuanian
New York
Compare Cities
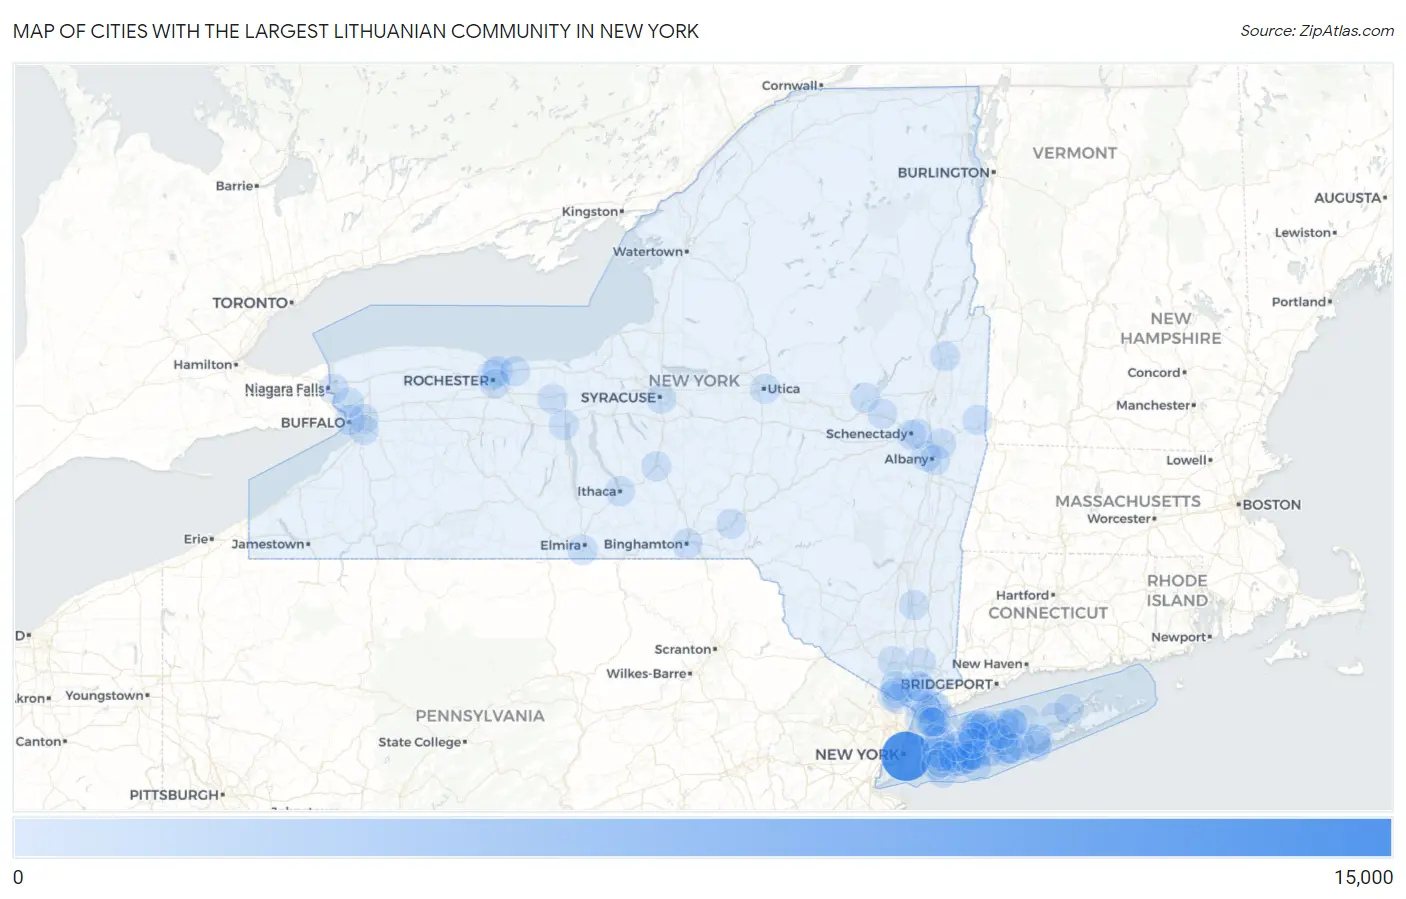
Map of Cities with the Largest Lithuanian Community in New York
0
15,000
Cities with the Largest Lithuanian Community in New York
| City | Lithuanian | vs State | vs National | |
| 1. | New York | 12,873 | 40,416(31.85%)#1 | 613,139(2.10%)#1 |
| 2. | Long Beach | 347 | 40,416(0.86%)#2 | 613,139(0.06%)#184 |
| 3. | Buffalo | 309 | 40,416(0.76%)#3 | 613,139(0.05%)#231 |
| 4. | Monsey | 307 | 40,416(0.76%)#4 | 613,139(0.05%)#238 |
| 5. | Rochester | 300 | 40,416(0.74%)#5 | 613,139(0.05%)#245 |
| 6. | Binghamton | 294 | 40,416(0.73%)#6 | 613,139(0.05%)#251 |
| 7. | Southport | 286 | 40,416(0.71%)#7 | 613,139(0.05%)#259 |
| 8. | White Plains | 279 | 40,416(0.69%)#8 | 613,139(0.05%)#270 |
| 9. | Plainview | 242 | 40,416(0.60%)#9 | 613,139(0.04%)#327 |
| 10. | Irondequoit | 232 | 40,416(0.57%)#10 | 613,139(0.04%)#347 |
| 11. | Garden City | 198 | 40,416(0.49%)#11 | 613,139(0.03%)#431 |
| 12. | East Meadow | 192 | 40,416(0.48%)#12 | 613,139(0.03%)#447 |
| 13. | Albany | 181 | 40,416(0.45%)#13 | 613,139(0.03%)#489 |
| 14. | Huntington | 178 | 40,416(0.44%)#14 | 613,139(0.03%)#500 |
| 15. | Commack | 170 | 40,416(0.42%)#15 | 613,139(0.03%)#523 |
| 16. | Port Washington | 163 | 40,416(0.40%)#16 | 613,139(0.03%)#552 |
| 17. | Syracuse | 154 | 40,416(0.38%)#17 | 613,139(0.03%)#587 |
| 18. | Mastic | 154 | 40,416(0.38%)#18 | 613,139(0.03%)#590 |
| 19. | Utica | 150 | 40,416(0.37%)#19 | 613,139(0.02%)#602 |
| 20. | Dix Hills | 150 | 40,416(0.37%)#20 | 613,139(0.02%)#603 |
| 21. | Islip | 147 | 40,416(0.36%)#21 | 613,139(0.02%)#614 |
| 22. | Riverhead | 144 | 40,416(0.36%)#22 | 613,139(0.02%)#627 |
| 23. | Brighton | 142 | 40,416(0.35%)#23 | 613,139(0.02%)#640 |
| 24. | Smithtown | 141 | 40,416(0.35%)#24 | 613,139(0.02%)#644 |
| 25. | Ithaca | 131 | 40,416(0.32%)#25 | 613,139(0.02%)#713 |
| 26. | Hoosick Falls | 131 | 40,416(0.32%)#26 | 613,139(0.02%)#715 |
| 27. | Amsterdam | 126 | 40,416(0.31%)#27 | 613,139(0.02%)#745 |
| 28. | North Massapequa | 126 | 40,416(0.31%)#28 | 613,139(0.02%)#746 |
| 29. | Irvington | 126 | 40,416(0.31%)#29 | 613,139(0.02%)#747 |
| 30. | Great Neck | 124 | 40,416(0.31%)#30 | 613,139(0.02%)#755 |
| 31. | Rye | 123 | 40,416(0.30%)#31 | 613,139(0.02%)#763 |
| 32. | Northport | 123 | 40,416(0.30%)#32 | 613,139(0.02%)#765 |
| 33. | North Lindenhurst | 120 | 40,416(0.30%)#33 | 613,139(0.02%)#788 |
| 34. | Mattituck | 115 | 40,416(0.28%)#34 | 613,139(0.02%)#833 |
| 35. | Yonkers | 111 | 40,416(0.27%)#35 | 613,139(0.02%)#853 |
| 36. | Niskayuna | 111 | 40,416(0.27%)#36 | 613,139(0.02%)#863 |
| 37. | Schenectady | 109 | 40,416(0.27%)#37 | 613,139(0.02%)#880 |
| 38. | Huntington Station | 107 | 40,416(0.26%)#38 | 613,139(0.02%)#900 |
| 39. | Centereach | 107 | 40,416(0.26%)#39 | 613,139(0.02%)#902 |
| 40. | Airmont | 100 | 40,416(0.25%)#40 | 613,139(0.02%)#982 |
| 41. | Munsey Park | 98 | 40,416(0.24%)#41 | 613,139(0.02%)#1,013 |
| 42. | Tonawanda | 97 | 40,416(0.24%)#42 | 613,139(0.02%)#1,015 |
| 43. | East Massapequa | 97 | 40,416(0.24%)#43 | 613,139(0.02%)#1,019 |
| 44. | East Northport | 94 | 40,416(0.23%)#44 | 613,139(0.02%)#1,058 |
| 45. | Rensselaer | 94 | 40,416(0.23%)#45 | 613,139(0.02%)#1,060 |
| 46. | Franklin Square | 93 | 40,416(0.23%)#46 | 613,139(0.02%)#1,066 |
| 47. | Merrick | 93 | 40,416(0.23%)#47 | 613,139(0.02%)#1,068 |
| 48. | West Sayville | 92 | 40,416(0.23%)#48 | 613,139(0.02%)#1,087 |
| 49. | Bay Shore | 91 | 40,416(0.23%)#49 | 613,139(0.01%)#1,098 |
| 50. | Woodbury | 90 | 40,416(0.22%)#50 | 613,139(0.01%)#1,110 |
| 51. | West Babylon | 89 | 40,416(0.22%)#51 | 613,139(0.01%)#1,115 |
| 52. | Troy | 87 | 40,416(0.22%)#52 | 613,139(0.01%)#1,136 |
| 53. | Floral Park | 87 | 40,416(0.22%)#53 | 613,139(0.01%)#1,142 |
| 54. | Cheektowaga | 85 | 40,416(0.21%)#54 | 613,139(0.01%)#1,156 |
| 55. | Geneva | 85 | 40,416(0.21%)#55 | 613,139(0.01%)#1,167 |
| 56. | Harrison | 82 | 40,416(0.20%)#56 | 613,139(0.01%)#1,197 |
| 57. | Chestnut Ridge | 82 | 40,416(0.20%)#57 | 613,139(0.01%)#1,206 |
| 58. | Wantagh | 81 | 40,416(0.20%)#58 | 613,139(0.01%)#1,221 |
| 59. | Sayville | 81 | 40,416(0.20%)#59 | 613,139(0.01%)#1,222 |
| 60. | Stony Brook | 79 | 40,416(0.20%)#60 | 613,139(0.01%)#1,246 |
| 61. | New City | 78 | 40,416(0.19%)#61 | 613,139(0.01%)#1,253 |
| 62. | Mamaroneck | 78 | 40,416(0.19%)#62 | 613,139(0.01%)#1,256 |
| 63. | Massapequa Park | 78 | 40,416(0.19%)#63 | 613,139(0.01%)#1,258 |
| 64. | West Hempstead | 77 | 40,416(0.19%)#64 | 613,139(0.01%)#1,278 |
| 65. | Afton | 75 | 40,416(0.19%)#65 | 613,139(0.01%)#1,309 |
| 66. | Niagara Falls | 74 | 40,416(0.18%)#66 | 613,139(0.01%)#1,316 |
| 67. | Ronkonkoma | 74 | 40,416(0.18%)#67 | 613,139(0.01%)#1,321 |
| 68. | Briarcliff Manor | 74 | 40,416(0.18%)#68 | 613,139(0.01%)#1,326 |
| 69. | Centerport | 74 | 40,416(0.18%)#69 | 613,139(0.01%)#1,330 |
| 70. | East Patchogue | 73 | 40,416(0.18%)#70 | 613,139(0.01%)#1,347 |
| 71. | Hartsdale | 69 | 40,416(0.17%)#71 | 613,139(0.01%)#1,415 |
| 72. | Moriches | 69 | 40,416(0.17%)#72 | 613,139(0.01%)#1,416 |
| 73. | Woodmere | 68 | 40,416(0.17%)#73 | 613,139(0.01%)#1,432 |
| 74. | North Merrick | 68 | 40,416(0.17%)#74 | 613,139(0.01%)#1,436 |
| 75. | Lake Mohegan | 68 | 40,416(0.17%)#75 | 613,139(0.01%)#1,440 |
| 76. | Gilgo | 68 | 40,416(0.17%)#76 | 613,139(0.01%)#1,445 |
| 77. | Wesley Hills | 67 | 40,416(0.17%)#77 | 613,139(0.01%)#1,459 |
| 78. | Gloversville | 65 | 40,416(0.16%)#78 | 613,139(0.01%)#1,509 |
| 79. | Port Jefferson Station | 65 | 40,416(0.16%)#79 | 613,139(0.01%)#1,510 |
| 80. | North Amityville | 64 | 40,416(0.16%)#80 | 613,139(0.01%)#1,525 |
| 81. | Lynbrook | 64 | 40,416(0.16%)#81 | 613,139(0.01%)#1,526 |
| 82. | Mastic Beach | 64 | 40,416(0.16%)#82 | 613,139(0.01%)#1,528 |
| 83. | West Seneca | 62 | 40,416(0.15%)#83 | 613,139(0.01%)#1,557 |
| 84. | Glens Falls | 62 | 40,416(0.15%)#84 | 613,139(0.01%)#1,566 |
| 85. | Rocky Point | 62 | 40,416(0.15%)#85 | 613,139(0.01%)#1,567 |
| 86. | Hauppauge | 61 | 40,416(0.15%)#86 | 613,139(0.01%)#1,580 |
| 87. | Melville | 61 | 40,416(0.15%)#87 | 613,139(0.01%)#1,582 |
| 88. | Ossining | 60 | 40,416(0.15%)#88 | 613,139(0.01%)#1,608 |
| 89. | Cortland | 60 | 40,416(0.15%)#89 | 613,139(0.01%)#1,617 |
| 90. | Webster | 58 | 40,416(0.14%)#90 | 613,139(0.01%)#1,678 |
| 91. | New Rochelle | 57 | 40,416(0.14%)#91 | 613,139(0.01%)#1,682 |
| 92. | Bayport | 57 | 40,416(0.14%)#92 | 613,139(0.01%)#1,696 |
| 93. | Nesconset | 56 | 40,416(0.14%)#93 | 613,139(0.01%)#1,728 |
| 94. | Terryville | 55 | 40,416(0.14%)#94 | 613,139(0.01%)#1,759 |
| 95. | Larchmont | 55 | 40,416(0.14%)#95 | 613,139(0.01%)#1,764 |
| 96. | Hicksville | 54 | 40,416(0.13%)#96 | 613,139(0.01%)#1,771 |
| 97. | Fort Salonga | 54 | 40,416(0.13%)#97 | 613,139(0.01%)#1,790 |
| 98. | Poughkeepsie | 53 | 40,416(0.13%)#98 | 613,139(0.01%)#1,806 |
| 99. | Newark | 53 | 40,416(0.13%)#99 | 613,139(0.01%)#1,817 |
| 100. | South Huntington | 52 | 40,416(0.13%)#100 | 613,139(0.01%)#1,845 |
Common Questions
What are the Top 10 Cities with the Largest Lithuanian Community in New York?
Top 10 Cities with the Largest Lithuanian Community in New York are:
#1
12,873
#2
347
#3
309
#4
307
#5
300
#6
294
#7
286
#8
279
#9
242
#10
232
What city has the Largest Lithuanian Community in New York?
New York has the Largest Lithuanian Community in New York with 12,873.
What is the Total Lithuanian Population in the State of New York?
Total Lithuanian Population in New York is 40,416.
What is the Total Lithuanian Population in the United States?
Total Lithuanian Population in the United States is 613,139.