Cities with the Highest Percentage of Population Employed in Administrative & Support Services in New York
RELATED REPORTS & OPTIONS
Administrative & Support Services
New York
Compare Cities
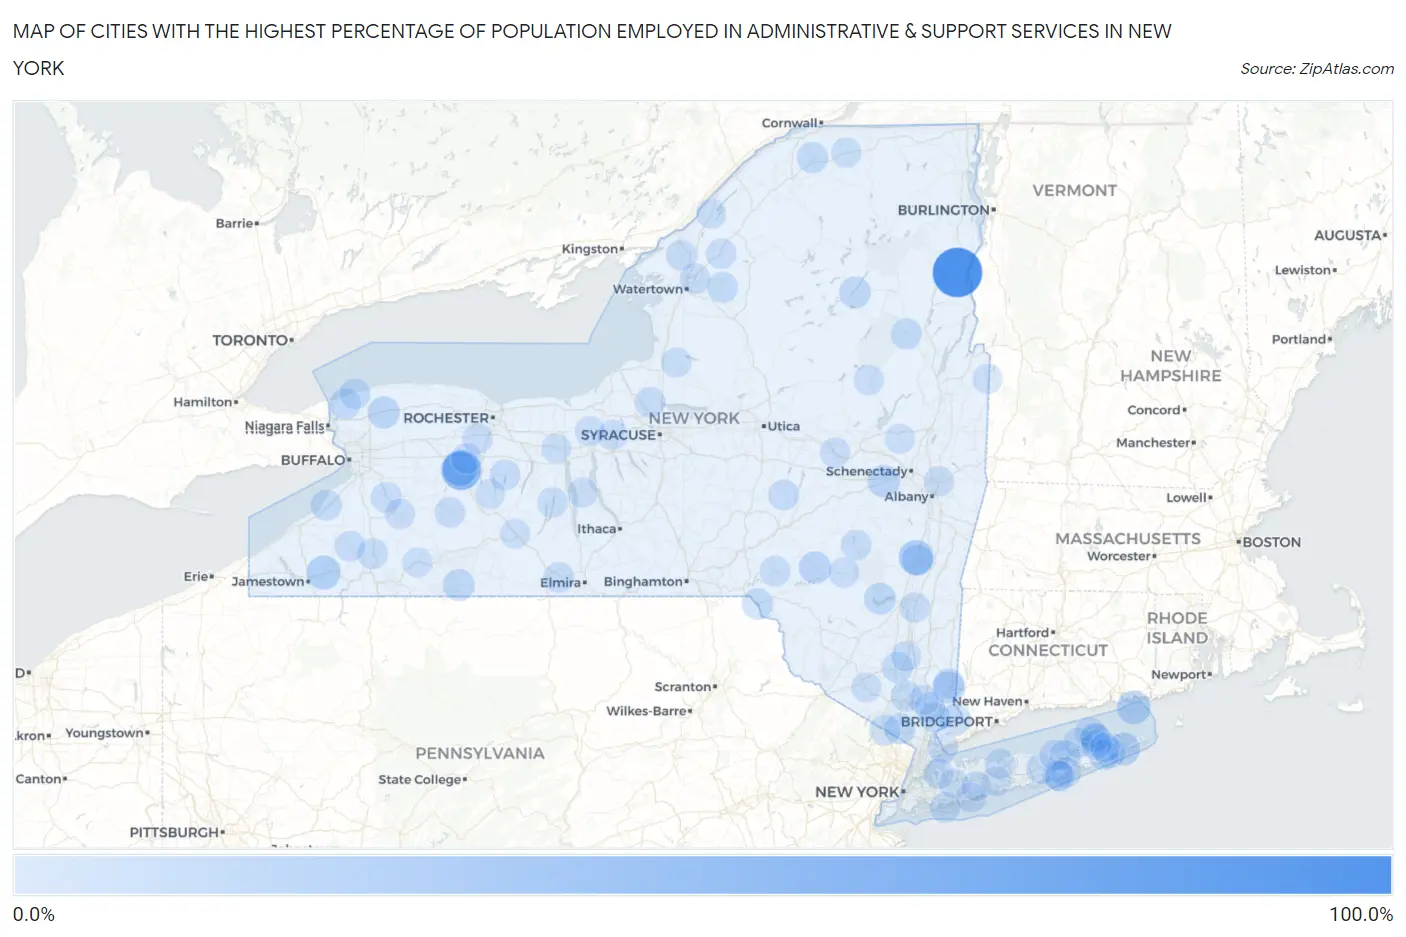
Map of Cities with the Highest Percentage of Population Employed in Administrative & Support Services in New York
0.0%
100.0%
Cities with the Highest Percentage of Population Employed in Administrative & Support Services in New York
| City | % Employed | vs State | vs National | |
| 1. | Witherbee | 97.4% | 3.7%(+93.7)#1 | 4.1%(+93.3)#12 |
| 2. | Wadsworth | 51.9% | 3.7%(+48.2)#2 | 4.1%(+47.7)#52 |
| 3. | Copake | 35.9% | 3.7%(+32.2)#3 | 4.1%(+31.7)#125 |
| 4. | Upper Red Hook | 30.6% | 3.7%(+26.9)#4 | 4.1%(+26.4)#178 |
| 5. | Leeds | 28.9% | 3.7%(+25.2)#5 | 4.1%(+24.7)#208 |
| 6. | Greigsville | 28.8% | 3.7%(+25.1)#6 | 4.1%(+24.6)#211 |
| 7. | Kennedy | 24.0% | 3.7%(+20.4)#7 | 4.1%(+19.9)#309 |
| 8. | Fishers Island | 23.1% | 3.7%(+19.4)#8 | 4.1%(+18.9)#340 |
| 9. | Napeague | 19.3% | 3.7%(+15.6)#9 | 4.1%(+15.1)#473 |
| 10. | Andes | 17.6% | 3.7%(+14.0)#10 | 4.1%(+13.5)#565 |
| 11. | Brewster | 16.9% | 3.7%(+13.2)#11 | 4.1%(+12.8)#615 |
| 12. | Delanson | 16.7% | 3.7%(+13.0)#12 | 4.1%(+12.5)#629 |
| 13. | Gasport | 16.2% | 3.7%(+12.5)#13 | 4.1%(+12.1)#669 |
| 14. | Shokan | 15.5% | 3.7%(+11.8)#14 | 4.1%(+11.3)#734 |
| 15. | South Edmeston | 15.2% | 3.7%(+11.5)#15 | 4.1%(+11.1)#772 |
| 16. | Scotts Corners | 15.1% | 3.7%(+11.5)#16 | 4.1%(+11.0)#777 |
| 17. | Shelter Island | 15.1% | 3.7%(+11.4)#17 | 4.1%(+11.0)#781 |
| 18. | Long Lake | 15.0% | 3.7%(+11.3)#18 | 4.1%(+10.8)#792 |
| 19. | Stannards | 14.9% | 3.7%(+11.2)#19 | 4.1%(+10.7)#817 |
| 20. | Mclean | 13.9% | 3.7%(+10.2)#20 | 4.1%(+9.71)#962 |
| 21. | Hancock | 13.2% | 3.7%(+9.56)#21 | 4.1%(+9.10)#1,071 |
| 22. | Jefferson Heights | 13.1% | 3.7%(+9.44)#22 | 4.1%(+8.98)#1,094 |
| 23. | East Hampton North | 13.1% | 3.7%(+9.44)#23 | 4.1%(+8.98)#1,095 |
| 24. | Ransomville | 13.0% | 3.7%(+9.28)#24 | 4.1%(+8.82)#1,125 |
| 25. | Hillcrest | 12.8% | 3.7%(+9.15)#25 | 4.1%(+8.69)#1,148 |
| 26. | Winthrop | 12.8% | 3.7%(+9.11)#26 | 4.1%(+8.65)#1,154 |
| 27. | South Cairo | 12.6% | 3.7%(+8.94)#27 | 4.1%(+8.48)#1,187 |
| 28. | Farnham | 12.1% | 3.7%(+8.42)#28 | 4.1%(+7.96)#1,289 |
| 29. | Shorehaven | 12.1% | 3.7%(+8.40)#29 | 4.1%(+7.93)#1,295 |
| 30. | Carthage | 11.8% | 3.7%(+8.15)#30 | 4.1%(+7.68)#1,349 |
| 31. | Gardnertown | 11.7% | 3.7%(+7.97)#31 | 4.1%(+7.51)#1,390 |
| 32. | Hillburn | 11.6% | 3.7%(+7.96)#32 | 4.1%(+7.50)#1,392 |
| 33. | Manorville | 11.5% | 3.7%(+7.81)#33 | 4.1%(+7.35)#1,423 |
| 34. | North Creek | 11.5% | 3.7%(+7.81)#34 | 4.1%(+7.34)#1,425 |
| 35. | Holland | 10.9% | 3.7%(+7.26)#35 | 4.1%(+6.80)#1,568 |
| 36. | Wilson | 10.7% | 3.7%(+6.98)#36 | 4.1%(+6.52)#1,641 |
| 37. | Calcium | 10.6% | 3.7%(+6.94)#37 | 4.1%(+6.48)#1,655 |
| 38. | Mount Kisco | 10.6% | 3.7%(+6.88)#38 | 4.1%(+6.42)#1,676 |
| 39. | Ellicottville | 10.5% | 3.7%(+6.84)#39 | 4.1%(+6.38)#1,685 |
| 40. | Fort Montgomery | 10.5% | 3.7%(+6.79)#40 | 4.1%(+6.33)#1,705 |
| 41. | Brewster Hill | 10.4% | 3.7%(+6.74)#41 | 4.1%(+6.28)#1,727 |
| 42. | Hartwick | 10.4% | 3.7%(+6.74)#42 | 4.1%(+6.27)#1,729 |
| 43. | Riverhead | 10.4% | 3.7%(+6.73)#43 | 4.1%(+6.27)#1,738 |
| 44. | South Corning | 10.4% | 3.7%(+6.72)#44 | 4.1%(+6.25)#1,742 |
| 45. | Yorktown Heights | 10.2% | 3.7%(+6.49)#45 | 4.1%(+6.03)#1,822 |
| 46. | Sand Ridge | 10.1% | 3.7%(+6.39)#46 | 4.1%(+5.93)#1,869 |
| 47. | Walton | 10.0% | 3.7%(+6.35)#47 | 4.1%(+5.89)#1,885 |
| 48. | Fowlerville | 10.0% | 3.7%(+6.31)#48 | 4.1%(+5.85)#1,902 |
| 49. | Hunt | 10.0% | 3.7%(+6.31)#49 | 4.1%(+5.85)#1,906 |
| 50. | Prattsville | 10.0% | 3.7%(+6.31)#50 | 4.1%(+5.85)#1,910 |
| 51. | Port Chester | 9.9% | 3.7%(+6.24)#51 | 4.1%(+5.78)#1,940 |
| 52. | Cattaraugus | 9.9% | 3.7%(+6.22)#52 | 4.1%(+5.76)#1,947 |
| 53. | Honeoye | 9.9% | 3.7%(+6.21)#53 | 4.1%(+5.74)#1,952 |
| 54. | La Fargeville | 9.8% | 3.7%(+6.16)#54 | 4.1%(+5.69)#1,972 |
| 55. | Head Of The Harbor | 9.7% | 3.7%(+6.04)#55 | 4.1%(+5.57)#2,023 |
| 56. | Mountain Dale | 9.7% | 3.7%(+6.03)#56 | 4.1%(+5.57)#2,025 |
| 57. | East Herkimer | 9.5% | 3.7%(+5.86)#57 | 4.1%(+5.40)#2,099 |
| 58. | Antwerp | 9.5% | 3.7%(+5.86)#58 | 4.1%(+5.40)#2,100 |
| 59. | Wainscott | 9.5% | 3.7%(+5.84)#59 | 4.1%(+5.37)#2,105 |
| 60. | Scottsville | 9.4% | 3.7%(+5.73)#60 | 4.1%(+5.27)#2,158 |
| 61. | Baxter Estates | 9.4% | 3.7%(+5.69)#61 | 4.1%(+5.23)#2,179 |
| 62. | Fleischmanns | 9.3% | 3.7%(+5.65)#62 | 4.1%(+5.18)#2,195 |
| 63. | Keuka Park | 9.2% | 3.7%(+5.51)#63 | 4.1%(+5.05)#2,261 |
| 64. | Greenport | 9.1% | 3.7%(+5.45)#64 | 4.1%(+4.99)#2,292 |
| 65. | Nelliston | 9.1% | 3.7%(+5.40)#65 | 4.1%(+4.94)#2,312 |
| 66. | Marlboro | 9.0% | 3.7%(+5.27)#66 | 4.1%(+4.81)#2,394 |
| 67. | Peconic | 8.9% | 3.7%(+5.23)#67 | 4.1%(+4.77)#2,421 |
| 68. | Barnum Island | 8.9% | 3.7%(+5.21)#68 | 4.1%(+4.75)#2,435 |
| 69. | Amityville | 8.9% | 3.7%(+5.20)#69 | 4.1%(+4.73)#2,448 |
| 70. | Milton Cdp Ulster County | 8.9% | 3.7%(+5.17)#70 | 4.1%(+4.70)#2,464 |
| 71. | Jamesport | 8.8% | 3.7%(+5.16)#71 | 4.1%(+4.70)#2,468 |
| 72. | East Quogue | 8.8% | 3.7%(+5.15)#72 | 4.1%(+4.69)#2,474 |
| 73. | Rhinebeck | 8.8% | 3.7%(+5.15)#73 | 4.1%(+4.69)#2,478 |
| 74. | Weedsport | 8.8% | 3.7%(+5.12)#74 | 4.1%(+4.66)#2,487 |
| 75. | Wells | 8.7% | 3.7%(+5.05)#75 | 4.1%(+4.59)#2,529 |
| 76. | Schuyler Lake | 8.7% | 3.7%(+5.01)#76 | 4.1%(+4.55)#2,558 |
| 77. | Green Island | 8.7% | 3.7%(+4.99)#77 | 4.1%(+4.53)#2,571 |
| 78. | Westhampton | 8.7% | 3.7%(+4.98)#78 | 4.1%(+4.52)#2,575 |
| 79. | Shrub Oak | 8.5% | 3.7%(+4.78)#79 | 4.1%(+4.32)#2,696 |
| 80. | Altmar | 8.5% | 3.7%(+4.77)#80 | 4.1%(+4.31)#2,699 |
| 81. | Arcade | 8.4% | 3.7%(+4.72)#81 | 4.1%(+4.26)#2,731 |
| 82. | Brushton | 8.4% | 3.7%(+4.71)#82 | 4.1%(+4.25)#2,736 |
| 83. | Quiogue | 8.3% | 3.7%(+4.59)#83 | 4.1%(+4.13)#2,822 |
| 84. | North Haven | 8.3% | 3.7%(+4.57)#84 | 4.1%(+4.11)#2,825 |
| 85. | Galway | 8.2% | 3.7%(+4.53)#85 | 4.1%(+4.07)#2,861 |
| 86. | Granville | 8.2% | 3.7%(+4.48)#86 | 4.1%(+4.02)#2,888 |
| 87. | Avoca | 8.2% | 3.7%(+4.48)#87 | 4.1%(+4.02)#2,890 |
| 88. | Savannah | 8.1% | 3.7%(+4.46)#88 | 4.1%(+4.00)#2,898 |
| 89. | New Cassel | 8.1% | 3.7%(+4.44)#89 | 4.1%(+3.98)#2,909 |
| 90. | Cuba | 8.1% | 3.7%(+4.44)#90 | 4.1%(+3.98)#2,911 |
| 91. | Goshen | 8.1% | 3.7%(+4.39)#91 | 4.1%(+3.93)#2,941 |
| 92. | Central Islip | 7.8% | 3.7%(+4.13)#92 | 4.1%(+3.67)#3,131 |
| 93. | Ovid | 7.8% | 3.7%(+4.09)#93 | 4.1%(+3.63)#3,157 |
| 94. | Chelsea Cove | 7.8% | 3.7%(+4.08)#94 | 4.1%(+3.62)#3,167 |
| 95. | Websters Crossing | 7.7% | 3.7%(+4.00)#95 | 4.1%(+3.54)#3,228 |
| 96. | Wyandanch | 7.7% | 3.7%(+3.97)#96 | 4.1%(+3.51)#3,258 |
| 97. | Shelter Island Heights | 7.6% | 3.7%(+3.95)#97 | 4.1%(+3.49)#3,285 |
| 98. | Hammond | 7.6% | 3.7%(+3.92)#98 | 4.1%(+3.46)#3,300 |
| 99. | Phelps | 7.5% | 3.7%(+3.83)#99 | 4.1%(+3.37)#3,370 |
| 100. | Northwest Harbor | 7.5% | 3.7%(+3.83)#100 | 4.1%(+3.37)#3,371 |
Common Questions
What are the Top 10 Cities with the Highest Percentage of Population Employed in Administrative & Support Services in New York?
Top 10 Cities with the Highest Percentage of Population Employed in Administrative & Support Services in New York are:
#1
97.4%
#2
51.9%
#3
28.9%
#4
28.8%
#5
24.0%
#6
23.1%
#7
19.3%
#8
17.6%
#9
16.9%
#10
16.7%
What city has the Highest Percentage of Population Employed in Administrative & Support Services in New York?
Witherbee has the Highest Percentage of Population Employed in Administrative & Support Services in New York with 97.4%.
What is the Percentage of Population Employed in Administrative & Support Services in the State of New York?
Percentage of Population Employed in Administrative & Support Services in New York is 3.7%.
What is the Percentage of Population Employed in Administrative & Support Services in the United States?
Percentage of Population Employed in Administrative & Support Services in the United States is 4.1%.