Zip Codes with the Highest Percentage of Population Employed in Food Preparation & Serving in Fresh Meadows, NY
RELATED REPORTS & OPTIONS
Food Preparation & Serving
Fresh Meadows
Compare Zip Codes
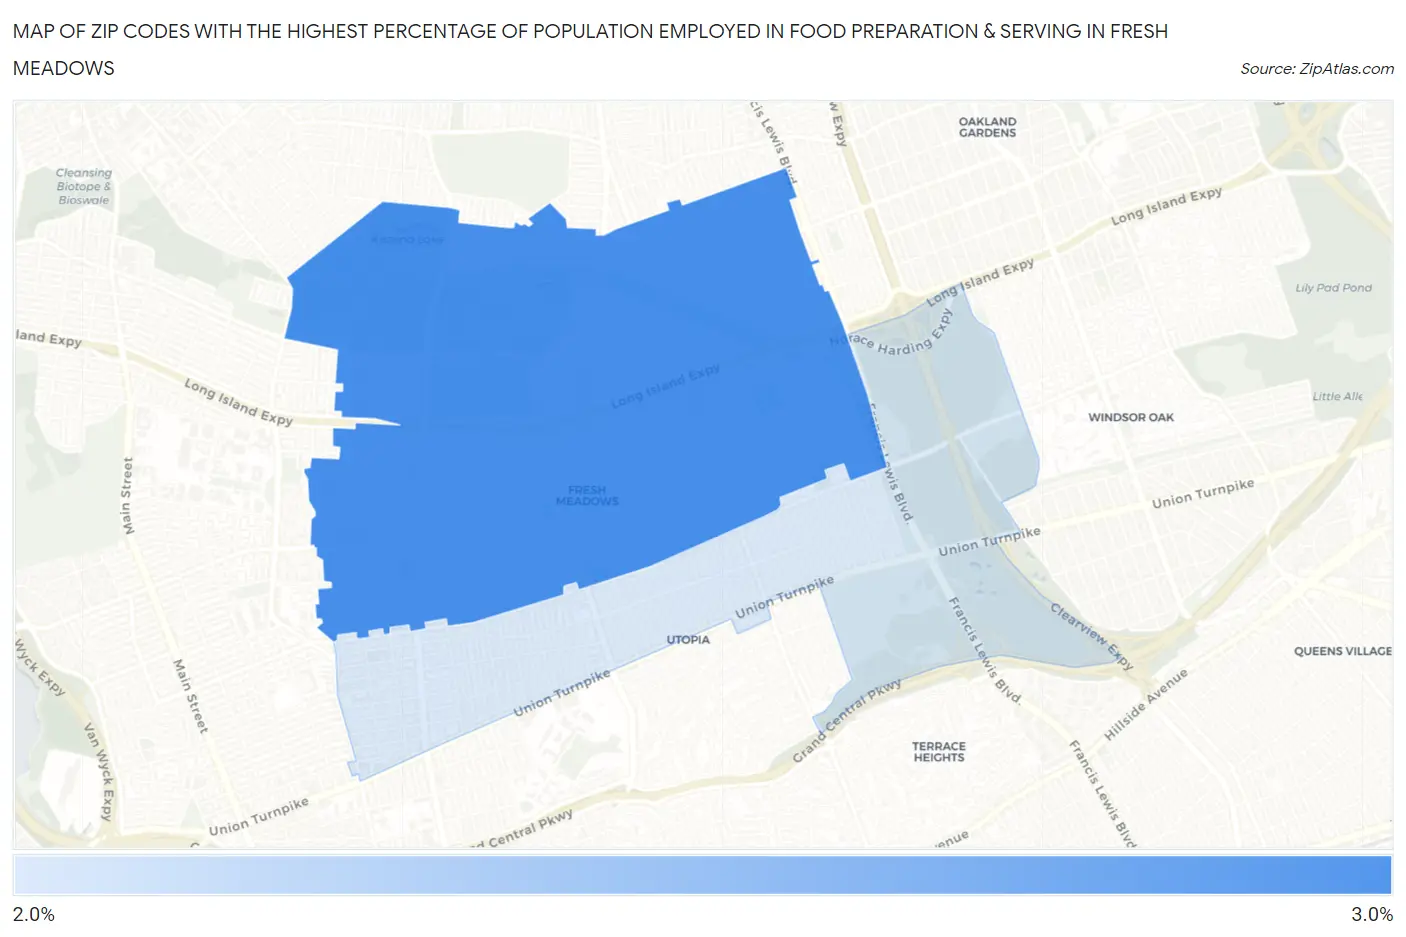
Map of Zip Codes with the Highest Percentage of Population Employed in Food Preparation & Serving in Fresh Meadows
2.7%
3.0%
Zip Codes with the Highest Percentage of Population Employed in Food Preparation & Serving in Fresh Meadows, NY
| Zip Code | % Employed | vs State | vs National | |
| 1. | 11365 | 3.0% | 4.8%(-1.84)#1,107 | 5.3%(-2.31)#21,342 |
| 2. | 11366 | 2.7% | 4.8%(-2.08)#1,174 | 5.3%(-2.55)#22,291 |
1
Common Questions
What are the Top Zip Codes with the Highest Percentage of Population Employed in Food Preparation & Serving in Fresh Meadows, NY?
Top Zip Codes with the Highest Percentage of Population Employed in Food Preparation & Serving in Fresh Meadows, NY are:
What zip code has the Highest Percentage of Population Employed in Food Preparation & Serving in Fresh Meadows, NY?
11365 has the Highest Percentage of Population Employed in Food Preparation & Serving in Fresh Meadows, NY with 3.0%.
What is the Percentage of Population Employed in Food Preparation & Serving in New York?
Percentage of Population Employed in Food Preparation & Serving in New York is 4.8%.
What is the Percentage of Population Employed in Food Preparation & Serving in the United States?
Percentage of Population Employed in Food Preparation & Serving in the United States is 5.3%.