Cities with the Highest Percentage of Yugoslavian Population in New York
RELATED REPORTS & OPTIONS
Yugoslavian
New York
Compare Cities
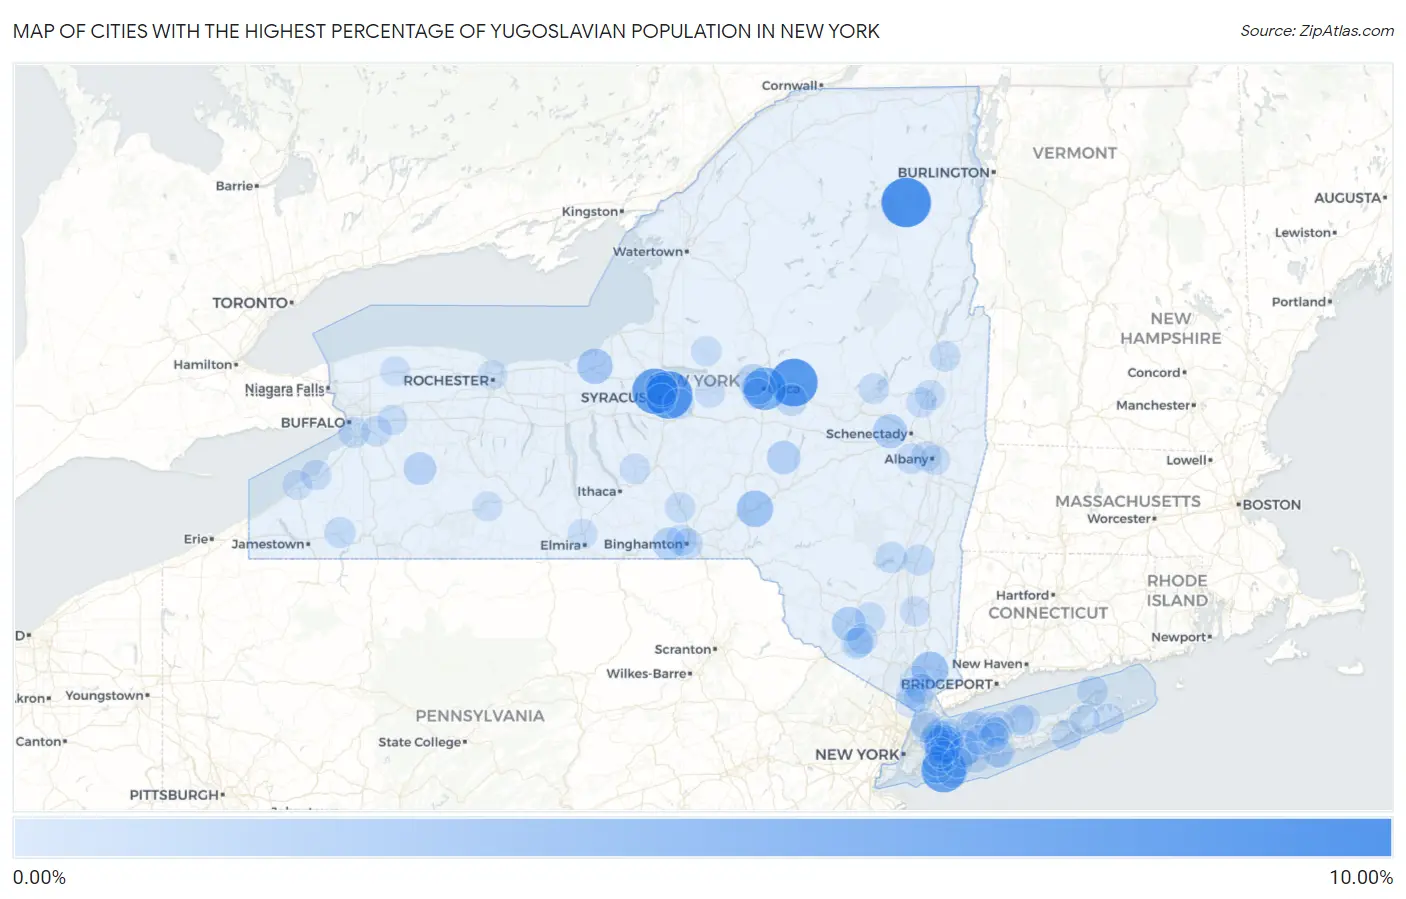
Map of Cities with the Highest Percentage of Yugoslavian Population in New York
0.00%
10.00%
Cities with the Highest Percentage of Yugoslavian Population in New York
| City | Yugoslavian | vs State | vs National | |
| 1. | Lake Placid | 9.39% | 0.088%(+9.30)#1 | 0.067%(+9.32)#16 |
| 2. | Middleville | 8.52% | 0.088%(+8.43)#2 | 0.067%(+8.45)#18 |
| 3. | East Syracuse | 8.35% | 0.088%(+8.26)#3 | 0.067%(+8.29)#19 |
| 4. | Galeville | 7.43% | 0.088%(+7.34)#4 | 0.067%(+7.36)#22 |
| 5. | Island Park | 7.12% | 0.088%(+7.03)#5 | 0.067%(+7.05)#23 |
| 6. | Utica | 5.92% | 0.088%(+5.83)#6 | 0.067%(+5.86)#32 |
| 7. | Albertson | 4.47% | 0.088%(+4.39)#7 | 0.067%(+4.41)#46 |
| 8. | Cadyville | 4.19% | 0.088%(+4.10)#8 | 0.067%(+4.12)#52 |
| 9. | Yorktown Heights | 3.21% | 0.088%(+3.13)#9 | 0.067%(+3.15)#66 |
| 10. | Unadilla | 3.07% | 0.088%(+2.98)#10 | 0.067%(+3.00)#71 |
| 11. | Roessleville | 2.62% | 0.088%(+2.54)#11 | 0.067%(+2.56)#87 |
| 12. | Red Creek | 2.55% | 0.088%(+2.46)#12 | 0.067%(+2.48)#92 |
| 13. | Searingtown | 2.47% | 0.088%(+2.38)#13 | 0.067%(+2.40)#97 |
| 14. | Old Bethpage | 2.35% | 0.088%(+2.27)#14 | 0.067%(+2.29)#99 |
| 15. | Sparrow Bush | 2.04% | 0.088%(+1.96)#15 | 0.067%(+1.98)#118 |
| 16. | New Hackensack | 1.96% | 0.088%(+1.87)#16 | 0.067%(+1.89)#131 |
| 17. | Mariaville Lake | 1.93% | 0.088%(+1.84)#17 | 0.067%(+1.86)#136 |
| 18. | Wurtsboro | 1.89% | 0.088%(+1.80)#18 | 0.067%(+1.82)#139 |
| 19. | Yorkville | 1.78% | 0.088%(+1.70)#19 | 0.067%(+1.72)#152 |
| 20. | Hartwick | 1.69% | 0.088%(+1.61)#20 | 0.067%(+1.63)#159 |
| 21. | Endicott | 1.36% | 0.088%(+1.27)#21 | 0.067%(+1.29)#190 |
| 22. | Bliss | 1.35% | 0.088%(+1.26)#22 | 0.067%(+1.28)#195 |
| 23. | Mattydale | 1.27% | 0.088%(+1.18)#23 | 0.067%(+1.20)#211 |
| 24. | Lyncourt | 1.10% | 0.088%(+1.01)#24 | 0.067%(+1.03)#252 |
| 25. | Oriskany | 1.08% | 0.088%(+0.994)#25 | 0.067%(+1.02)#258 |
| 26. | East Williston | 1.06% | 0.088%(+0.977)#26 | 0.067%(+0.998)#265 |
| 27. | Herkimer | 0.93% | 0.088%(+0.845)#27 | 0.067%(+0.867)#309 |
| 28. | Woodsburgh | 0.79% | 0.088%(+0.701)#28 | 0.067%(+0.723)#392 |
| 29. | West Hurley | 0.75% | 0.088%(+0.658)#29 | 0.067%(+0.680)#413 |
| 30. | Middletown | 0.63% | 0.088%(+0.545)#30 | 0.067%(+0.567)#490 |
| 31. | Glenwood Landing | 0.60% | 0.088%(+0.508)#31 | 0.067%(+0.529)#520 |
| 32. | Red Hook | 0.55% | 0.088%(+0.463)#32 | 0.067%(+0.484)#559 |
| 33. | Lackawanna | 0.55% | 0.088%(+0.458)#33 | 0.067%(+0.480)#564 |
| 34. | East Randolph | 0.54% | 0.088%(+0.456)#34 | 0.067%(+0.478)#569 |
| 35. | Johnson City | 0.53% | 0.088%(+0.437)#35 | 0.067%(+0.459)#592 |
| 36. | Rocky Point | 0.50% | 0.088%(+0.415)#36 | 0.067%(+0.437)#617 |
| 37. | Pine Bush | 0.48% | 0.088%(+0.394)#37 | 0.067%(+0.416)#642 |
| 38. | Scotchtown | 0.47% | 0.088%(+0.385)#38 | 0.067%(+0.407)#652 |
| 39. | Manlius | 0.47% | 0.088%(+0.383)#39 | 0.067%(+0.404)#657 |
| 40. | East Quogue | 0.46% | 0.088%(+0.375)#40 | 0.067%(+0.396)#663 |
| 41. | Clifton Gardens | 0.45% | 0.088%(+0.364)#41 | 0.067%(+0.385)#678 |
| 42. | East Marion | 0.45% | 0.088%(+0.360)#42 | 0.067%(+0.381)#687 |
| 43. | Mayfield | 0.43% | 0.088%(+0.338)#43 | 0.067%(+0.360)#714 |
| 44. | Voorheesville | 0.42% | 0.088%(+0.335)#44 | 0.067%(+0.356)#720 |
| 45. | Glens Falls | 0.42% | 0.088%(+0.333)#45 | 0.067%(+0.354)#724 |
| 46. | Binghamton | 0.41% | 0.088%(+0.326)#46 | 0.067%(+0.347)#740 |
| 47. | Elma Center | 0.41% | 0.088%(+0.320)#47 | 0.067%(+0.341)#750 |
| 48. | St. John Fisher College | 0.39% | 0.088%(+0.304)#48 | 0.067%(+0.325)#778 |
| 49. | Manorhaven | 0.39% | 0.088%(+0.302)#49 | 0.067%(+0.323)#785 |
| 50. | Silver Creek | 0.38% | 0.088%(+0.293)#50 | 0.067%(+0.315)#792 |
| 51. | Halesite | 0.37% | 0.088%(+0.284)#51 | 0.067%(+0.306)#812 |
| 52. | Pelham | 0.37% | 0.088%(+0.284)#52 | 0.067%(+0.305)#814 |
| 53. | Miller Place | 0.37% | 0.088%(+0.283)#53 | 0.067%(+0.305)#816 |
| 54. | New Hartford | 0.37% | 0.088%(+0.282)#54 | 0.067%(+0.304)#817 |
| 55. | Centerport | 0.36% | 0.088%(+0.276)#55 | 0.067%(+0.298)#830 |
| 56. | Point Lookout | 0.36% | 0.088%(+0.272)#56 | 0.067%(+0.294)#839 |
| 57. | Whitney Point | 0.36% | 0.088%(+0.270)#57 | 0.067%(+0.292)#844 |
| 58. | Alden | 0.35% | 0.088%(+0.257)#58 | 0.067%(+0.279)#873 |
| 59. | Groton | 0.34% | 0.088%(+0.256)#59 | 0.067%(+0.277)#875 |
| 60. | Croton On Hudson | 0.34% | 0.088%(+0.252)#60 | 0.067%(+0.273)#884 |
| 61. | Wampsville | 0.34% | 0.088%(+0.251)#61 | 0.067%(+0.272)#888 |
| 62. | East Hampton | 0.31% | 0.088%(+0.227)#62 | 0.067%(+0.248)#943 |
| 63. | Fairview Cdp Dutchess County | 0.31% | 0.088%(+0.225)#63 | 0.067%(+0.247)#947 |
| 64. | Mineola | 0.31% | 0.088%(+0.222)#64 | 0.067%(+0.244)#955 |
| 65. | Great River | 0.30% | 0.088%(+0.213)#65 | 0.067%(+0.235)#973 |
| 66. | Lindenhurst | 0.29% | 0.088%(+0.203)#66 | 0.067%(+0.225)#1,001 |
| 67. | Great Neck | 0.29% | 0.088%(+0.201)#67 | 0.067%(+0.223)#1,010 |
| 68. | West Hempstead | 0.26% | 0.088%(+0.177)#68 | 0.067%(+0.198)#1,081 |
| 69. | Glen Head | 0.25% | 0.088%(+0.162)#69 | 0.067%(+0.183)#1,121 |
| 70. | Albany | 0.25% | 0.088%(+0.162)#70 | 0.067%(+0.183)#1,122 |
| 71. | Briarcliff Manor | 0.24% | 0.088%(+0.155)#71 | 0.067%(+0.177)#1,150 |
| 72. | Camden | 0.23% | 0.088%(+0.145)#72 | 0.067%(+0.166)#1,183 |
| 73. | Orangeburg | 0.23% | 0.088%(+0.144)#73 | 0.067%(+0.165)#1,186 |
| 74. | Ballston Spa | 0.23% | 0.088%(+0.139)#74 | 0.067%(+0.160)#1,200 |
| 75. | Plainedge | 0.22% | 0.088%(+0.135)#75 | 0.067%(+0.157)#1,210 |
| 76. | Kings Park | 0.22% | 0.088%(+0.127)#76 | 0.067%(+0.149)#1,242 |
| 77. | Saratoga Springs | 0.21% | 0.088%(+0.126)#77 | 0.067%(+0.147)#1,246 |
| 78. | Spackenkill | 0.21% | 0.088%(+0.120)#78 | 0.067%(+0.141)#1,277 |
| 79. | Bellmore | 0.20% | 0.088%(+0.113)#79 | 0.067%(+0.134)#1,306 |
| 80. | Head Of The Harbor | 0.20% | 0.088%(+0.112)#80 | 0.067%(+0.133)#1,307 |
| 81. | Valley Cottage | 0.20% | 0.088%(+0.110)#81 | 0.067%(+0.132)#1,315 |
| 82. | North Sea | 0.20% | 0.088%(+0.110)#82 | 0.067%(+0.132)#1,316 |
| 83. | Rensselaer | 0.19% | 0.088%(+0.107)#83 | 0.067%(+0.128)#1,327 |
| 84. | Sleepy Hollow | 0.19% | 0.088%(+0.104)#84 | 0.067%(+0.126)#1,338 |
| 85. | Valley Stream | 0.18% | 0.088%(+0.093)#85 | 0.067%(+0.115)#1,392 |
| 86. | Smithtown | 0.18% | 0.088%(+0.092)#86 | 0.067%(+0.113)#1,398 |
| 87. | Stewart Manor | 0.18% | 0.088%(+0.090)#87 | 0.067%(+0.112)#1,404 |
| 88. | Pelham Manor | 0.18% | 0.088%(+0.088)#88 | 0.067%(+0.109)#1,420 |
| 89. | Village Of The Branch | 0.17% | 0.088%(+0.084)#89 | 0.067%(+0.105)#1,445 |
| 90. | Carmel | 0.17% | 0.088%(+0.077)#90 | 0.067%(+0.099)#1,484 |
| 91. | Dix Hills | 0.16% | 0.088%(+0.074)#91 | 0.067%(+0.096)#1,491 |
| 92. | Horseheads | 0.15% | 0.088%(+0.065)#92 | 0.067%(+0.087)#1,545 |
| 93. | Middleport | 0.15% | 0.088%(+0.064)#93 | 0.067%(+0.086)#1,553 |
| 94. | East Islip | 0.15% | 0.088%(+0.059)#94 | 0.067%(+0.081)#1,570 |
| 95. | Syracuse | 0.15% | 0.088%(+0.059)#95 | 0.067%(+0.081)#1,574 |
| 96. | Hauppauge | 0.14% | 0.088%(+0.054)#96 | 0.067%(+0.076)#1,611 |
| 97. | Mechanicstown | 0.14% | 0.088%(+0.051)#97 | 0.067%(+0.073)#1,626 |
| 98. | Dunkirk | 0.13% | 0.088%(+0.046)#98 | 0.067%(+0.068)#1,659 |
| 99. | Hornell | 0.13% | 0.088%(+0.046)#99 | 0.067%(+0.067)#1,661 |
| 100. | Rochester | 0.12% | 0.088%(+0.036)#100 | 0.067%(+0.058)#1,722 |
Common Questions
What are the Top 10 Cities with the Highest Percentage of Yugoslavian Population in New York?
Top 10 Cities with the Highest Percentage of Yugoslavian Population in New York are:
#1
9.39%
#2
8.52%
#3
8.35%
#4
7.43%
#5
7.12%
#6
5.92%
#7
4.47%
#8
3.21%
#9
3.07%
#10
2.55%
What city has the Highest Percentage of Yugoslavian Population in New York?
Lake Placid has the Highest Percentage of Yugoslavian Population in New York with 9.39%.
What is the Percentage of Yugoslavian Population in the State of New York?
Percentage of Yugoslavian Population in New York is 0.088%.
What is the Percentage of Yugoslavian Population in the United States?
Percentage of Yugoslavian Population in the United States is 0.067%.