New Paltz, NY Map & Demographics
New Paltz Map
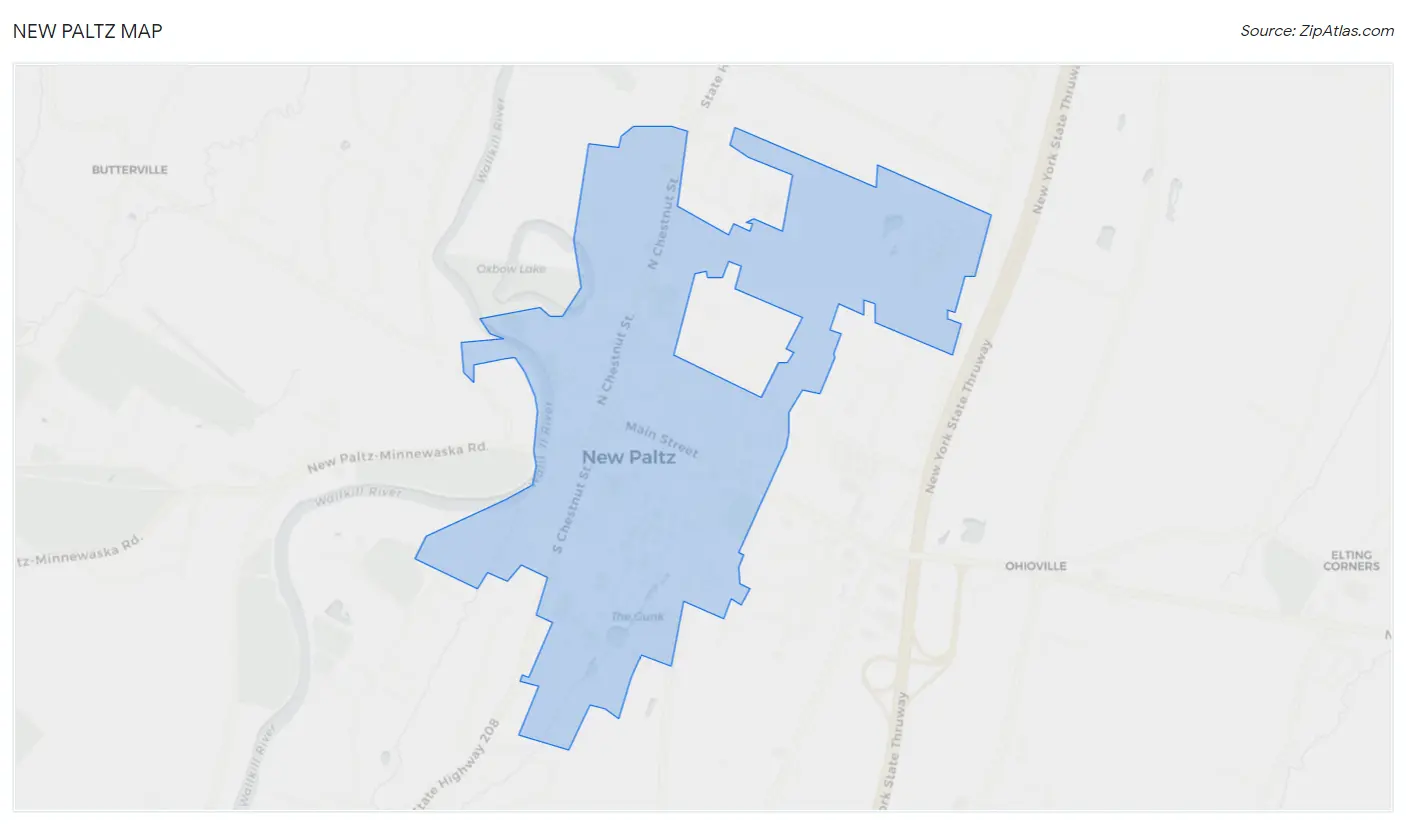
New Paltz Overview
$22,763
PER CAPITA INCOME
$87,401
AVG FAMILY INCOME
$59,779
AVG HOUSEHOLD INCOME
55.3%
WAGE / INCOME GAP [ % ]
44.7¢/ $1
WAGE / INCOME GAP [ $ ]
0.46
INEQUALITY / GINI INDEX
7,732
TOTAL POPULATION
2,933
MALE POPULATION
4,799
FEMALE POPULATION
61.12
MALES / 100 FEMALES
163.62
FEMALES / 100 MALES
21.6
MEDIAN AGE
2.7
AVG FAMILY SIZE
2.2
AVG HOUSEHOLD SIZE
3,515
LABOR FORCE [ PEOPLE ]
48.5%
PERCENT IN LABOR FORCE
9.2%
UNEMPLOYMENT RATE
New Paltz Zip Codes
New Paltz Area Codes
Income in New Paltz
Income Overview in New Paltz
Per Capita Income in New Paltz is $22,763, while median incomes of families and households are $87,401 and $59,779 respectively.
| Characteristic | Number | Measure |
| Per Capita Income | 7,732 | $22,763 |
| Median Family Income | 687 | $87,401 |
| Mean Family Income | 687 | $98,149 |
| Median Household Income | 2,221 | $59,779 |
| Mean Household Income | 2,221 | $72,388 |
| Income Deficit | 687 | $0 |
| Wage / Income Gap (%) | 7,732 | 55.27% |
| Wage / Income Gap ($) | 7,732 | 44.73¢ per $1 |
| Gini / Inequality Index | 7,732 | 0.46 |
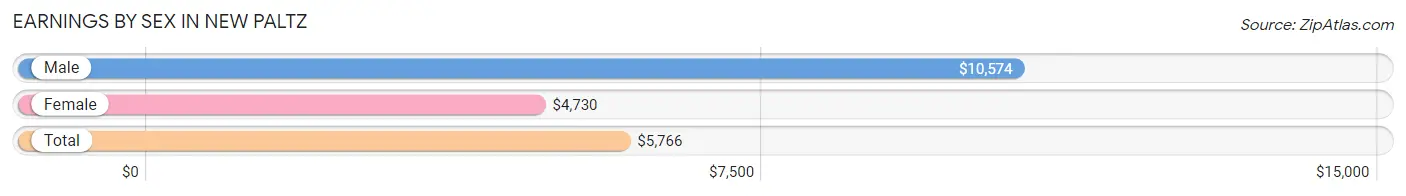
Earnings by Sex in New Paltz
Average Earnings in New Paltz are $5,766, $10,574 for men and $4,730 for women, a difference of 55.3%.
| Sex | Number | Average Earnings |
| Male | 1,783 (34.3%) | $10,574 |
| Female | 3,419 (65.7%) | $4,730 |
| Total | 5,202 (100.0%) | $5,766 |
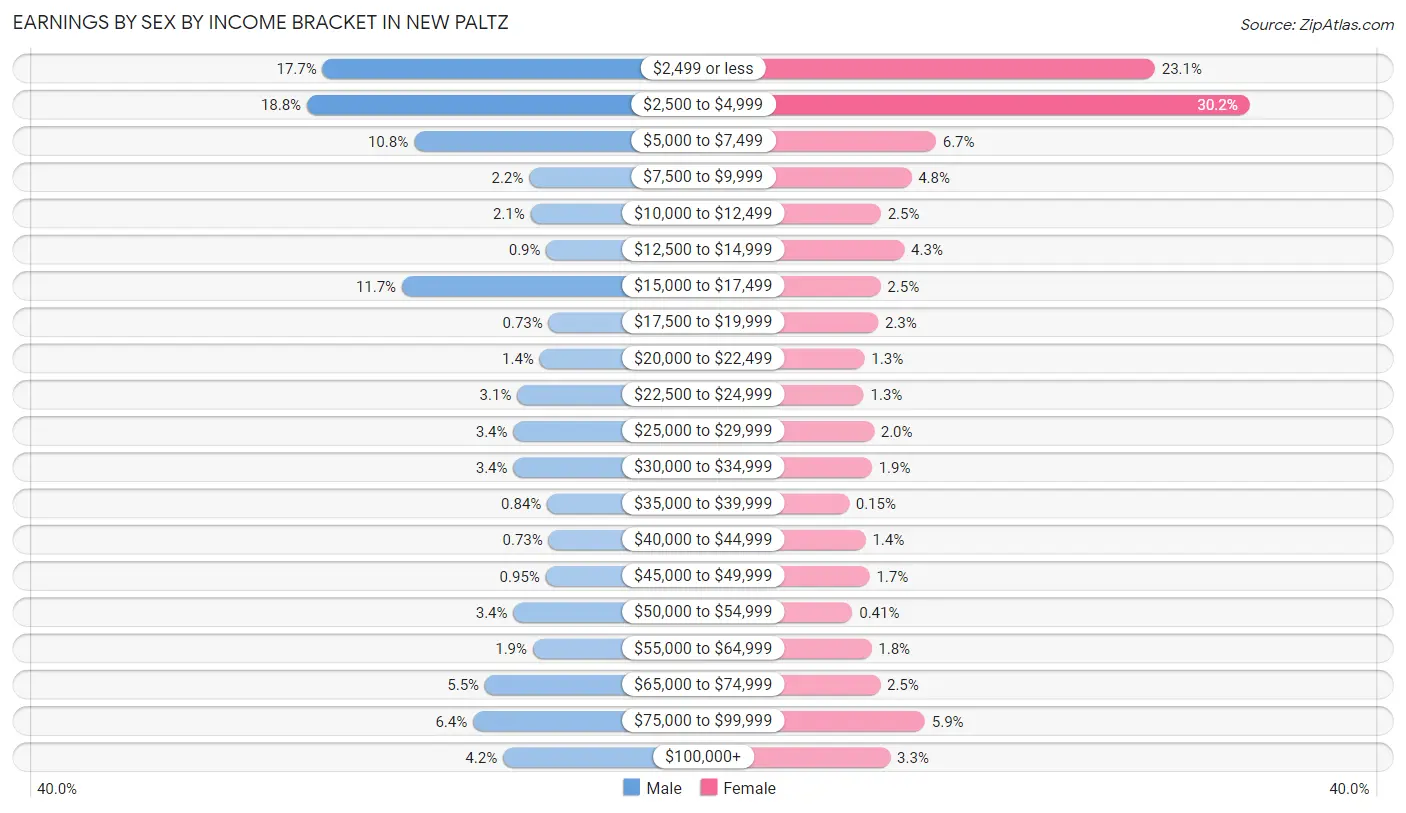
Earnings by Sex by Income Bracket in New Paltz
The most common earnings brackets in New Paltz are $2,500 to $4,999 for men (336 | 18.8%) and $2,500 to $4,999 for women (1,032 | 30.2%).
| Income | Male | Female |
| $2,499 or less | 315 (17.7%) | 789 (23.1%) |
| $2,500 to $4,999 | 336 (18.8%) | 1,032 (30.2%) |
| $5,000 to $7,499 | 193 (10.8%) | 228 (6.7%) |
| $7,500 to $9,999 | 39 (2.2%) | 165 (4.8%) |
| $10,000 to $12,499 | 37 (2.1%) | 87 (2.5%) |
| $12,500 to $14,999 | 16 (0.9%) | 147 (4.3%) |
| $15,000 to $17,499 | 209 (11.7%) | 86 (2.5%) |
| $17,500 to $19,999 | 13 (0.7%) | 80 (2.3%) |
| $20,000 to $22,499 | 25 (1.4%) | 45 (1.3%) |
| $22,500 to $24,999 | 55 (3.1%) | 43 (1.3%) |
| $25,000 to $29,999 | 60 (3.4%) | 69 (2.0%) |
| $30,000 to $34,999 | 60 (3.4%) | 64 (1.9%) |
| $35,000 to $39,999 | 15 (0.8%) | 5 (0.2%) |
| $40,000 to $44,999 | 13 (0.7%) | 48 (1.4%) |
| $45,000 to $49,999 | 17 (0.9%) | 58 (1.7%) |
| $50,000 to $54,999 | 60 (3.4%) | 14 (0.4%) |
| $55,000 to $64,999 | 34 (1.9%) | 63 (1.8%) |
| $65,000 to $74,999 | 98 (5.5%) | 85 (2.5%) |
| $75,000 to $99,999 | 114 (6.4%) | 200 (5.9%) |
| $100,000+ | 74 (4.2%) | 111 (3.3%) |
| Total | 1,783 (100.0%) | 3,419 (100.0%) |
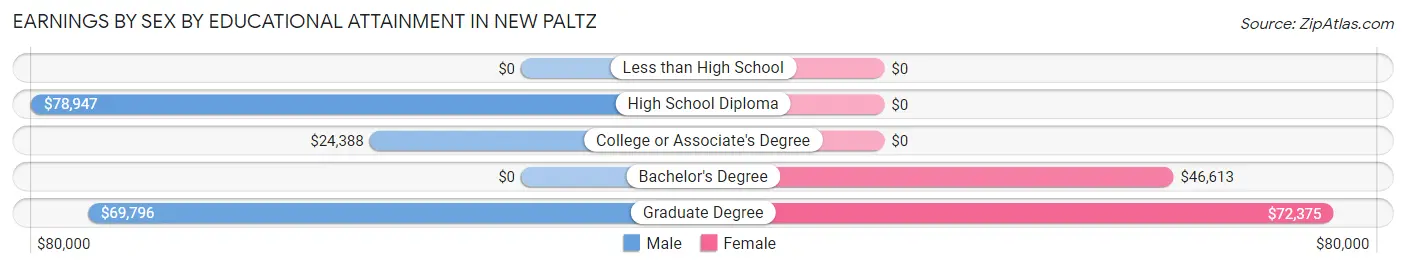
Earnings by Sex by Educational Attainment in New Paltz
Average earnings in New Paltz are $53,659 for men and $61,691 for women, a difference of 13.0%. Men with an educational attainment of high school diploma enjoy the highest average annual earnings of $78,947, while those with college or associate's degree education earn the least with $24,388. Women with an educational attainment of graduate degree earn the most with the average annual earnings of $72,375, while those with bachelor's degree education have the smallest earnings of $46,613.
| Educational Attainment | Male Income | Female Income |
| Less than High School | - | - |
| High School Diploma | $78,947 | $0 |
| College or Associate's Degree | $24,388 | $0 |
| Bachelor's Degree | - | - |
| Graduate Degree | $69,796 | $72,375 |
| Total | $53,659 | $61,691 |
Family Income in New Paltz
Family Income Brackets in New Paltz
According to the New Paltz family income data, there are 169 families falling into the $100,000 to $149,999 income range, which is the most common income bracket and makes up 24.6% of all families.
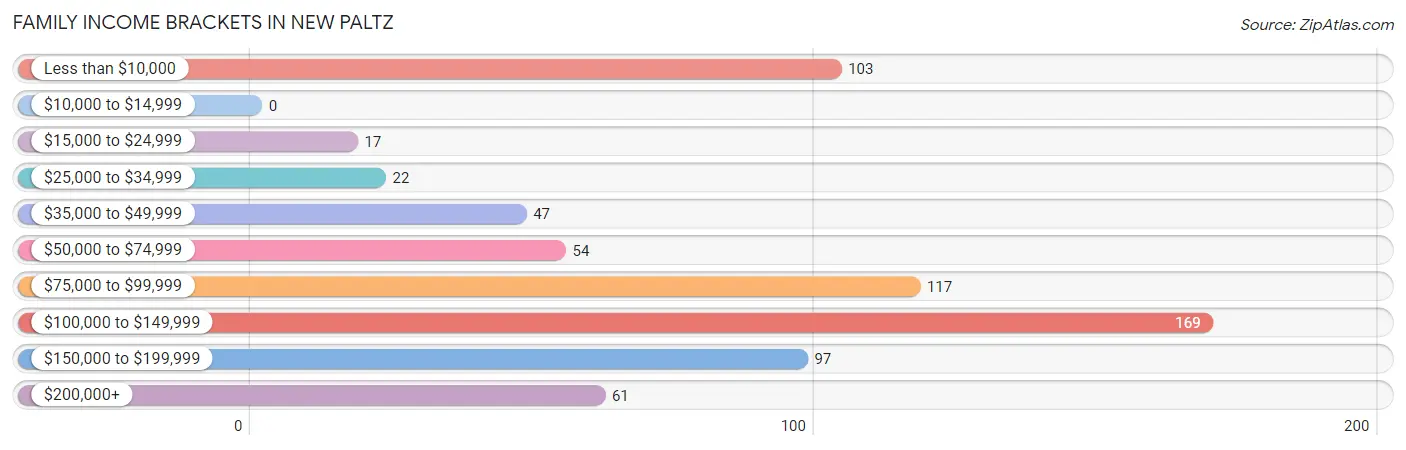
| Income Bracket | # Families | % Families |
| Less than $10,000 | 103 | 15.0% |
| $10,000 to $14,999 | 0 | 0.0% |
| $15,000 to $24,999 | 17 | 2.5% |
| $25,000 to $34,999 | 22 | 3.2% |
| $35,000 to $49,999 | 47 | 6.8% |
| $50,000 to $74,999 | 54 | 7.9% |
| $75,000 to $99,999 | 117 | 17.0% |
| $100,000 to $149,999 | 169 | 24.6% |
| $150,000 to $199,999 | 97 | 14.1% |
| $200,000+ | 61 | 8.9% |
Family Income by Famaliy Size in New Paltz
4-person families (84 | 12.2%) account for the highest median family income in New Paltz with $123,667 per family, while 2-person families (460 | 67.0%) have the highest median income of $39,802 per family member.
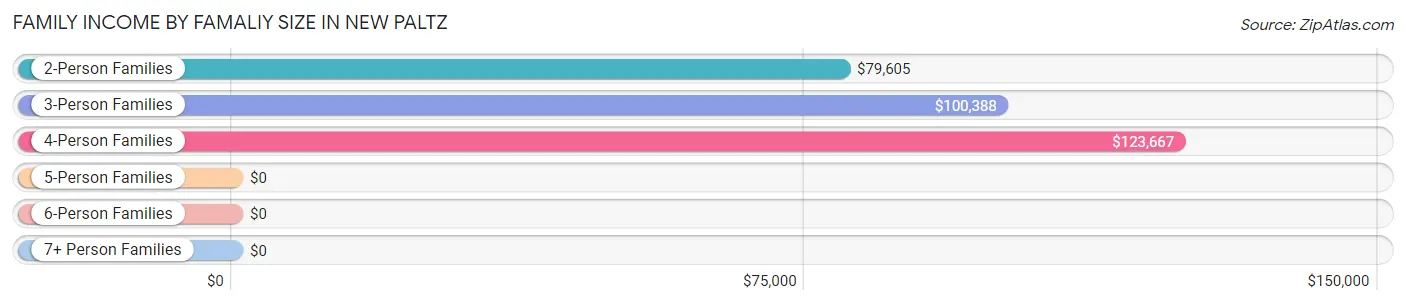
| Income Bracket | # Families | Median Income |
| 2-Person Families | 460 (67.0%) | $79,605 |
| 3-Person Families | 111 (16.2%) | $100,388 |
| 4-Person Families | 84 (12.2%) | $123,667 |
| 5-Person Families | 12 (1.8%) | $0 |
| 6-Person Families | 6 (0.9%) | $0 |
| 7+ Person Families | 14 (2.0%) | $0 |
| Total | 687 (100.0%) | $87,401 |
Family Income by Number of Earners in New Paltz
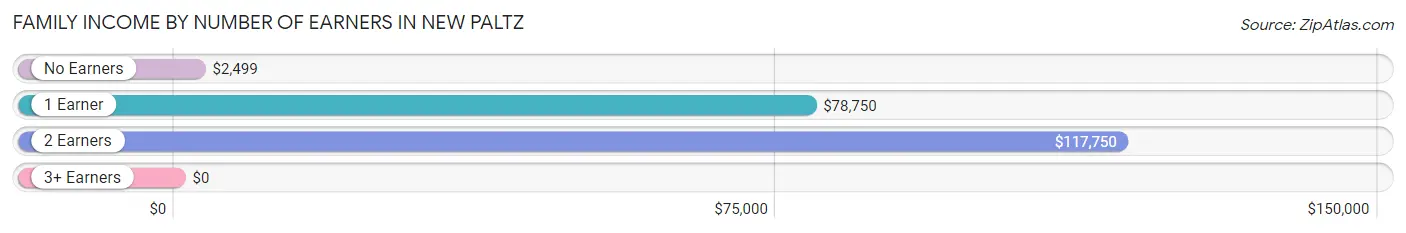
| Number of Earners | # Families | Median Income |
| No Earners | 163 (23.7%) | $2,499 |
| 1 Earner | 200 (29.1%) | $78,750 |
| 2 Earners | 297 (43.2%) | $117,750 |
| 3+ Earners | 27 (3.9%) | $0 |
| Total | 687 (100.0%) | $87,401 |
Household Income in New Paltz
Household Income Brackets in New Paltz
With 398 households falling in the category, the $100,000 to $149,999 income range is the most frequent in New Paltz, accounting for 17.9% of all households. In contrast, only 80 households (3.6%) fall into the $10,000 to $14,999 income bracket, making it the least populous group.
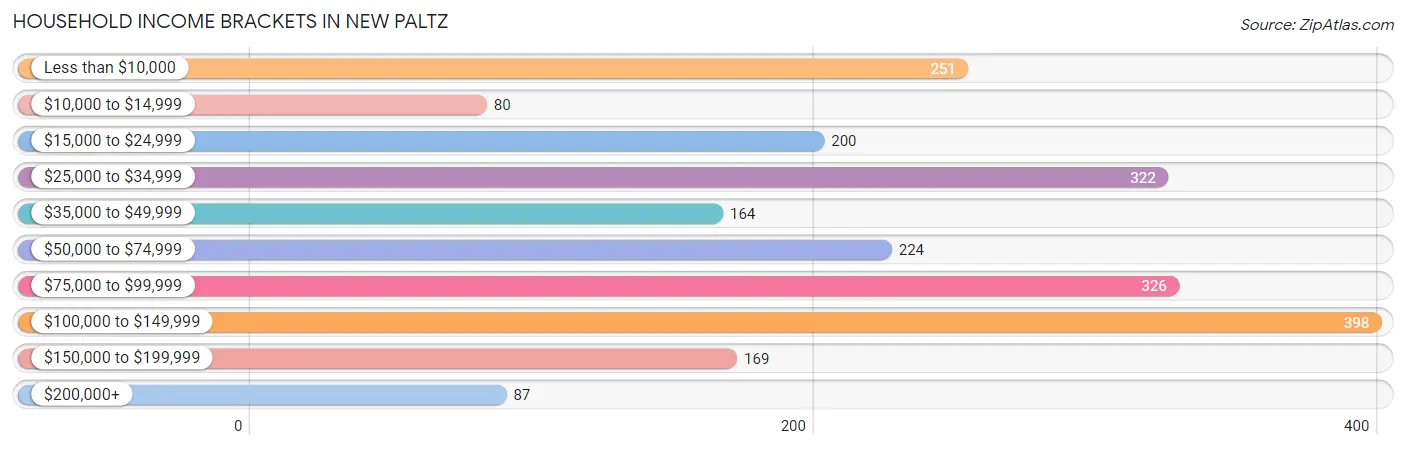
| Income Bracket | # Households | % Households |
| Less than $10,000 | 251 | 11.3% |
| $10,000 to $14,999 | 80 | 3.6% |
| $15,000 to $24,999 | 200 | 9.0% |
| $25,000 to $34,999 | 322 | 14.5% |
| $35,000 to $49,999 | 164 | 7.4% |
| $50,000 to $74,999 | 224 | 10.1% |
| $75,000 to $99,999 | 326 | 14.7% |
| $100,000 to $149,999 | 398 | 17.9% |
| $150,000 to $199,999 | 169 | 7.6% |
| $200,000+ | 87 | 3.9% |
Household Income by Householder Age in New Paltz
The median household income in New Paltz is $59,779, with the highest median household income of $95,410 found in the 65+ years age bracket for the primary householder. A total of 642 households (28.9%) fall into this category. Meanwhile, the 15 to 24 years age bracket for the primary householder has the lowest median household income of $25,949, with 673 households (30.3%) in this group.
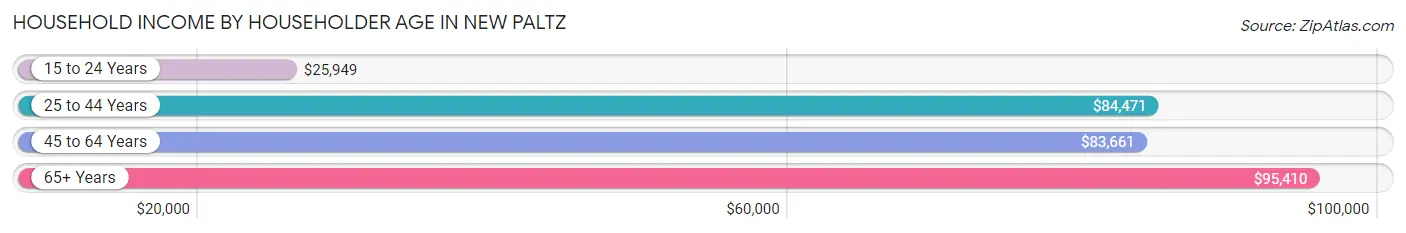
| Income Bracket | # Households | Median Income |
| 15 to 24 Years | 673 (30.3%) | $25,949 |
| 25 to 44 Years | 523 (23.5%) | $84,471 |
| 45 to 64 Years | 383 (17.2%) | $83,661 |
| 65+ Years | 642 (28.9%) | $95,410 |
| Total | 2,221 (100.0%) | $59,779 |
Poverty in New Paltz
Income Below Poverty by Sex and Age in New Paltz
With 23.0% poverty level for males and 47.1% for females among the residents of New Paltz, 18 to 24 year old males and 18 to 24 year old females are the most vulnerable to poverty, with 211 males (42.9%) and 1,240 females (79.4%) in their respective age groups living below the poverty level.
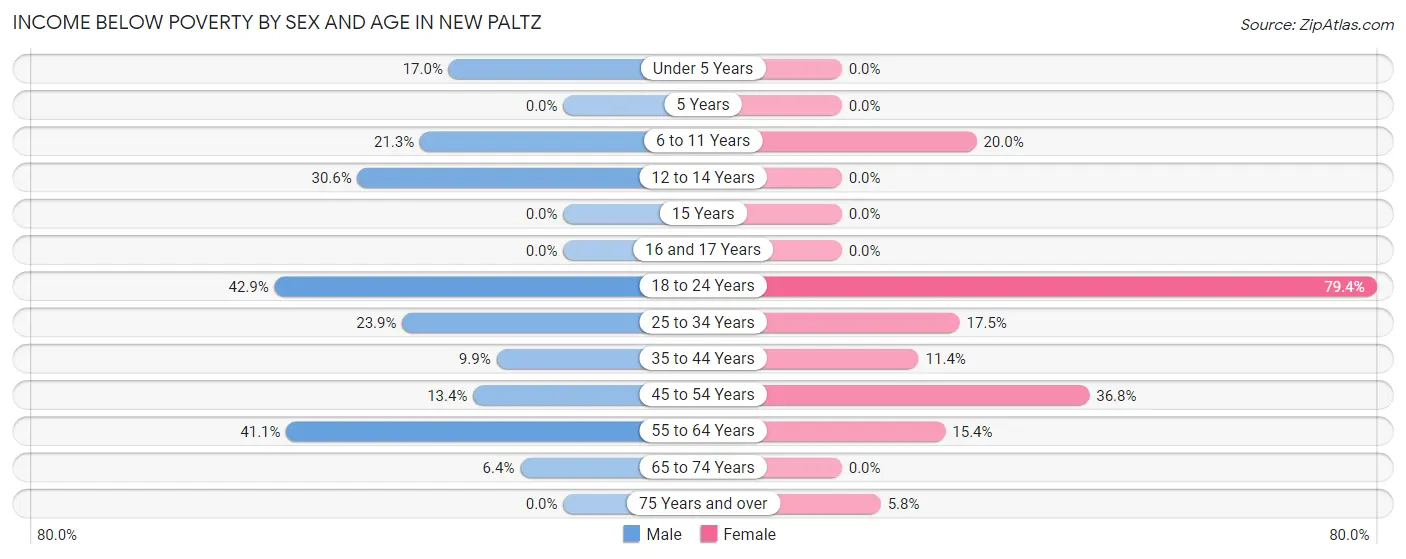
| Age Bracket | Male | Female |
| Under 5 Years | 8 (17.0%) | 0 (0.0%) |
| 5 Years | 0 (0.0%) | 0 (0.0%) |
| 6 to 11 Years | 30 (21.3%) | 13 (20.0%) |
| 12 to 14 Years | 11 (30.6%) | 0 (0.0%) |
| 15 Years | 0 (0.0%) | 0 (0.0%) |
| 16 and 17 Years | 0 (0.0%) | 0 (0.0%) |
| 18 to 24 Years | 211 (42.9%) | 1,240 (79.4%) |
| 25 to 34 Years | 72 (23.9%) | 56 (17.5%) |
| 35 to 44 Years | 14 (9.9%) | 17 (11.4%) |
| 45 to 54 Years | 21 (13.4%) | 86 (36.7%) |
| 55 to 64 Years | 58 (41.1%) | 14 (15.4%) |
| 65 to 74 Years | 13 (6.4%) | 0 (0.0%) |
| 75 Years and over | 0 (0.0%) | 16 (5.8%) |
| Total | 438 (23.0%) | 1,442 (47.1%) |
Income Above Poverty by Sex and Age in New Paltz
According to the poverty statistics in New Paltz, males aged 5 years and females aged under 5 years are the age groups that are most secure financially, with 100.0% of males and 100.0% of females in these age groups living above the poverty line.
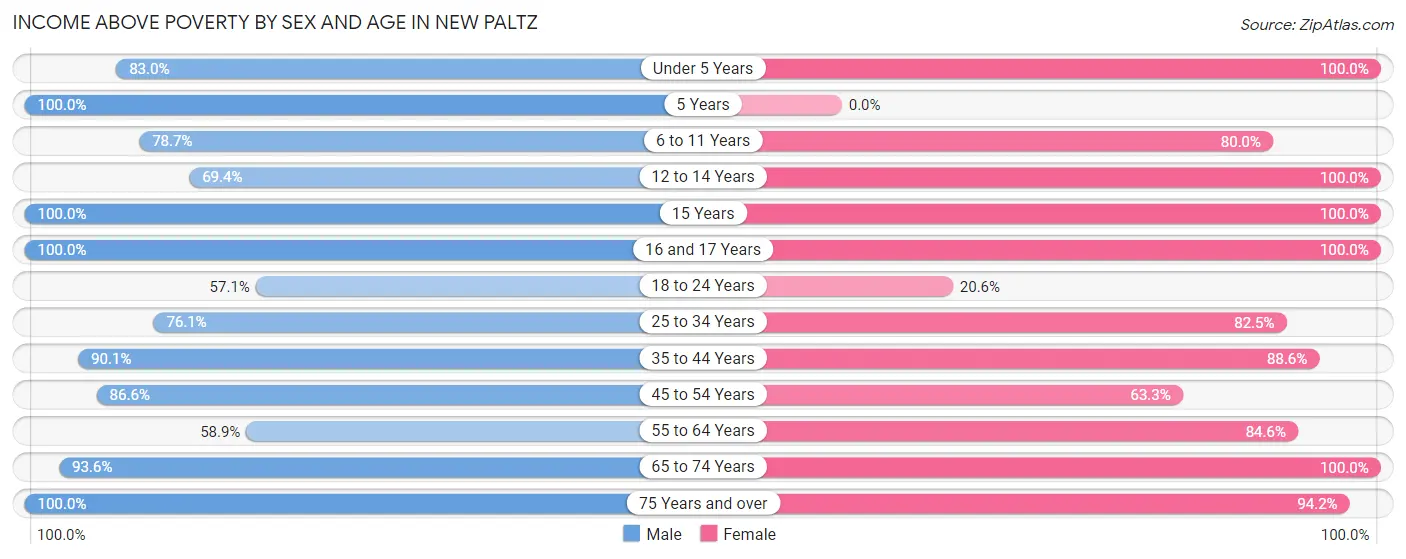
| Age Bracket | Male | Female |
| Under 5 Years | 39 (83.0%) | 81 (100.0%) |
| 5 Years | 10 (100.0%) | 0 (0.0%) |
| 6 to 11 Years | 111 (78.7%) | 52 (80.0%) |
| 12 to 14 Years | 25 (69.4%) | 59 (100.0%) |
| 15 Years | 17 (100.0%) | 14 (100.0%) |
| 16 and 17 Years | 15 (100.0%) | 59 (100.0%) |
| 18 to 24 Years | 281 (57.1%) | 322 (20.6%) |
| 25 to 34 Years | 229 (76.1%) | 264 (82.5%) |
| 35 to 44 Years | 127 (90.1%) | 132 (88.6%) |
| 45 to 54 Years | 136 (86.6%) | 148 (63.2%) |
| 55 to 64 Years | 83 (58.9%) | 77 (84.6%) |
| 65 to 74 Years | 190 (93.6%) | 152 (100.0%) |
| 75 Years and over | 205 (100.0%) | 261 (94.2%) |
| Total | 1,468 (77.0%) | 1,621 (52.9%) |
Income Below Poverty Among Married-Couple Families in New Paltz
The poverty statistics for married-couple families in New Paltz show that 13.3% or 59 of the total 444 families live below the poverty line. Families with 3 or 4 children have the highest poverty rate of 100.0%, comprising of 6 families. On the other hand, families with 5 or more children have the lowest poverty rate of 0.0%, which includes 0 families.
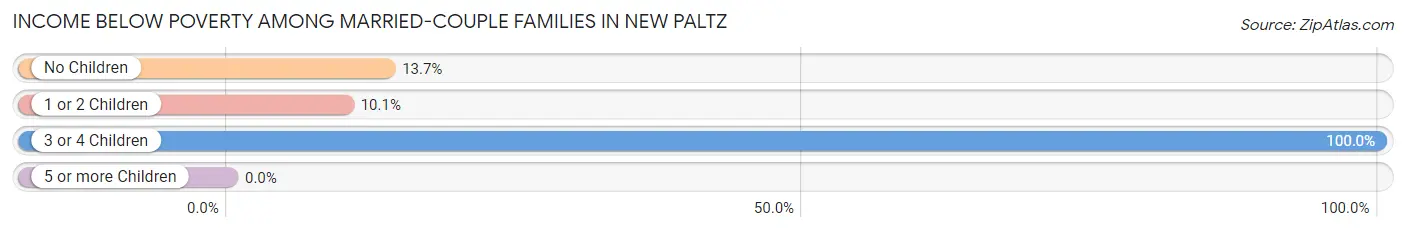
| Children | Above Poverty | Below Poverty |
| No Children | 246 (86.3%) | 39 (13.7%) |
| 1 or 2 Children | 125 (89.9%) | 14 (10.1%) |
| 3 or 4 Children | 0 (0.0%) | 6 (100.0%) |
| 5 or more Children | 14 (100.0%) | 0 (0.0%) |
| Total | 385 (86.7%) | 59 (13.3%) |
Income Below Poverty Among Single-Parent Households in New Paltz
According to the poverty data in New Paltz, 25.4% or 17 single-father households and 28.4% or 50 single-mother households are living below the poverty line. Among single-father households, those with 1 or 2 children have the highest poverty rate, with 17 households (25.8%) experiencing poverty. Likewise, among single-mother households, those with no children have the highest poverty rate, with 50 households (55.6%) falling below the poverty line.
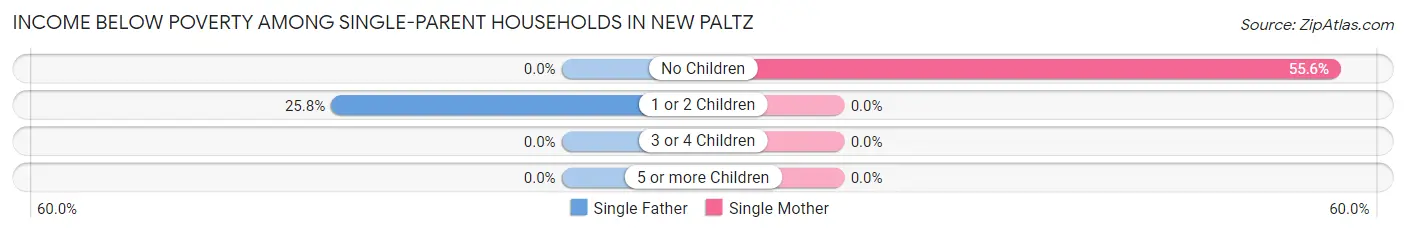
| Children | Single Father | Single Mother |
| No Children | 0 (0.0%) | 50 (55.6%) |
| 1 or 2 Children | 17 (25.8%) | 0 (0.0%) |
| 3 or 4 Children | 0 (0.0%) | 0 (0.0%) |
| 5 or more Children | 0 (0.0%) | 0 (0.0%) |
| Total | 17 (25.4%) | 50 (28.4%) |
Income Below Poverty Among Married-Couple vs Single-Parent Households in New Paltz
The poverty data for New Paltz shows that 59 of the married-couple family households (13.3%) and 67 of the single-parent households (27.6%) are living below the poverty level. Within the married-couple family households, those with 3 or 4 children have the highest poverty rate, with 6 households (100.0%) falling below the poverty line. Among the single-parent households, those with no children have the highest poverty rate, with 50 household (54.9%) living below poverty.
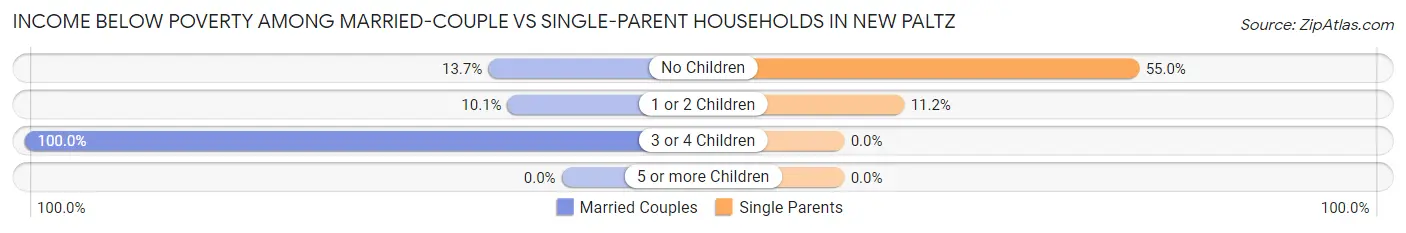
| Children | Married-Couple Families | Single-Parent Households |
| No Children | 39 (13.7%) | 50 (54.9%) |
| 1 or 2 Children | 14 (10.1%) | 17 (11.2%) |
| 3 or 4 Children | 6 (100.0%) | 0 (0.0%) |
| 5 or more Children | 0 (0.0%) | 0 (0.0%) |
| Total | 59 (13.3%) | 67 (27.6%) |
Race in New Paltz
The most populous races in New Paltz are White / Caucasian (5,655 | 73.1%), Hispanic or Latino (1,129 | 14.6%), and Black / African American (674 | 8.7%).
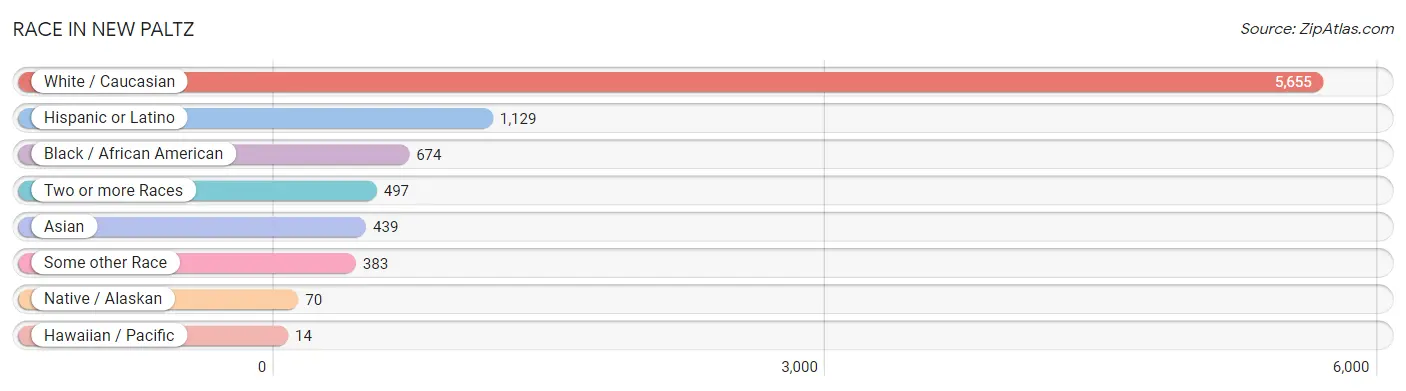
| Race | # Population | % Population |
| Asian | 439 | 5.7% |
| Black / African American | 674 | 8.7% |
| Hawaiian / Pacific | 14 | 0.2% |
| Hispanic or Latino | 1,129 | 14.6% |
| Native / Alaskan | 70 | 0.9% |
| White / Caucasian | 5,655 | 73.1% |
| Two or more Races | 497 | 6.4% |
| Some other Race | 383 | 5.0% |
| Total | 7,732 | 100.0% |
Ancestry in New Paltz
The most populous ancestries reported in New Paltz are Irish (1,568 | 20.3%), Italian (1,116 | 14.4%), German (941 | 12.2%), American (471 | 6.1%), and English (347 | 4.5%), together accounting for 57.5% of all New Paltz residents.
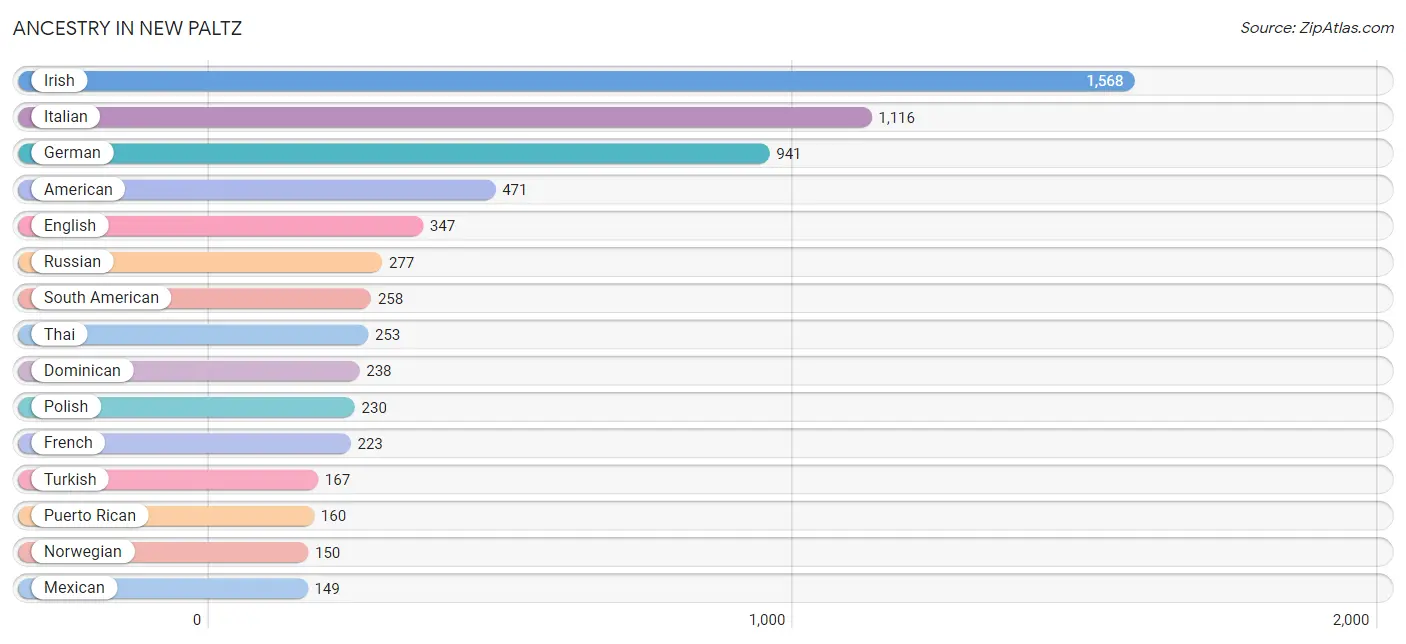
| Ancestry | # Population | % Population |
| American | 471 | 6.1% |
| Arab | 56 | 0.7% |
| Argentinean | 12 | 0.2% |
| Austrian | 64 | 0.8% |
| Belgian | 15 | 0.2% |
| Bhutanese | 26 | 0.3% |
| Blackfeet | 8 | 0.1% |
| Bolivian | 8 | 0.1% |
| Brazilian | 15 | 0.2% |
| British | 58 | 0.7% |
| Burmese | 32 | 0.4% |
| Cajun | 112 | 1.5% |
| Canadian | 16 | 0.2% |
| Central American | 82 | 1.1% |
| Central American Indian | 55 | 0.7% |
| Cherokee | 11 | 0.1% |
| Costa Rican | 26 | 0.3% |
| Cuban | 58 | 0.7% |
| Cypriot | 5 | 0.1% |
| Czech | 5 | 0.1% |
| Danish | 55 | 0.7% |
| Dominican | 238 | 3.1% |
| Dutch | 60 | 0.8% |
| Eastern European | 80 | 1.0% |
| Ecuadorian | 114 | 1.5% |
| English | 347 | 4.5% |
| European | 34 | 0.4% |
| Finnish | 10 | 0.1% |
| French | 223 | 2.9% |
| French Canadian | 98 | 1.3% |
| German | 941 | 12.2% |
| Greek | 134 | 1.7% |
| Guatemalan | 9 | 0.1% |
| Haitian | 73 | 0.9% |
| Hungarian | 60 | 0.8% |
| Indian (Asian) | 110 | 1.4% |
| Irish | 1,568 | 20.3% |
| Iroquois | 25 | 0.3% |
| Israeli | 34 | 0.4% |
| Italian | 1,116 | 14.4% |
| Jamaican | 73 | 0.9% |
| Korean | 30 | 0.4% |
| Lebanese | 27 | 0.4% |
| Mexican | 149 | 1.9% |
| Native Hawaiian | 14 | 0.2% |
| Northern European | 24 | 0.3% |
| Norwegian | 150 | 1.9% |
| Okinawan | 22 | 0.3% |
| Pakistani | 32 | 0.4% |
| Peruvian | 124 | 1.6% |
| Polish | 230 | 3.0% |
| Portuguese | 10 | 0.1% |
| Puerto Rican | 160 | 2.1% |
| Russian | 277 | 3.6% |
| Salvadoran | 47 | 0.6% |
| Samoan | 29 | 0.4% |
| Scotch-Irish | 18 | 0.2% |
| Scottish | 106 | 1.4% |
| Serbian | 22 | 0.3% |
| South American | 258 | 3.3% |
| South American Indian | 55 | 0.7% |
| Spaniard | 129 | 1.7% |
| Swedish | 114 | 1.5% |
| Swiss | 16 | 0.2% |
| Syrian | 29 | 0.4% |
| Thai | 253 | 3.3% |
| Trinidadian and Tobagonian | 6 | 0.1% |
| Turkish | 167 | 2.2% |
| Ukrainian | 48 | 0.6% |
| Vietnamese | 6 | 0.1% |
| Welsh | 21 | 0.3% |
| West Indian | 6 | 0.1% | View All 72 Rows |
Immigrants in New Paltz
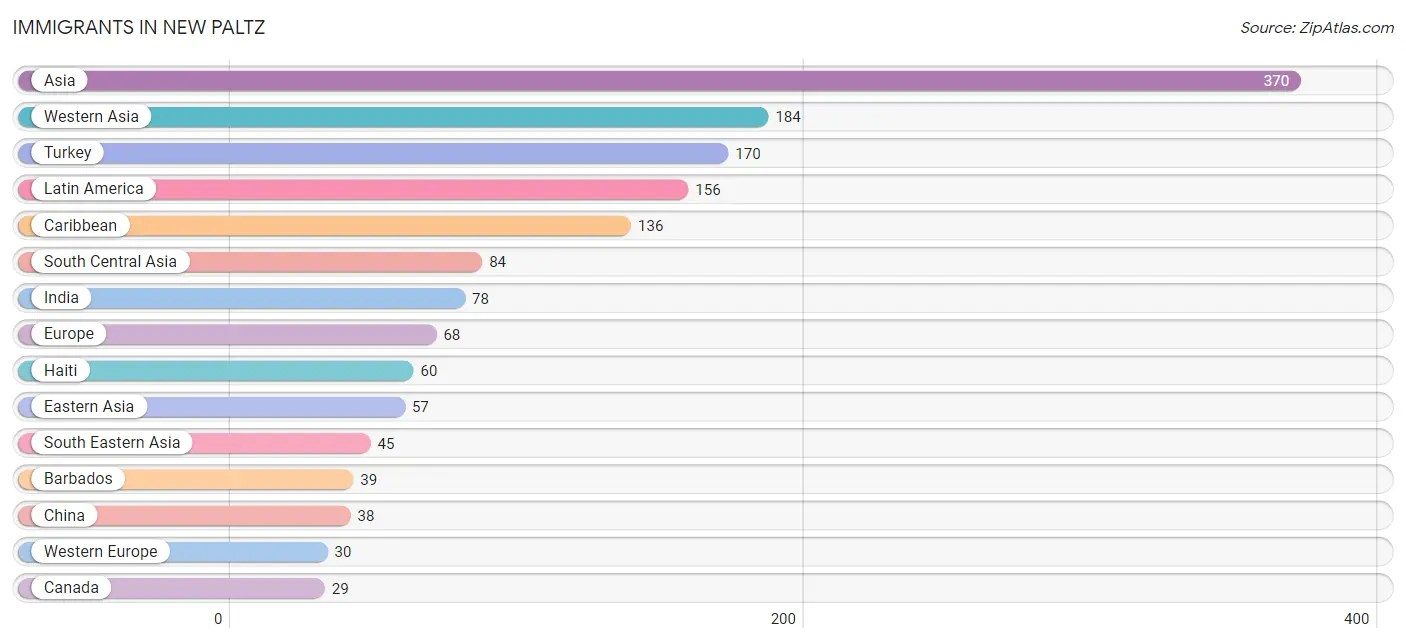
The most numerous immigrant groups reported in New Paltz came from Asia (370 | 4.8%), Western Asia (184 | 2.4%), Turkey (170 | 2.2%), Latin America (156 | 2.0%), and Caribbean (136 | 1.8%), together accounting for 13.2% of all New Paltz residents.
| Immigration Origin | # Population | % Population |
| Asia | 370 | 4.8% |
| Barbados | 39 | 0.5% |
| Belgium | 10 | 0.1% |
| Bolivia | 8 | 0.1% |
| Canada | 29 | 0.4% |
| Caribbean | 136 | 1.8% |
| Central America | 12 | 0.2% |
| China | 38 | 0.5% |
| Cuba | 16 | 0.2% |
| Dominican Republic | 21 | 0.3% |
| Eastern Asia | 57 | 0.7% |
| England | 5 | 0.1% |
| Europe | 68 | 0.9% |
| Germany | 3 | 0.0% |
| Guatemala | 1 | 0.0% |
| Haiti | 60 | 0.8% |
| India | 78 | 1.0% |
| Japan | 19 | 0.3% |
| Latin America | 156 | 2.0% |
| Mexico | 11 | 0.1% |
| Netherlands | 1 | 0.0% |
| Northern Europe | 23 | 0.3% |
| Philippines | 5 | 0.1% |
| Scotland | 4 | 0.1% |
| Singapore | 22 | 0.3% |
| South America | 8 | 0.1% |
| South Central Asia | 84 | 1.1% |
| South Eastern Asia | 45 | 0.6% |
| Southern Europe | 15 | 0.2% |
| Spain | 8 | 0.1% |
| Sri Lanka | 6 | 0.1% |
| Switzerland | 16 | 0.2% |
| Turkey | 170 | 2.2% |
| Western Asia | 184 | 2.4% |
| Western Europe | 30 | 0.4% | View All 35 Rows |
Sex and Age in New Paltz
Sex and Age in New Paltz
The most populous age groups in New Paltz are 20 to 24 Years (1,161 | 39.6%) for men and 20 to 24 Years (2,102 | 43.8%) for women.
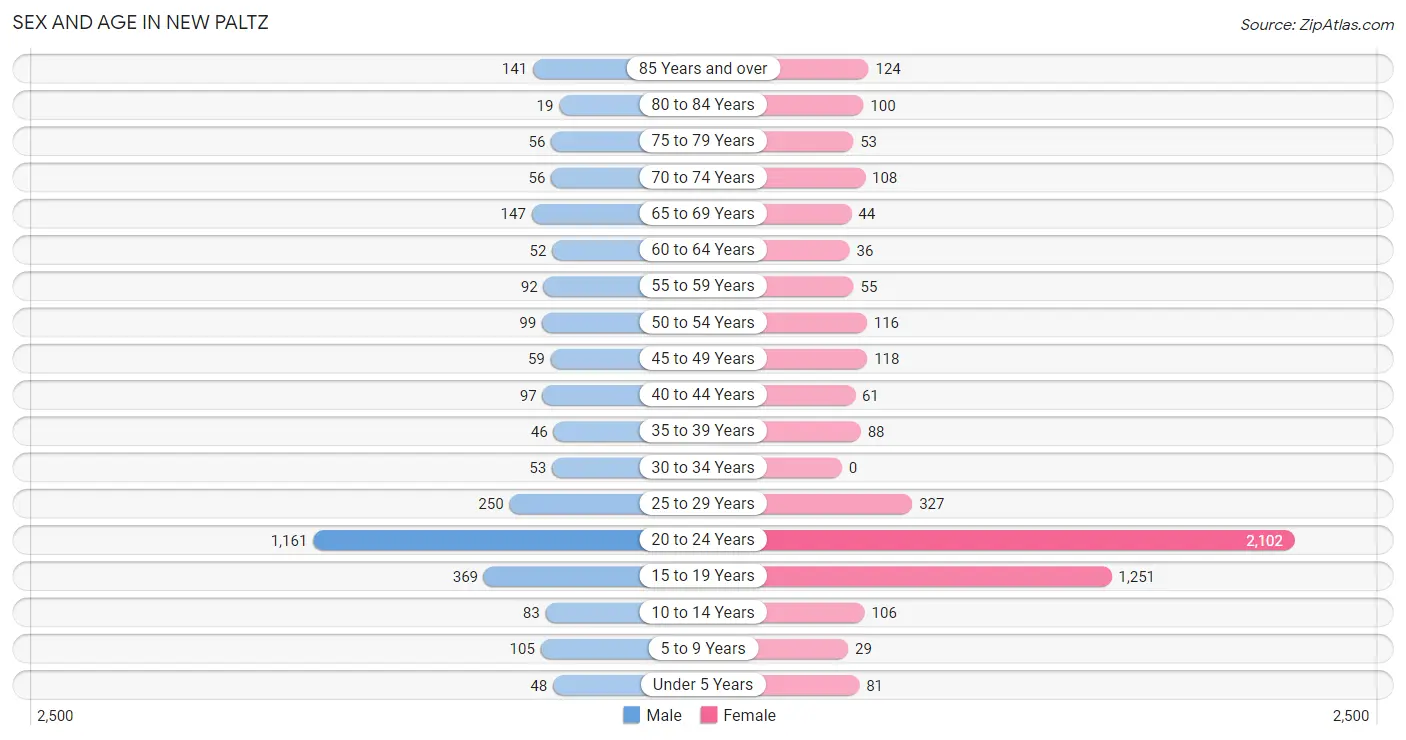
| Age Bracket | Male | Female |
| Under 5 Years | 48 (1.6%) | 81 (1.7%) |
| 5 to 9 Years | 105 (3.6%) | 29 (0.6%) |
| 10 to 14 Years | 83 (2.8%) | 106 (2.2%) |
| 15 to 19 Years | 369 (12.6%) | 1,251 (26.1%) |
| 20 to 24 Years | 1,161 (39.6%) | 2,102 (43.8%) |
| 25 to 29 Years | 250 (8.5%) | 327 (6.8%) |
| 30 to 34 Years | 53 (1.8%) | 0 (0.0%) |
| 35 to 39 Years | 46 (1.6%) | 88 (1.8%) |
| 40 to 44 Years | 97 (3.3%) | 61 (1.3%) |
| 45 to 49 Years | 59 (2.0%) | 118 (2.5%) |
| 50 to 54 Years | 99 (3.4%) | 116 (2.4%) |
| 55 to 59 Years | 92 (3.1%) | 55 (1.1%) |
| 60 to 64 Years | 52 (1.8%) | 36 (0.7%) |
| 65 to 69 Years | 147 (5.0%) | 44 (0.9%) |
| 70 to 74 Years | 56 (1.9%) | 108 (2.2%) |
| 75 to 79 Years | 56 (1.9%) | 53 (1.1%) |
| 80 to 84 Years | 19 (0.6%) | 100 (2.1%) |
| 85 Years and over | 141 (4.8%) | 124 (2.6%) |
| Total | 2,933 (100.0%) | 4,799 (100.0%) |
Families and Households in New Paltz
Median Family Size in New Paltz
The median family size in New Paltz is 2.74 persons per family, with married-couple families (444 | 64.6%) accounting for the largest median family size of 3.04 persons per family. On the other hand, single female/mother families (176 | 25.6%) represent the smallest median family size with 2.16 persons per family.
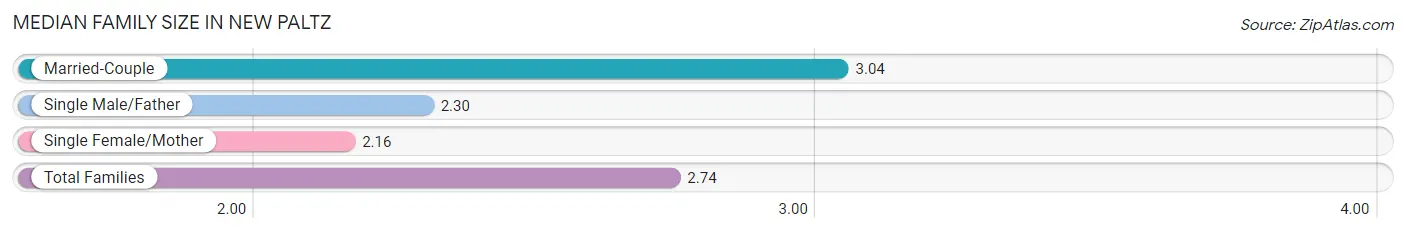
| Family Type | # Families | Family Size |
| Married-Couple | 444 (64.6%) | 3.04 |
| Single Male/Father | 67 (9.8%) | 2.30 |
| Single Female/Mother | 176 (25.6%) | 2.16 |
| Total Families | 687 (100.0%) | 2.74 |
Median Household Size in New Paltz
The median household size in New Paltz is 2.21 persons per household, with married-couple households (444 | 20.0%) accounting for the largest median household size of 3.08 persons per household. non-family households (1,534 | 69.1%) represent the smallest median household size with 1.94 persons per household.
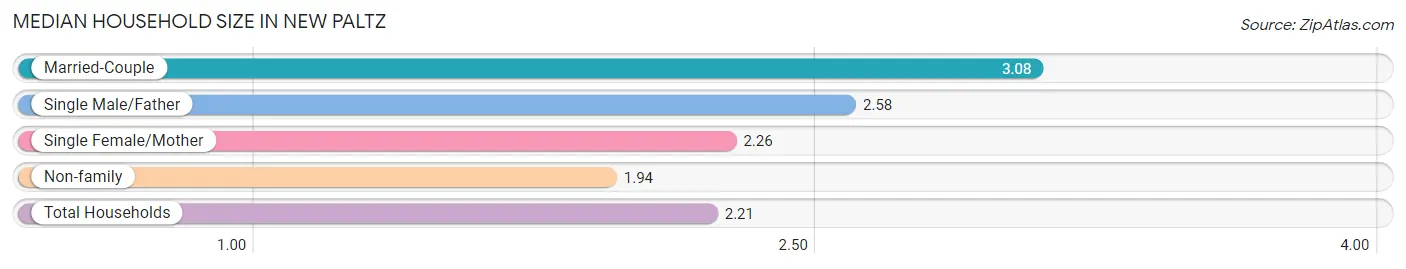
| Household Type | # Households | Household Size |
| Married-Couple | 444 (20.0%) | 3.08 |
| Single Male/Father | 67 (3.0%) | 2.58 |
| Single Female/Mother | 176 (7.9%) | 2.26 |
| Non-family | 1,534 (69.1%) | 1.94 |
| Total Households | 2,221 (100.0%) | 2.21 |
Household Size by Marriage Status in New Paltz
Out of a total of 2,221 households in New Paltz, 687 (30.9%) are family households, while 1,534 (69.1%) are nonfamily households. The most numerous type of family households are 2-person households, comprising 442, and the most common type of nonfamily households are 1-person households, comprising 957.
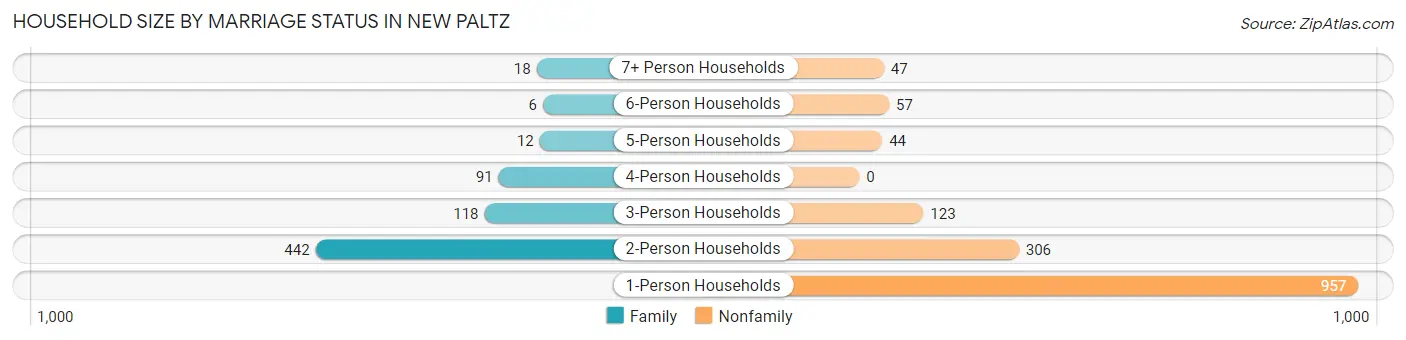
| Household Size | Family Households | Nonfamily Households |
| 1-Person Households | - | 957 (43.1%) |
| 2-Person Households | 442 (19.9%) | 306 (13.8%) |
| 3-Person Households | 118 (5.3%) | 123 (5.5%) |
| 4-Person Households | 91 (4.1%) | 0 (0.0%) |
| 5-Person Households | 12 (0.5%) | 44 (2.0%) |
| 6-Person Households | 6 (0.3%) | 57 (2.6%) |
| 7+ Person Households | 18 (0.8%) | 47 (2.1%) |
| Total | 687 (30.9%) | 1,534 (69.1%) |
Female Fertility in New Paltz
Fertility by Age in New Paltz
Average fertility rate in New Paltz is 7.0 births per 1,000 women. Women in the age bracket of 20 to 34 years have the highest fertility rate with 11.0 births per 1,000 women. Women in the age bracket of 20 to 34 years acount for 100.0% of all women with births.
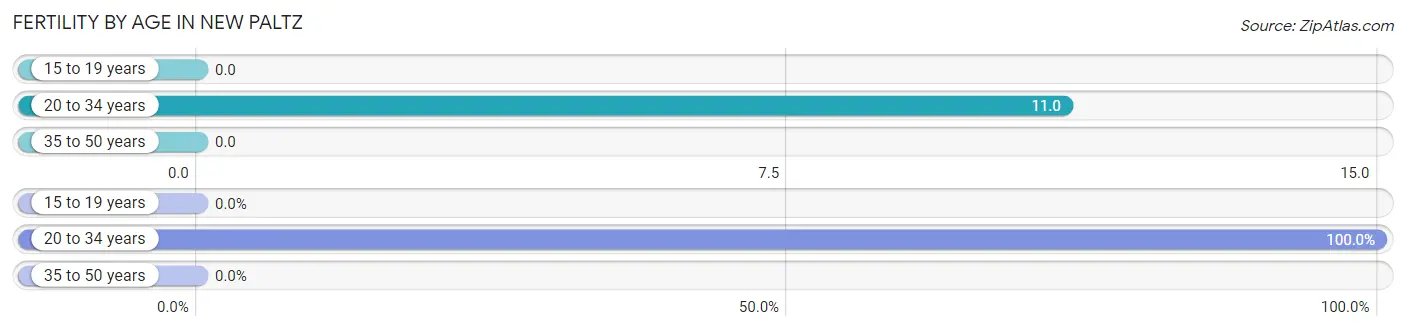
| Age Bracket | Women with Births | Births / 1,000 Women |
| 15 to 19 years | 0 (0.0%) | 0.0 |
| 20 to 34 years | 27 (100.0%) | 11.0 |
| 35 to 50 years | 0 (0.0%) | 0.0 |
| Total | 27 (100.0%) | 7.0 |
Fertility by Age by Marriage Status in New Paltz
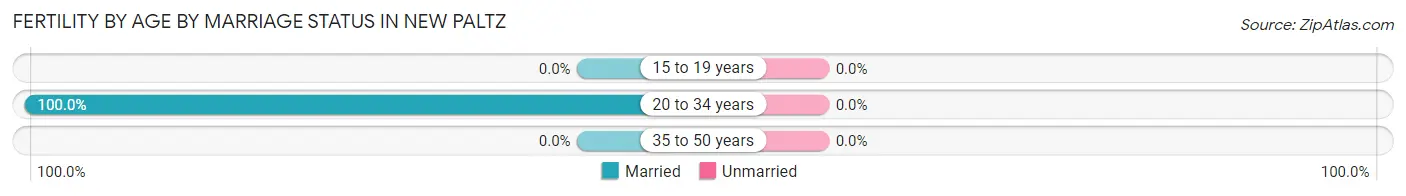
| Age Bracket | Married | Unmarried |
| 15 to 19 years | 0 (0.0%) | 0 (0.0%) |
| 20 to 34 years | 27 (100.0%) | 0 (0.0%) |
| 35 to 50 years | 0 (0.0%) | 0 (0.0%) |
| Total | 27 (100.0%) | 0 (0.0%) |
Fertility by Education in New Paltz
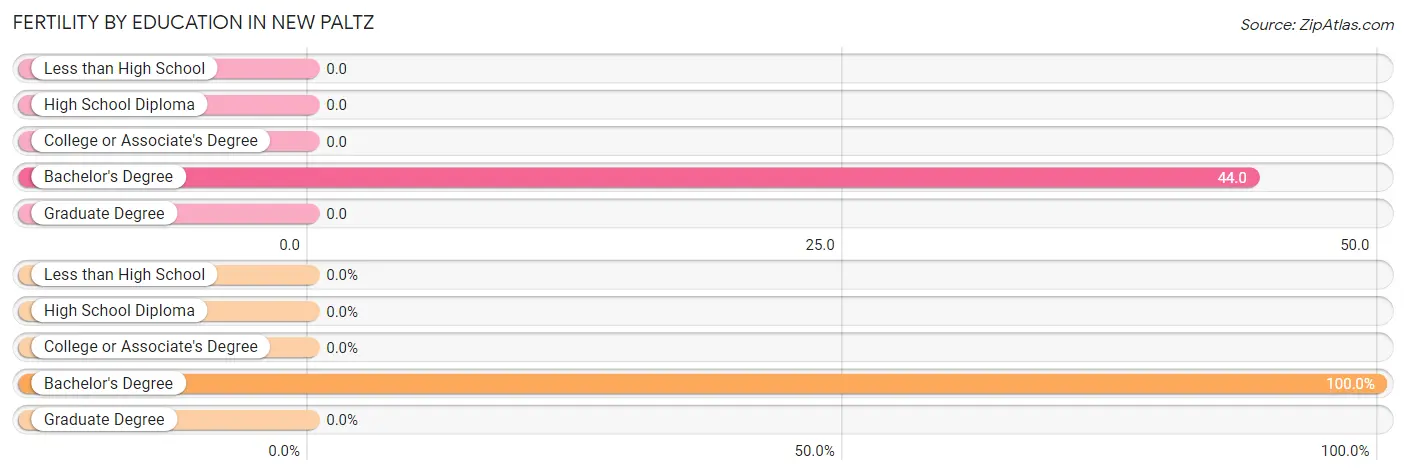
| Educational Attainment | Women with Births | Births / 1,000 Women |
| Less than High School | 0 (0.0%) | 0.0 |
| High School Diploma | 0 (0.0%) | 0.0 |
| College or Associate's Degree | 0 (0.0%) | 0.0 |
| Bachelor's Degree | 27 (100.0%) | 44.0 |
| Graduate Degree | 0 (0.0%) | 0.0 |
| Total | 27 (100.0%) | 7.0 |
Fertility by Education by Marriage Status in New Paltz
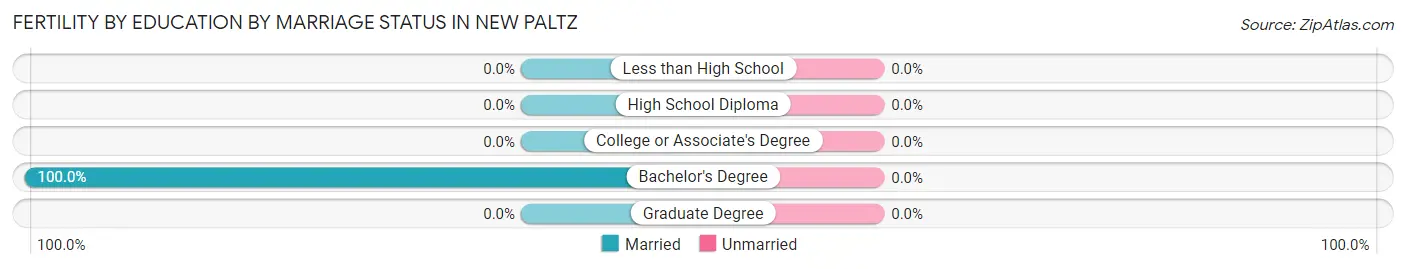
| Educational Attainment | Married | Unmarried |
| Less than High School | 0 (0.0%) | 0 (0.0%) |
| High School Diploma | 0 (0.0%) | 0 (0.0%) |
| College or Associate's Degree | 0 (0.0%) | 0 (0.0%) |
| Bachelor's Degree | 27 (100.0%) | 0 (0.0%) |
| Graduate Degree | 0 (0.0%) | 0 (0.0%) |
| Total | 27 (100.0%) | 0 (0.0%) |
Employment Characteristics in New Paltz
Employment by Class of Employer in New Paltz
Among the 3,015 employed individuals in New Paltz, private company employees (1,723 | 57.2%), not-for-profit organizations (493 | 16.4%), and state government employees (276 | 9.1%) make up the most common classes of employment.
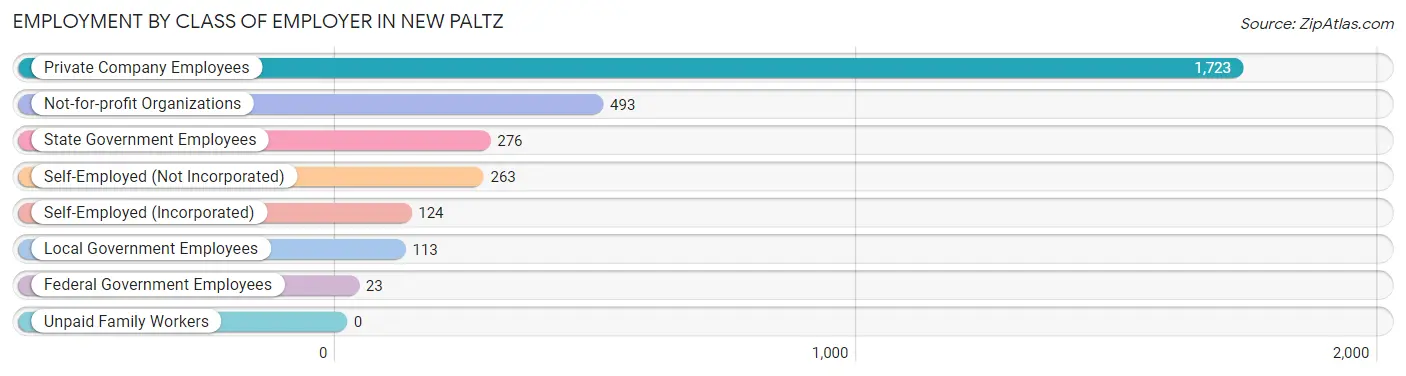
| Employer Class | # Employees | % Employees |
| Private Company Employees | 1,723 | 57.2% |
| Self-Employed (Incorporated) | 124 | 4.1% |
| Self-Employed (Not Incorporated) | 263 | 8.7% |
| Not-for-profit Organizations | 493 | 16.4% |
| Local Government Employees | 113 | 3.7% |
| State Government Employees | 276 | 9.1% |
| Federal Government Employees | 23 | 0.8% |
| Unpaid Family Workers | 0 | 0.0% |
| Total | 3,015 | 100.0% |
Employment Status by Age in New Paltz
According to the labor force statistics for New Paltz, out of the total population over 16 years of age (7,248), 48.5% or 3,515 individuals are in the labor force, with 9.2% or 323 of them unemployed. The age group with the highest labor force participation rate is 30 to 34 years, with 100.0% or 53 individuals in the labor force. Within the labor force, the 30 to 34 years age range has the highest percentage of unemployed individuals, with 24.5% or 13 of them being unemployed.
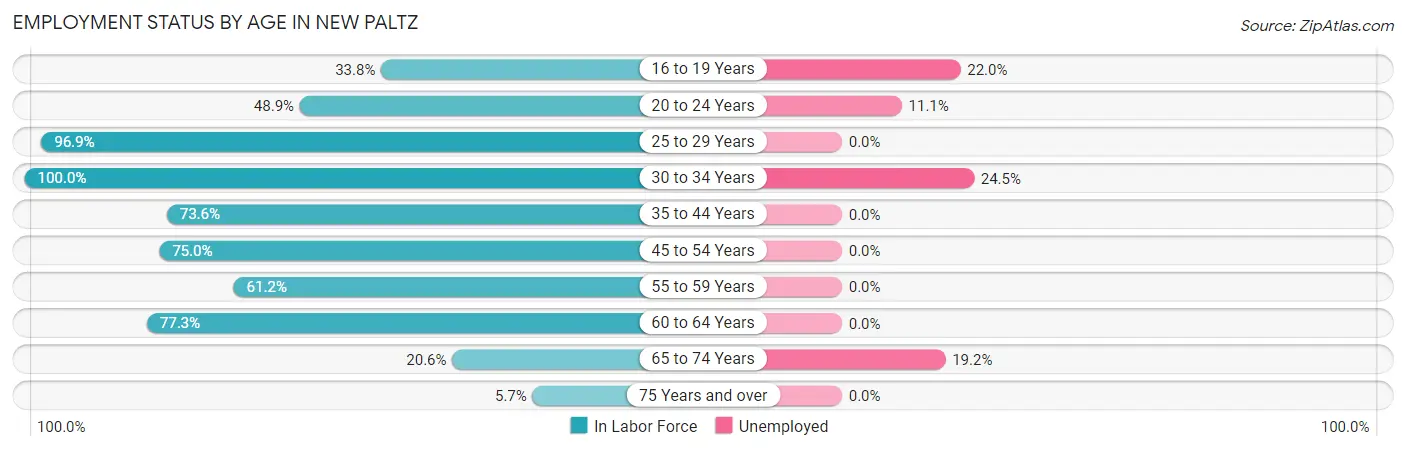
| Age Bracket | In Labor Force | Unemployed |
| 16 to 19 Years | 537 (33.8%) | 118 (22.0%) |
| 20 to 24 Years | 1,596 (48.9%) | 177 (11.1%) |
| 25 to 29 Years | 559 (96.9%) | 0 (0.0%) |
| 30 to 34 Years | 53 (100.0%) | 13 (24.5%) |
| 35 to 44 Years | 215 (73.6%) | 0 (0.0%) |
| 45 to 54 Years | 294 (75.0%) | 0 (0.0%) |
| 55 to 59 Years | 90 (61.2%) | 0 (0.0%) |
| 60 to 64 Years | 68 (77.3%) | 0 (0.0%) |
| 65 to 74 Years | 73 (20.6%) | 14 (19.2%) |
| 75 Years and over | 28 (5.7%) | 0 (0.0%) |
| Total | 3,515 (48.5%) | 323 (9.2%) |
Employment Status by Educational Attainment in New Paltz
According to labor force statistics for New Paltz, 82.6% of individuals (1,279) out of the total population between 25 and 64 years of age (1,549) are in the labor force, with 1.0% or 13 of them being unemployed. The group with the highest labor force participation rate are those with the educational attainment of bachelor's degree or higher, with 92.0% or 1,012 individuals in the labor force. Within the labor force, individuals with college / associate degree education have the highest percentage of unemployment, with 7.6% or 13 of them being unemployed.
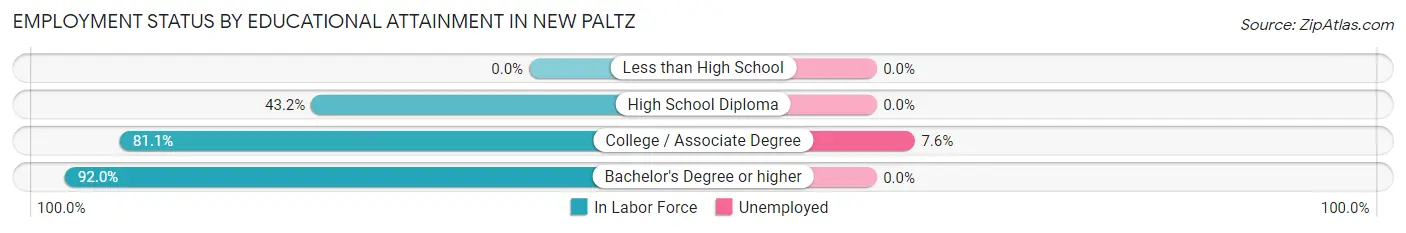
| Educational Attainment | In Labor Force | Unemployed |
| Less than High School | 0 (0.0%) | 0 (0.0%) |
| High School Diploma | 95 (43.2%) | 0 (0.0%) |
| College / Associate Degree | 172 (81.1%) | 16 (7.6%) |
| Bachelor's Degree or higher | 1,012 (92.0%) | 0 (0.0%) |
| Total | 1,279 (82.6%) | 15 (1.0%) |
Employment Occupations by Sex in New Paltz
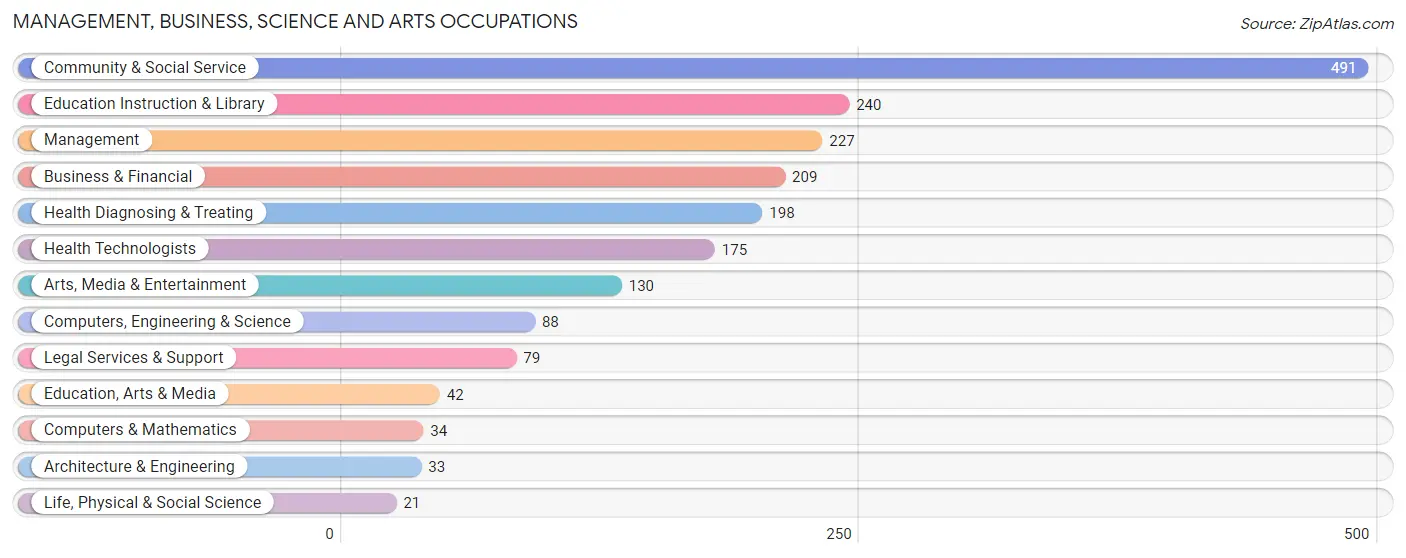
Management, Business, Science and Arts Occupations
The most common Management, Business, Science and Arts occupations in New Paltz are Community & Social Service (491 | 15.4%), Education Instruction & Library (240 | 7.5%), Management (227 | 7.1%), Business & Financial (209 | 6.6%), and Health Diagnosing & Treating (198 | 6.2%).
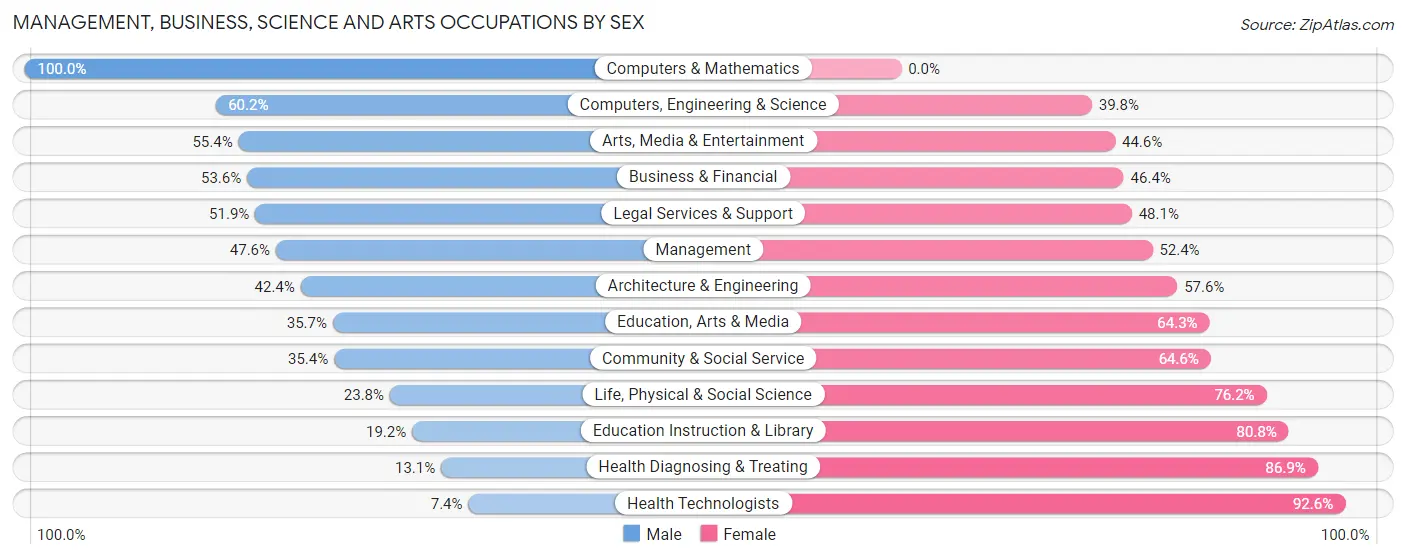
Management, Business, Science and Arts Occupations by Sex
Within the Management, Business, Science and Arts occupations in New Paltz, the most male-oriented occupations are Computers & Mathematics (100.0%), Computers, Engineering & Science (60.2%), and Arts, Media & Entertainment (55.4%), while the most female-oriented occupations are Health Technologists (92.6%), Health Diagnosing & Treating (86.9%), and Education Instruction & Library (80.8%).
| Occupation | Male | Female |
| Management | 108 (47.6%) | 119 (52.4%) |
| Business & Financial | 112 (53.6%) | 97 (46.4%) |
| Computers, Engineering & Science | 53 (60.2%) | 35 (39.8%) |
| Computers & Mathematics | 34 (100.0%) | 0 (0.0%) |
| Architecture & Engineering | 14 (42.4%) | 19 (57.6%) |
| Life, Physical & Social Science | 5 (23.8%) | 16 (76.2%) |
| Community & Social Service | 174 (35.4%) | 317 (64.6%) |
| Education, Arts & Media | 15 (35.7%) | 27 (64.3%) |
| Legal Services & Support | 41 (51.9%) | 38 (48.1%) |
| Education Instruction & Library | 46 (19.2%) | 194 (80.8%) |
| Arts, Media & Entertainment | 72 (55.4%) | 58 (44.6%) |
| Health Diagnosing & Treating | 26 (13.1%) | 172 (86.9%) |
| Health Technologists | 13 (7.4%) | 162 (92.6%) |
| Total (Category) | 473 (39.0%) | 740 (61.0%) |
| Total (Overall) | 1,067 (33.4%) | 2,124 (66.6%) |
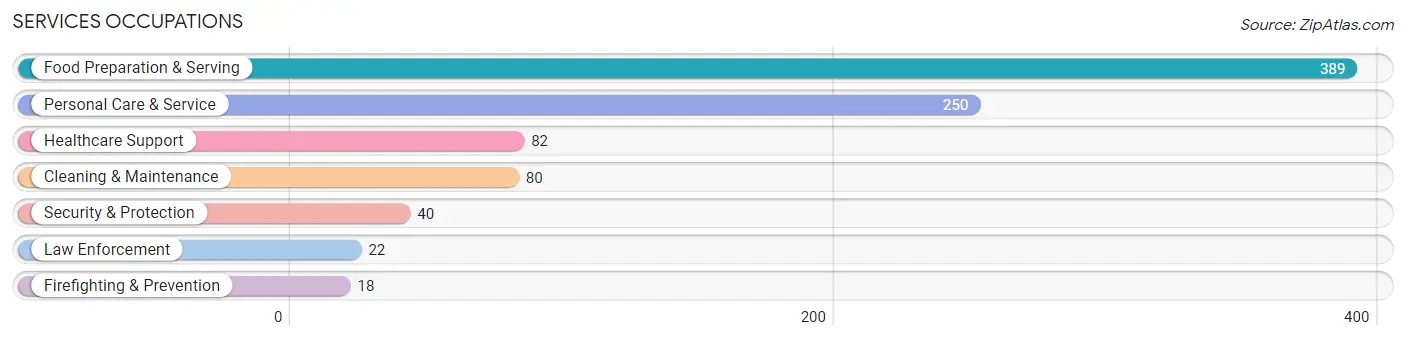
Services Occupations
The most common Services occupations in New Paltz are Food Preparation & Serving (389 | 12.2%), Personal Care & Service (250 | 7.8%), Healthcare Support (82 | 2.6%), Cleaning & Maintenance (80 | 2.5%), and Security & Protection (40 | 1.3%).
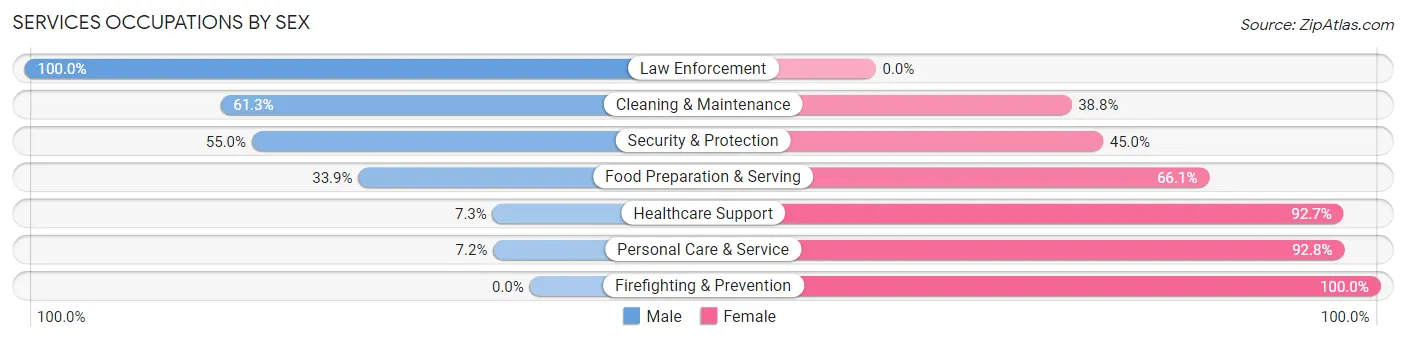
Services Occupations by Sex
Within the Services occupations in New Paltz, the most male-oriented occupations are Law Enforcement (100.0%), Cleaning & Maintenance (61.3%), and Security & Protection (55.0%), while the most female-oriented occupations are Firefighting & Prevention (100.0%), Personal Care & Service (92.8%), and Healthcare Support (92.7%).
| Occupation | Male | Female |
| Healthcare Support | 6 (7.3%) | 76 (92.7%) |
| Security & Protection | 22 (55.0%) | 18 (45.0%) |
| Firefighting & Prevention | 0 (0.0%) | 18 (100.0%) |
| Law Enforcement | 22 (100.0%) | 0 (0.0%) |
| Food Preparation & Serving | 132 (33.9%) | 257 (66.1%) |
| Cleaning & Maintenance | 49 (61.3%) | 31 (38.8%) |
| Personal Care & Service | 18 (7.2%) | 232 (92.8%) |
| Total (Category) | 227 (27.0%) | 614 (73.0%) |
| Total (Overall) | 1,067 (33.4%) | 2,124 (66.6%) |
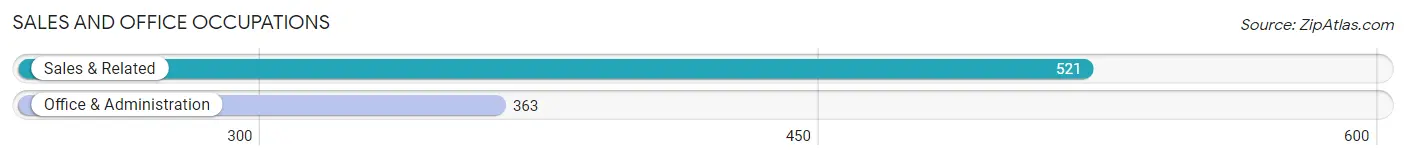
Sales and Office Occupations
The most common Sales and Office occupations in New Paltz are Sales & Related (521 | 16.3%), and Office & Administration (363 | 11.4%).
Sales and Office Occupations by Sex
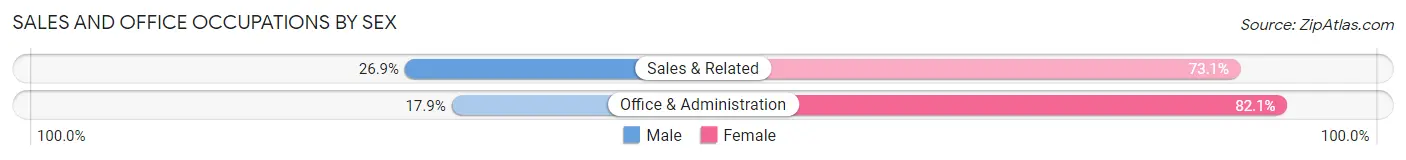
| Occupation | Male | Female |
| Sales & Related | 140 (26.9%) | 381 (73.1%) |
| Office & Administration | 65 (17.9%) | 298 (82.1%) |
| Total (Category) | 205 (23.2%) | 679 (76.8%) |
| Total (Overall) | 1,067 (33.4%) | 2,124 (66.6%) |
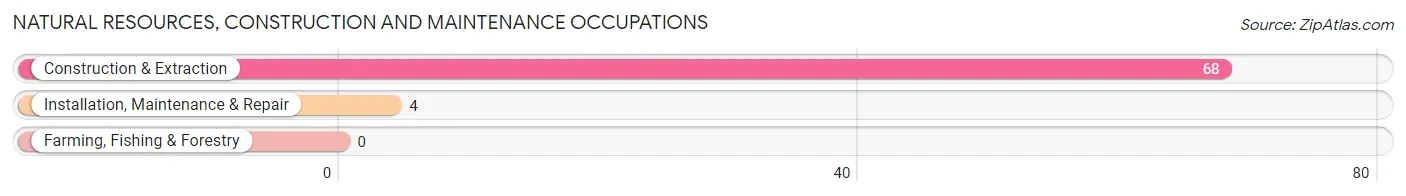
Natural Resources, Construction and Maintenance Occupations
The most common Natural Resources, Construction and Maintenance occupations in New Paltz are Construction & Extraction (68 | 2.1%), and Installation, Maintenance & Repair (4 | 0.1%).
Natural Resources, Construction and Maintenance Occupations by Sex
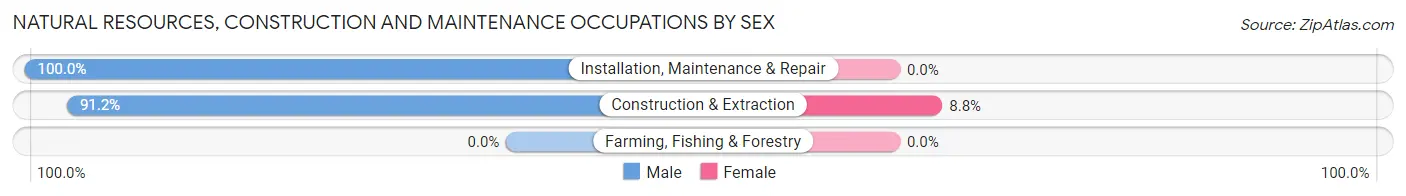
| Occupation | Male | Female |
| Farming, Fishing & Forestry | 0 (0.0%) | 0 (0.0%) |
| Construction & Extraction | 62 (91.2%) | 6 (8.8%) |
| Installation, Maintenance & Repair | 4 (100.0%) | 0 (0.0%) |
| Total (Category) | 66 (91.7%) | 6 (8.3%) |
| Total (Overall) | 1,067 (33.4%) | 2,124 (66.6%) |
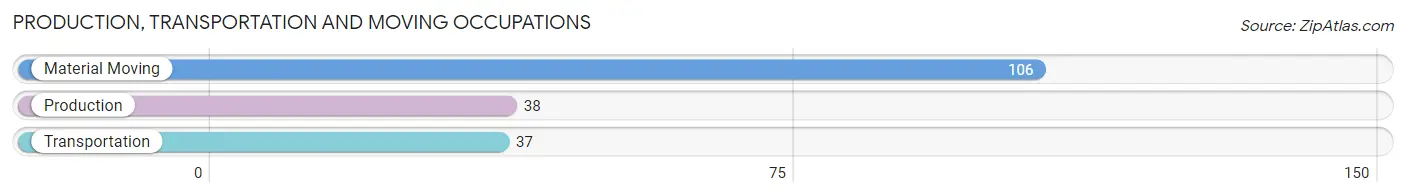
Production, Transportation and Moving Occupations
The most common Production, Transportation and Moving occupations in New Paltz are Material Moving (106 | 3.3%), Production (38 | 1.2%), and Transportation (37 | 1.2%).
Production, Transportation and Moving Occupations by Sex
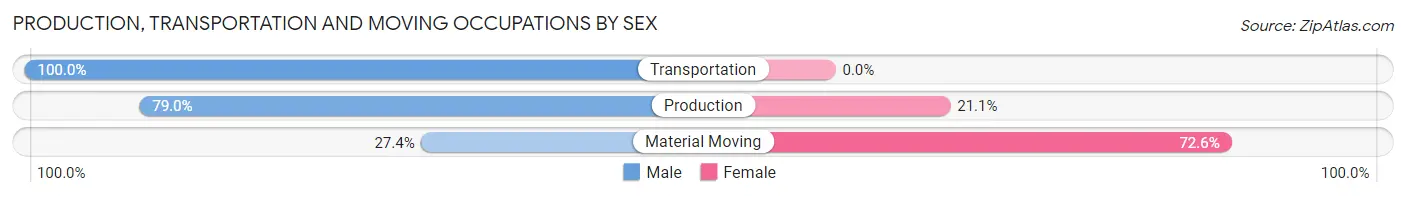
| Occupation | Male | Female |
| Production | 30 (78.9%) | 8 (21.0%) |
| Transportation | 37 (100.0%) | 0 (0.0%) |
| Material Moving | 29 (27.4%) | 77 (72.6%) |
| Total (Category) | 96 (53.0%) | 85 (47.0%) |
| Total (Overall) | 1,067 (33.4%) | 2,124 (66.6%) |
Employment Industries by Sex in New Paltz
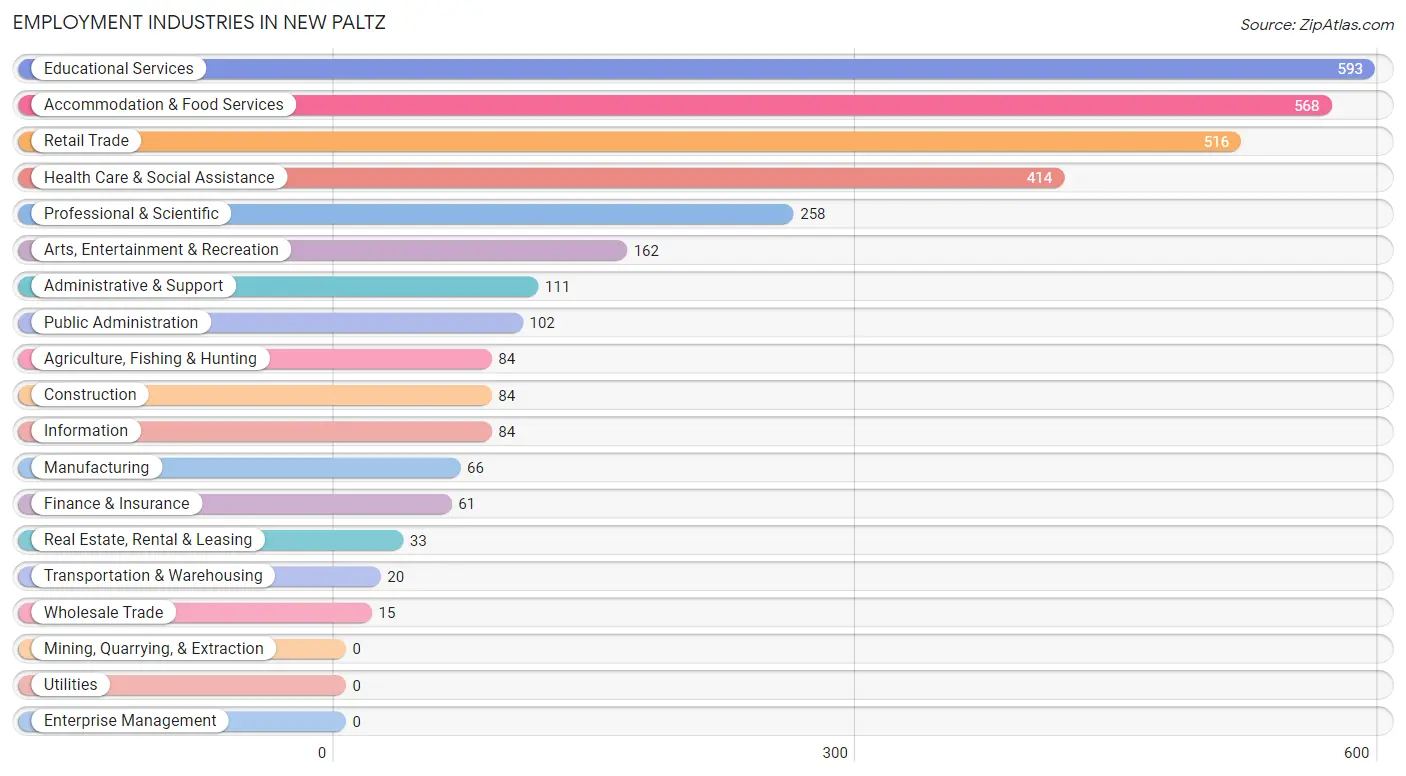
Employment Industries in New Paltz
The major employment industries in New Paltz include Educational Services (593 | 18.6%), Accommodation & Food Services (568 | 17.8%), Retail Trade (516 | 16.2%), Health Care & Social Assistance (414 | 13.0%), and Professional & Scientific (258 | 8.1%).
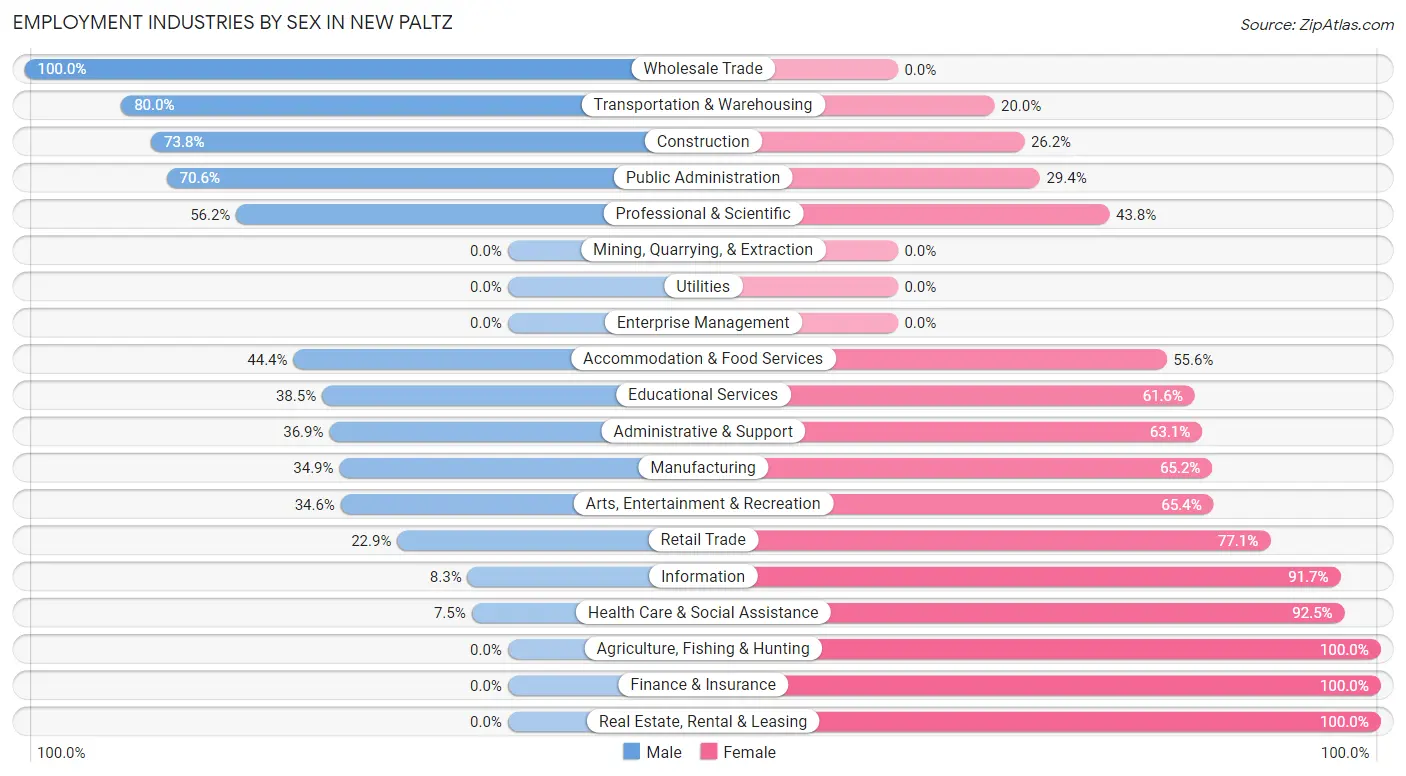
Employment Industries by Sex in New Paltz
The New Paltz industries that see more men than women are Wholesale Trade (100.0%), Transportation & Warehousing (80.0%), and Construction (73.8%), whereas the industries that tend to have a higher number of women are Agriculture, Fishing & Hunting (100.0%), Finance & Insurance (100.0%), and Real Estate, Rental & Leasing (100.0%).
| Industry | Male | Female |
| Agriculture, Fishing & Hunting | 0 (0.0%) | 84 (100.0%) |
| Mining, Quarrying, & Extraction | 0 (0.0%) | 0 (0.0%) |
| Construction | 62 (73.8%) | 22 (26.2%) |
| Manufacturing | 23 (34.8%) | 43 (65.1%) |
| Wholesale Trade | 15 (100.0%) | 0 (0.0%) |
| Retail Trade | 118 (22.9%) | 398 (77.1%) |
| Transportation & Warehousing | 16 (80.0%) | 4 (20.0%) |
| Utilities | 0 (0.0%) | 0 (0.0%) |
| Information | 7 (8.3%) | 77 (91.7%) |
| Finance & Insurance | 0 (0.0%) | 61 (100.0%) |
| Real Estate, Rental & Leasing | 0 (0.0%) | 33 (100.0%) |
| Professional & Scientific | 145 (56.2%) | 113 (43.8%) |
| Enterprise Management | 0 (0.0%) | 0 (0.0%) |
| Administrative & Support | 41 (36.9%) | 70 (63.1%) |
| Educational Services | 228 (38.5%) | 365 (61.6%) |
| Health Care & Social Assistance | 31 (7.5%) | 383 (92.5%) |
| Arts, Entertainment & Recreation | 56 (34.6%) | 106 (65.4%) |
| Accommodation & Food Services | 252 (44.4%) | 316 (55.6%) |
| Public Administration | 72 (70.6%) | 30 (29.4%) |
| Total | 1,067 (33.4%) | 2,124 (66.6%) |
Education in New Paltz
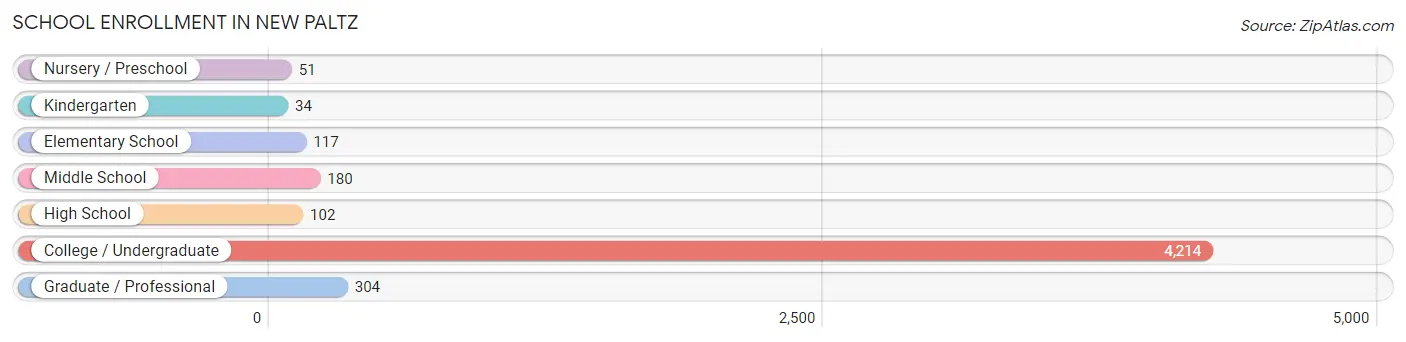
School Enrollment in New Paltz
The most common levels of schooling among the 5,002 students in New Paltz are college / undergraduate (4,214 | 84.3%), graduate / professional (304 | 6.1%), and middle school (180 | 3.6%).
| School Level | # Students | % Students |
| Nursery / Preschool | 51 | 1.0% |
| Kindergarten | 34 | 0.7% |
| Elementary School | 117 | 2.3% |
| Middle School | 180 | 3.6% |
| High School | 102 | 2.0% |
| College / Undergraduate | 4,214 | 84.3% |
| Graduate / Professional | 304 | 6.1% |
| Total | 5,002 | 100.0% |
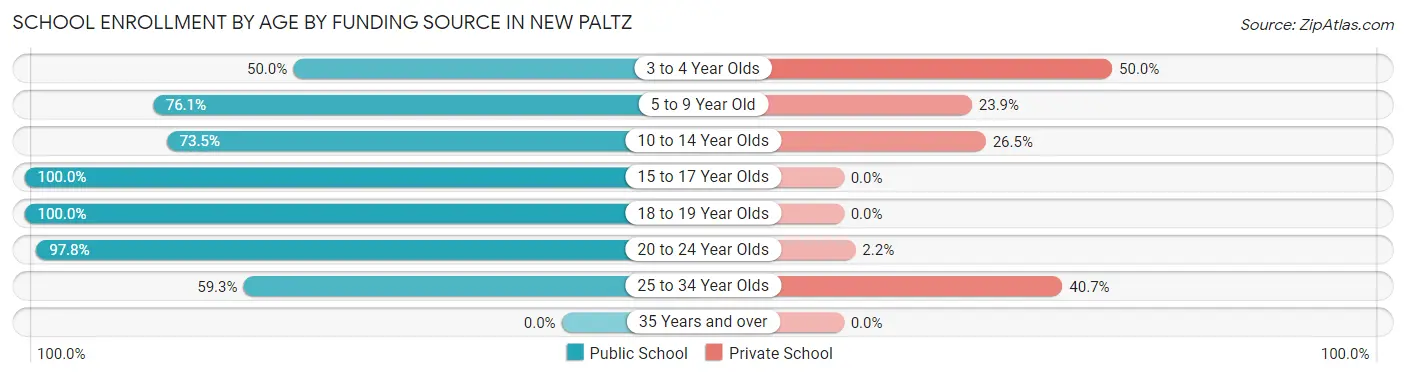
School Enrollment by Age by Funding Source in New Paltz
Out of a total of 5,002 students who are enrolled in schools in New Paltz, 225 (4.5%) attend a private institution, while the remaining 4,777 (95.5%) are enrolled in public schools. The age group of 3 to 4 year olds has the highest likelihood of being enrolled in private schools, with 34 (50.0% in the age bracket) enrolled. Conversely, the age group of 15 to 17 year olds has the lowest likelihood of being enrolled in a private school, with 120 (100.0% in the age bracket) attending a public institution.
| Age Bracket | Public School | Private School |
| 3 to 4 Year Olds | 34 (50.0%) | 34 (50.0%) |
| 5 to 9 Year Old | 102 (76.1%) | 32 (23.9%) |
| 10 to 14 Year Olds | 139 (73.5%) | 50 (26.5%) |
| 15 to 17 Year Olds | 120 (100.0%) | 0 (0.0%) |
| 18 to 19 Year Olds | 1,456 (100.0%) | 0 (0.0%) |
| 20 to 24 Year Olds | 2,863 (97.8%) | 64 (2.2%) |
| 25 to 34 Year Olds | 64 (59.3%) | 44 (40.7%) |
| 35 Years and over | 0 (0.0%) | 0 (0.0%) |
| Total | 4,777 (95.5%) | 225 (4.5%) |
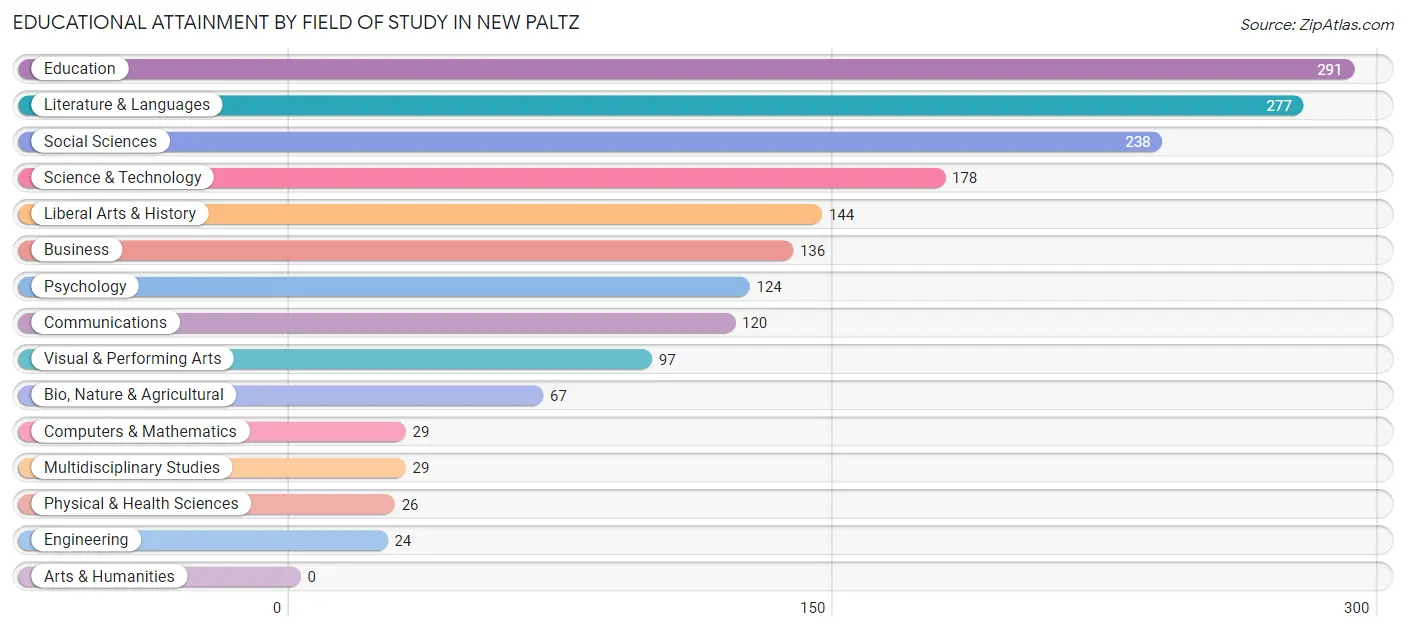
Educational Attainment by Field of Study in New Paltz
Education (291 | 16.4%), literature & languages (277 | 15.6%), social sciences (238 | 13.4%), science & technology (178 | 10.0%), and liberal arts & history (144 | 8.1%) are the most common fields of study among 1,780 individuals in New Paltz who have obtained a bachelor's degree or higher.
| Field of Study | # Graduates | % Graduates |
| Computers & Mathematics | 29 | 1.6% |
| Bio, Nature & Agricultural | 67 | 3.8% |
| Physical & Health Sciences | 26 | 1.5% |
| Psychology | 124 | 7.0% |
| Social Sciences | 238 | 13.4% |
| Engineering | 24 | 1.3% |
| Multidisciplinary Studies | 29 | 1.6% |
| Science & Technology | 178 | 10.0% |
| Business | 136 | 7.6% |
| Education | 291 | 16.4% |
| Literature & Languages | 277 | 15.6% |
| Liberal Arts & History | 144 | 8.1% |
| Visual & Performing Arts | 97 | 5.4% |
| Communications | 120 | 6.7% |
| Arts & Humanities | 0 | 0.0% |
| Total | 1,780 | 100.0% |
Transportation & Commute in New Paltz
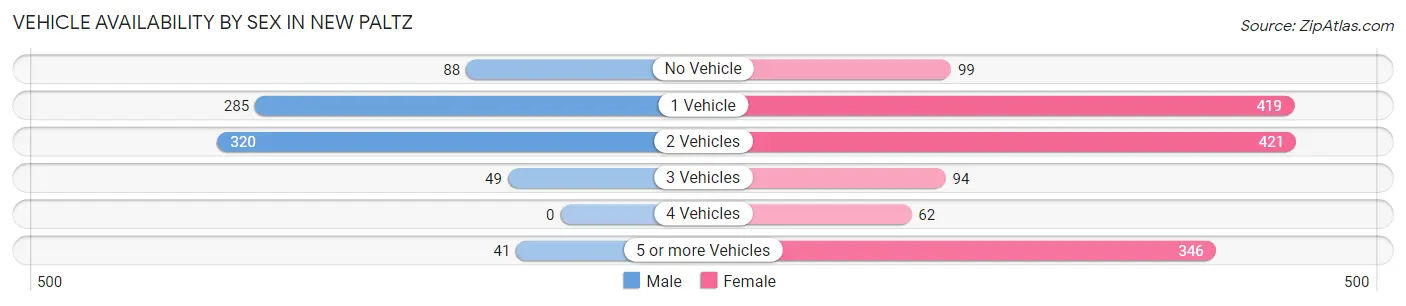
Vehicle Availability by Sex in New Paltz
The most prevalent vehicle ownership categories in New Paltz are males with 2 vehicles (320, accounting for 40.9%) and females with 2 vehicles (421, making up 22.2%).
| Vehicles Available | Male | Female |
| No Vehicle | 88 (11.2%) | 99 (6.9%) |
| 1 Vehicle | 285 (36.4%) | 419 (29.1%) |
| 2 Vehicles | 320 (40.9%) | 421 (29.2%) |
| 3 Vehicles | 49 (6.3%) | 94 (6.5%) |
| 4 Vehicles | 0 (0.0%) | 62 (4.3%) |
| 5 or more Vehicles | 41 (5.2%) | 346 (24.0%) |
| Total | 783 (100.0%) | 1,441 (100.0%) |
Commute Time in New Paltz
The most frequently occuring commute durations in New Paltz are 10 to 14 minutes (686 commuters, 25.8%), 5 to 9 minutes (501 commuters, 18.8%), and 45 to 59 minutes (279 commuters, 10.5%).
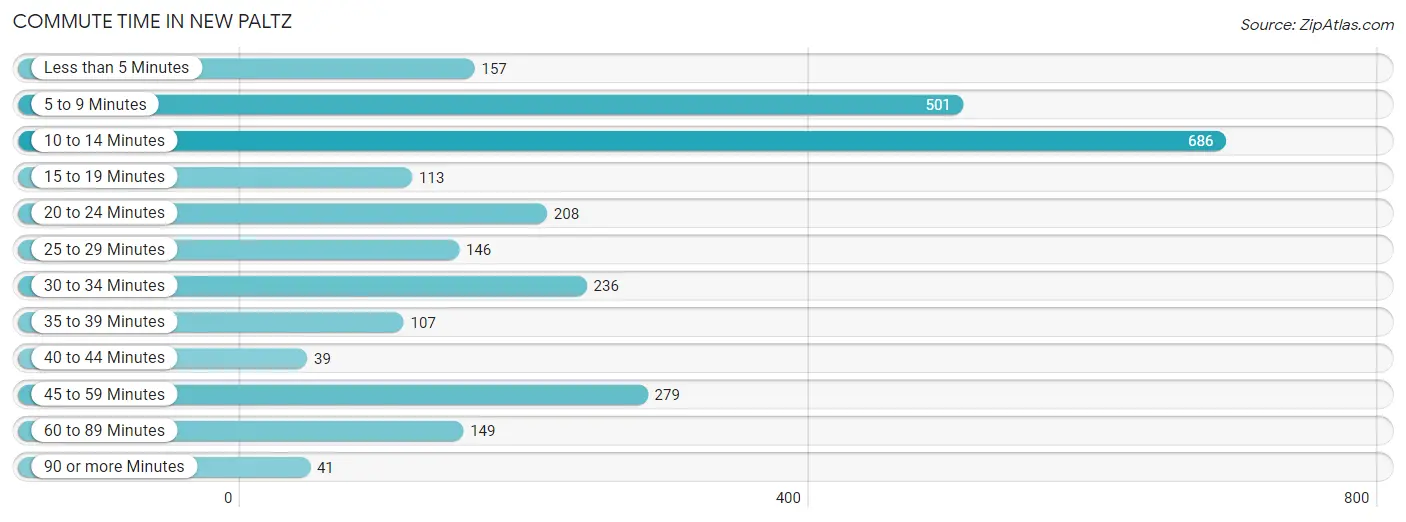
| Commute Time | # Commuters | % Commuters |
| Less than 5 Minutes | 157 | 5.9% |
| 5 to 9 Minutes | 501 | 18.8% |
| 10 to 14 Minutes | 686 | 25.8% |
| 15 to 19 Minutes | 113 | 4.2% |
| 20 to 24 Minutes | 208 | 7.8% |
| 25 to 29 Minutes | 146 | 5.5% |
| 30 to 34 Minutes | 236 | 8.9% |
| 35 to 39 Minutes | 107 | 4.0% |
| 40 to 44 Minutes | 39 | 1.5% |
| 45 to 59 Minutes | 279 | 10.5% |
| 60 to 89 Minutes | 149 | 5.6% |
| 90 or more Minutes | 41 | 1.5% |
Commute Time by Sex in New Paltz
The most common commute times in New Paltz are 10 to 14 minutes (197 commuters, 22.3%) for males and 10 to 14 minutes (489 commuters, 27.5%) for females.
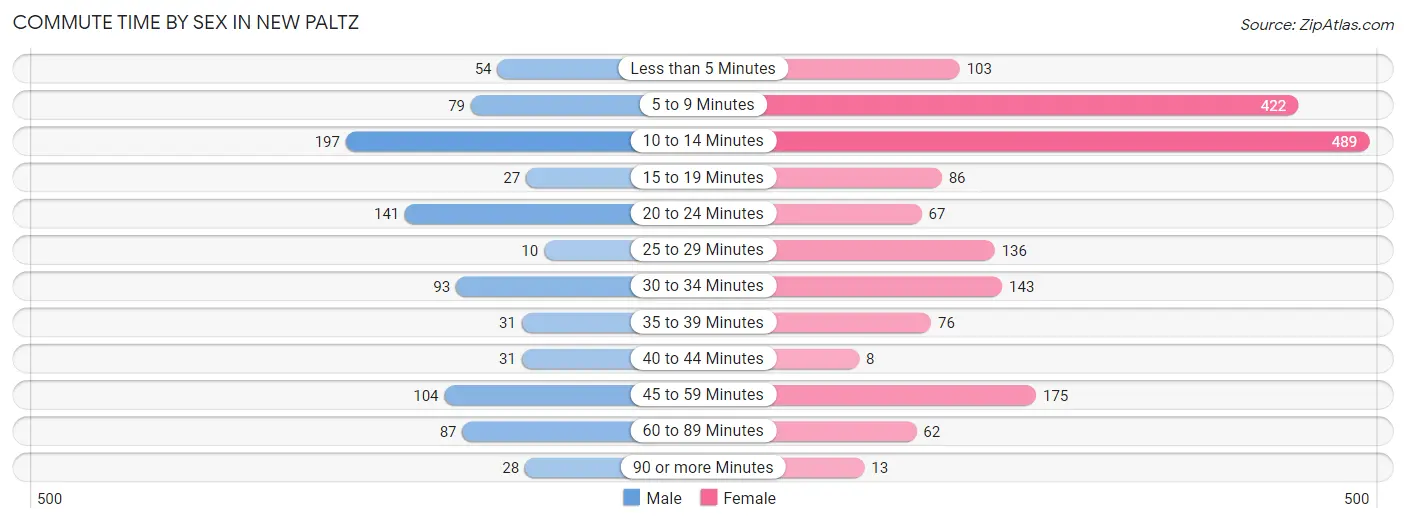
| Commute Time | Male | Female |
| Less than 5 Minutes | 54 (6.1%) | 103 (5.8%) |
| 5 to 9 Minutes | 79 (9.0%) | 422 (23.7%) |
| 10 to 14 Minutes | 197 (22.3%) | 489 (27.5%) |
| 15 to 19 Minutes | 27 (3.1%) | 86 (4.8%) |
| 20 to 24 Minutes | 141 (16.0%) | 67 (3.8%) |
| 25 to 29 Minutes | 10 (1.1%) | 136 (7.6%) |
| 30 to 34 Minutes | 93 (10.5%) | 143 (8.0%) |
| 35 to 39 Minutes | 31 (3.5%) | 76 (4.3%) |
| 40 to 44 Minutes | 31 (3.5%) | 8 (0.4%) |
| 45 to 59 Minutes | 104 (11.8%) | 175 (9.8%) |
| 60 to 89 Minutes | 87 (9.9%) | 62 (3.5%) |
| 90 or more Minutes | 28 (3.2%) | 13 (0.7%) |
Time of Departure to Work by Sex in New Paltz
The most frequent times of departure to work in New Paltz are 8:00 AM to 8:29 AM (227, 25.7%) for males and 12:00 PM to 3:59 PM (245, 13.8%) for females.
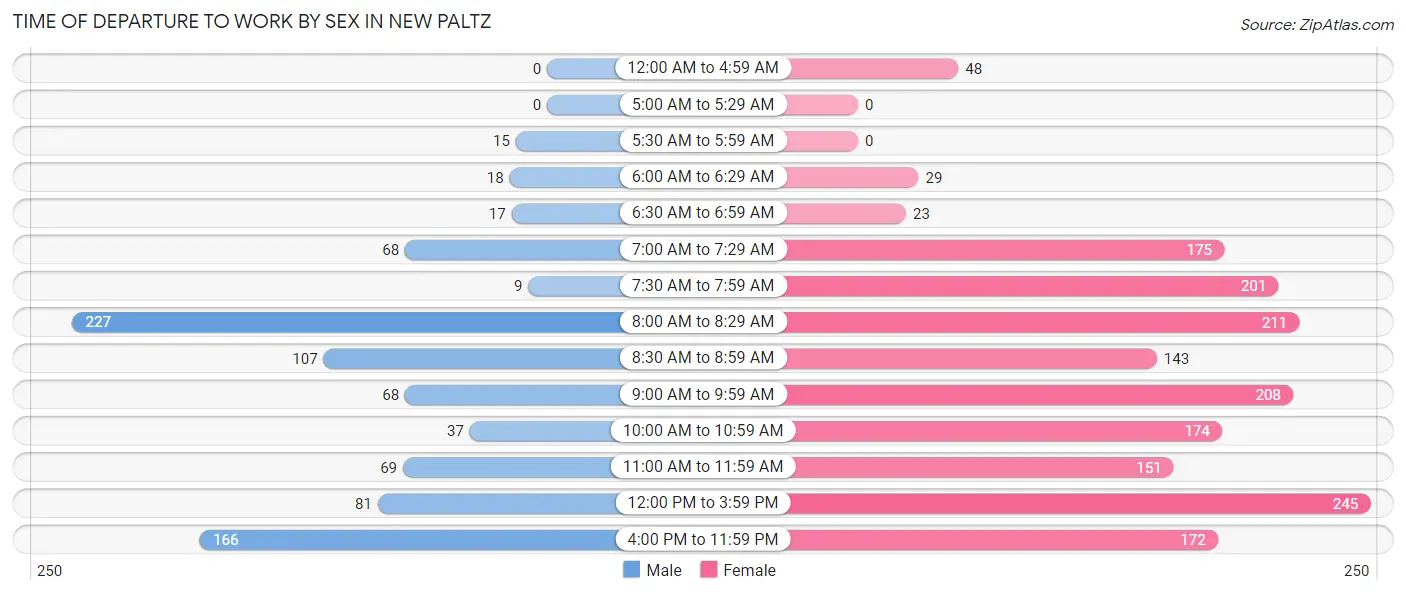
| Time of Departure | Male | Female |
| 12:00 AM to 4:59 AM | 0 (0.0%) | 48 (2.7%) |
| 5:00 AM to 5:29 AM | 0 (0.0%) | 0 (0.0%) |
| 5:30 AM to 5:59 AM | 15 (1.7%) | 0 (0.0%) |
| 6:00 AM to 6:29 AM | 18 (2.0%) | 29 (1.6%) |
| 6:30 AM to 6:59 AM | 17 (1.9%) | 23 (1.3%) |
| 7:00 AM to 7:29 AM | 68 (7.7%) | 175 (9.8%) |
| 7:30 AM to 7:59 AM | 9 (1.0%) | 201 (11.3%) |
| 8:00 AM to 8:29 AM | 227 (25.7%) | 211 (11.8%) |
| 8:30 AM to 8:59 AM | 107 (12.1%) | 143 (8.0%) |
| 9:00 AM to 9:59 AM | 68 (7.7%) | 208 (11.7%) |
| 10:00 AM to 10:59 AM | 37 (4.2%) | 174 (9.8%) |
| 11:00 AM to 11:59 AM | 69 (7.8%) | 151 (8.5%) |
| 12:00 PM to 3:59 PM | 81 (9.2%) | 245 (13.8%) |
| 4:00 PM to 11:59 PM | 166 (18.8%) | 172 (9.7%) |
| Total | 882 (100.0%) | 1,780 (100.0%) |
Housing Occupancy in New Paltz
Occupancy by Ownership in New Paltz
Of the total 2,221 dwellings in New Paltz, owner-occupied units account for 646 (29.1%), while renter-occupied units make up 1,575 (70.9%).
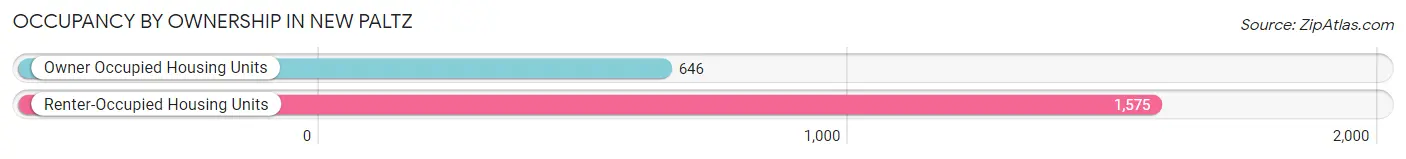
| Occupancy | # Housing Units | % Housing Units |
| Owner Occupied Housing Units | 646 | 29.1% |
| Renter-Occupied Housing Units | 1,575 | 70.9% |
| Total Occupied Housing Units | 2,221 | 100.0% |
Occupancy by Household Size in New Paltz
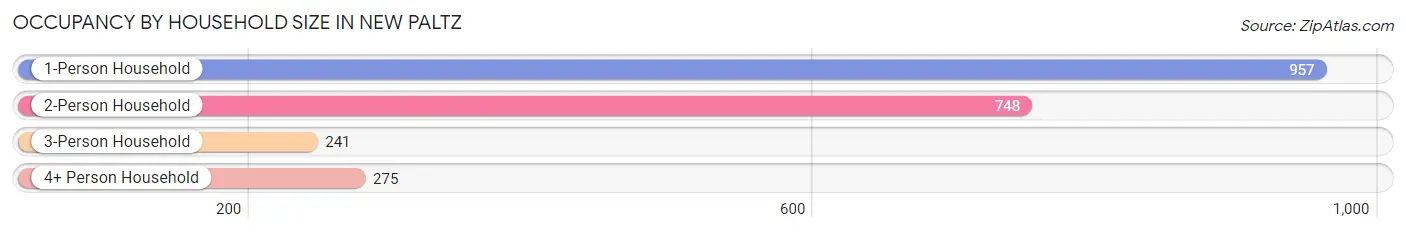
| Household Size | # Housing Units | % Housing Units |
| 1-Person Household | 957 | 43.1% |
| 2-Person Household | 748 | 33.7% |
| 3-Person Household | 241 | 10.8% |
| 4+ Person Household | 275 | 12.4% |
| Total Housing Units | 2,221 | 100.0% |
Occupancy by Ownership by Household Size in New Paltz
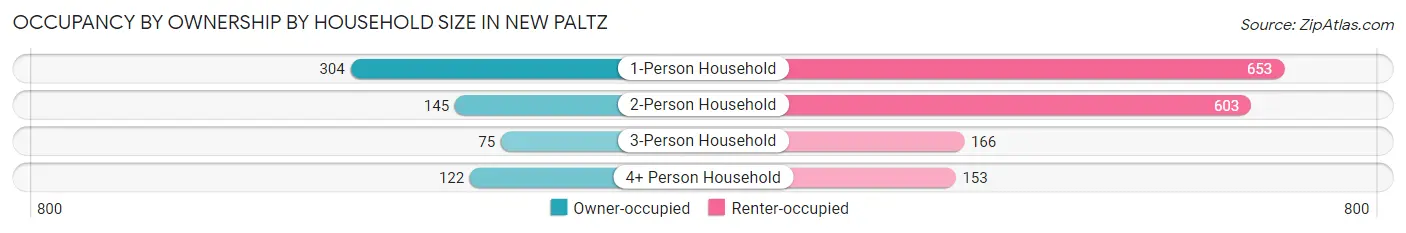
| Household Size | Owner-occupied | Renter-occupied |
| 1-Person Household | 304 (31.8%) | 653 (68.2%) |
| 2-Person Household | 145 (19.4%) | 603 (80.6%) |
| 3-Person Household | 75 (31.1%) | 166 (68.9%) |
| 4+ Person Household | 122 (44.4%) | 153 (55.6%) |
| Total Housing Units | 646 (29.1%) | 1,575 (70.9%) |
Occupancy by Educational Attainment in New Paltz
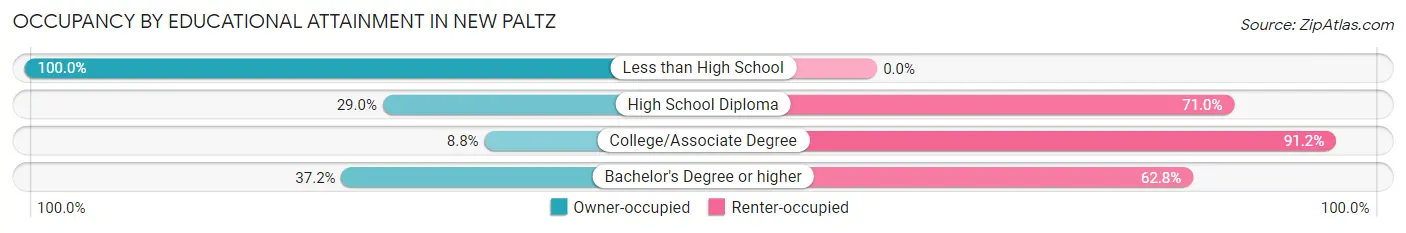
| Household Size | Owner-occupied | Renter-occupied |
| Less than High School | 14 (100.0%) | 0 (0.0%) |
| High School Diploma | 78 (29.0%) | 191 (71.0%) |
| College/Associate Degree | 52 (8.8%) | 536 (91.2%) |
| Bachelor's Degree or higher | 502 (37.2%) | 848 (62.8%) |
Occupancy by Age of Householder in New Paltz
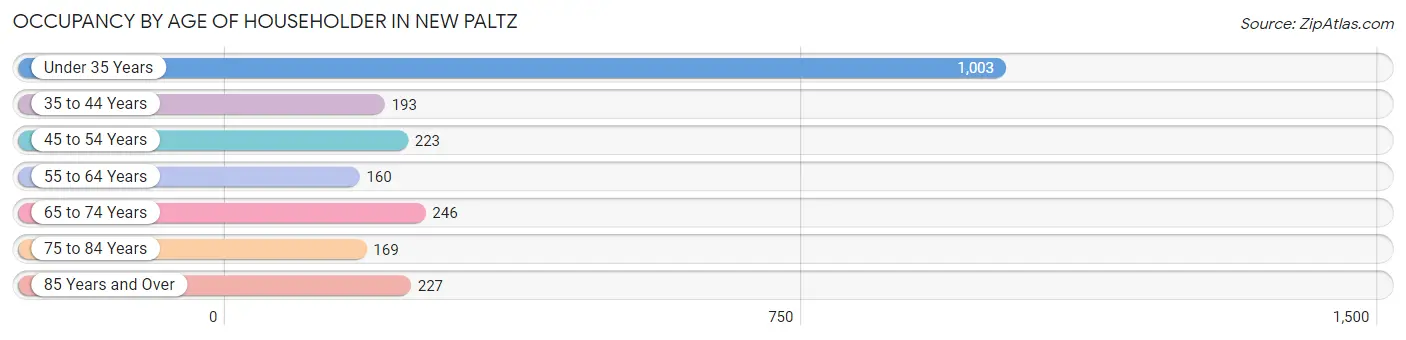
| Age Bracket | # Households | % Households |
| Under 35 Years | 1,003 | 45.2% |
| 35 to 44 Years | 193 | 8.7% |
| 45 to 54 Years | 223 | 10.0% |
| 55 to 64 Years | 160 | 7.2% |
| 65 to 74 Years | 246 | 11.1% |
| 75 to 84 Years | 169 | 7.6% |
| 85 Years and Over | 227 | 10.2% |
| Total | 2,221 | 100.0% |
Housing Finances in New Paltz
Median Income by Occupancy in New Paltz
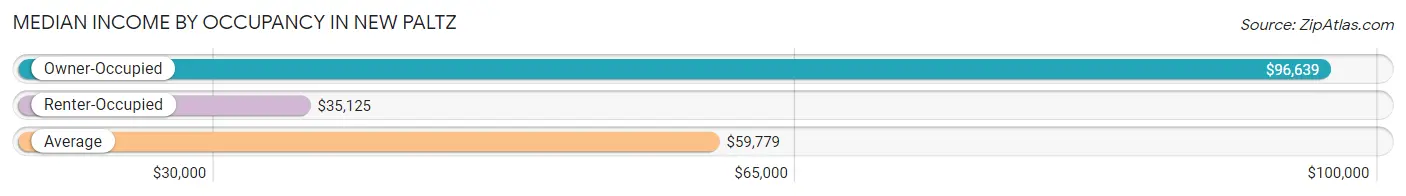
| Occupancy Type | # Households | Median Income |
| Owner-Occupied | 646 (29.1%) | $96,639 |
| Renter-Occupied | 1,575 (70.9%) | $35,125 |
| Average | 2,221 (100.0%) | $59,779 |
Occupancy by Householder Income Bracket in New Paltz
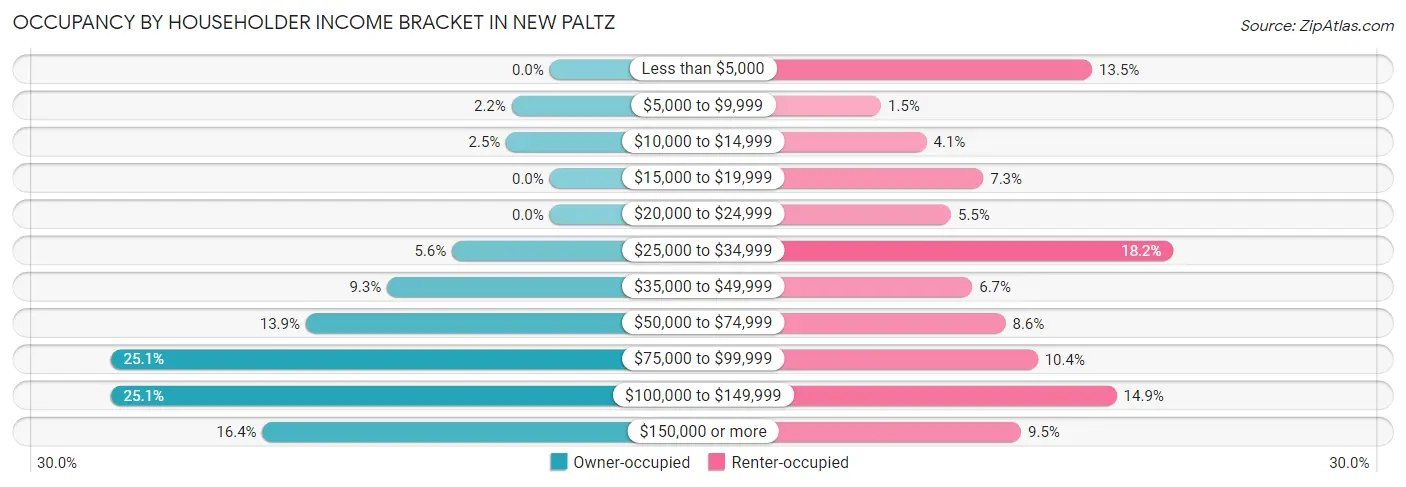
| Income Bracket | Owner-occupied | Renter-occupied |
| Less than $5,000 | 0 (0.0%) | 213 (13.5%) |
| $5,000 to $9,999 | 14 (2.2%) | 23 (1.5%) |
| $10,000 to $14,999 | 16 (2.5%) | 64 (4.1%) |
| $15,000 to $19,999 | 0 (0.0%) | 115 (7.3%) |
| $20,000 to $24,999 | 0 (0.0%) | 86 (5.5%) |
| $25,000 to $34,999 | 36 (5.6%) | 286 (18.2%) |
| $35,000 to $49,999 | 60 (9.3%) | 105 (6.7%) |
| $50,000 to $74,999 | 90 (13.9%) | 135 (8.6%) |
| $75,000 to $99,999 | 162 (25.1%) | 164 (10.4%) |
| $100,000 to $149,999 | 162 (25.1%) | 235 (14.9%) |
| $150,000 or more | 106 (16.4%) | 149 (9.5%) |
| Total | 646 (100.0%) | 1,575 (100.0%) |
Monthly Housing Cost Tiers in New Paltz
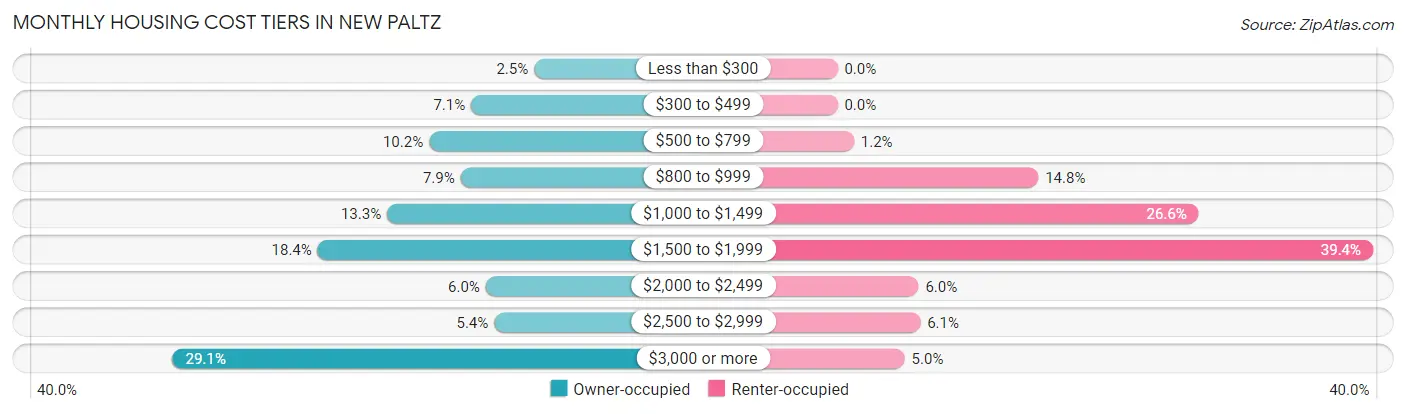
| Monthly Cost | Owner-occupied | Renter-occupied |
| Less than $300 | 16 (2.5%) | 0 (0.0%) |
| $300 to $499 | 46 (7.1%) | 0 (0.0%) |
| $500 to $799 | 66 (10.2%) | 19 (1.2%) |
| $800 to $999 | 51 (7.9%) | 233 (14.8%) |
| $1,000 to $1,499 | 86 (13.3%) | 419 (26.6%) |
| $1,500 to $1,999 | 119 (18.4%) | 621 (39.4%) |
| $2,000 to $2,499 | 39 (6.0%) | 94 (6.0%) |
| $2,500 to $2,999 | 35 (5.4%) | 96 (6.1%) |
| $3,000 or more | 188 (29.1%) | 78 (5.0%) |
| Total | 646 (100.0%) | 1,575 (100.0%) |
Physical Housing Characteristics in New Paltz
Housing Structures in New Paltz
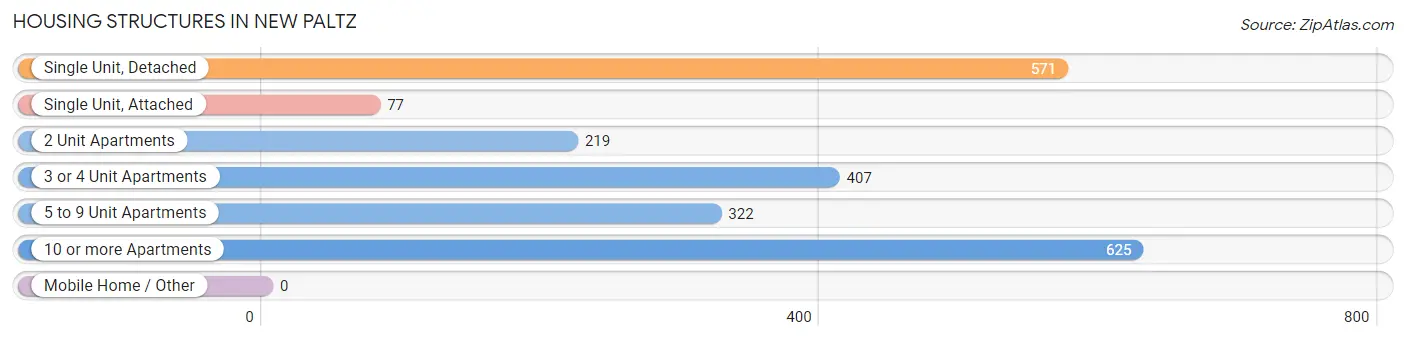
| Structure Type | # Housing Units | % Housing Units |
| Single Unit, Detached | 571 | 25.7% |
| Single Unit, Attached | 77 | 3.5% |
| 2 Unit Apartments | 219 | 9.9% |
| 3 or 4 Unit Apartments | 407 | 18.3% |
| 5 to 9 Unit Apartments | 322 | 14.5% |
| 10 or more Apartments | 625 | 28.1% |
| Mobile Home / Other | 0 | 0.0% |
| Total | 2,221 | 100.0% |
Housing Structures by Occupancy in New Paltz
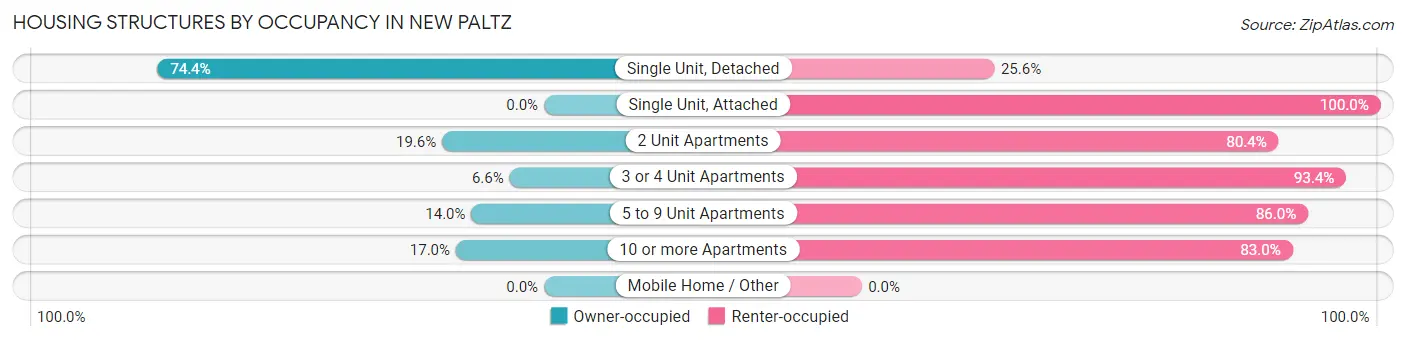
| Structure Type | Owner-occupied | Renter-occupied |
| Single Unit, Detached | 425 (74.4%) | 146 (25.6%) |
| Single Unit, Attached | 0 (0.0%) | 77 (100.0%) |
| 2 Unit Apartments | 43 (19.6%) | 176 (80.4%) |
| 3 or 4 Unit Apartments | 27 (6.6%) | 380 (93.4%) |
| 5 to 9 Unit Apartments | 45 (14.0%) | 277 (86.0%) |
| 10 or more Apartments | 106 (17.0%) | 519 (83.0%) |
| Mobile Home / Other | 0 (0.0%) | 0 (0.0%) |
| Total | 646 (29.1%) | 1,575 (70.9%) |
Housing Structures by Number of Rooms in New Paltz
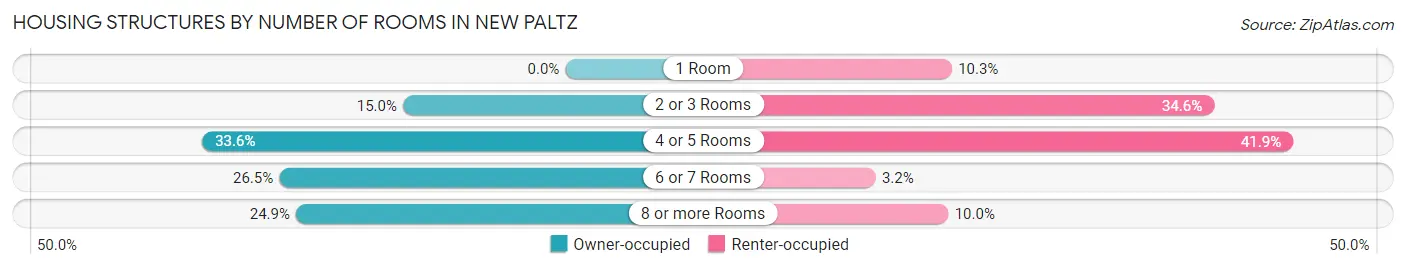
| Number of Rooms | Owner-occupied | Renter-occupied |
| 1 Room | 0 (0.0%) | 162 (10.3%) |
| 2 or 3 Rooms | 97 (15.0%) | 545 (34.6%) |
| 4 or 5 Rooms | 217 (33.6%) | 660 (41.9%) |
| 6 or 7 Rooms | 171 (26.5%) | 51 (3.2%) |
| 8 or more Rooms | 161 (24.9%) | 157 (10.0%) |
| Total | 646 (100.0%) | 1,575 (100.0%) |
Housing Structure by Heating Type in New Paltz
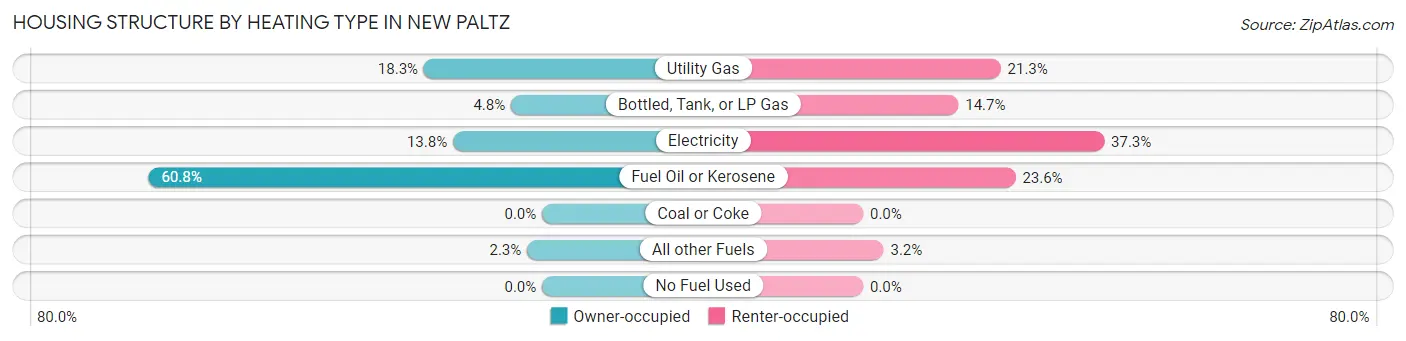
| Heating Type | Owner-occupied | Renter-occupied |
| Utility Gas | 118 (18.3%) | 335 (21.3%) |
| Bottled, Tank, or LP Gas | 31 (4.8%) | 232 (14.7%) |
| Electricity | 89 (13.8%) | 587 (37.3%) |
| Fuel Oil or Kerosene | 393 (60.8%) | 371 (23.6%) |
| Coal or Coke | 0 (0.0%) | 0 (0.0%) |
| All other Fuels | 15 (2.3%) | 50 (3.2%) |
| No Fuel Used | 0 (0.0%) | 0 (0.0%) |
| Total | 646 (100.0%) | 1,575 (100.0%) |
Household Vehicle Usage in New Paltz
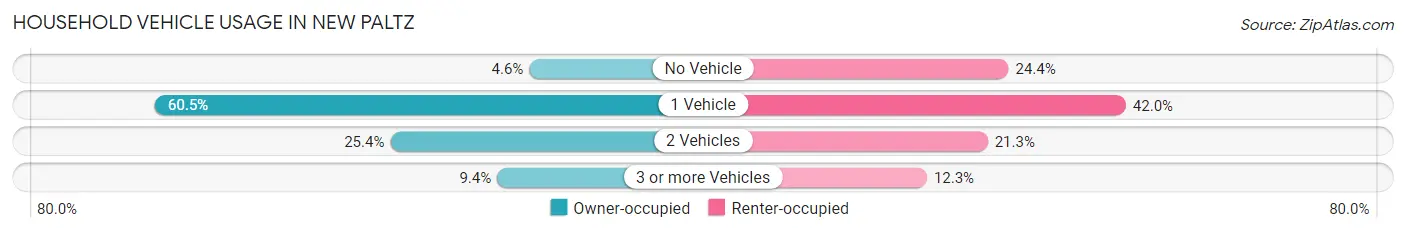
| Vehicles per Household | Owner-occupied | Renter-occupied |
| No Vehicle | 30 (4.6%) | 385 (24.4%) |
| 1 Vehicle | 391 (60.5%) | 661 (42.0%) |
| 2 Vehicles | 164 (25.4%) | 336 (21.3%) |
| 3 or more Vehicles | 61 (9.4%) | 193 (12.2%) |
| Total | 646 (100.0%) | 1,575 (100.0%) |
Real Estate & Mortgages in New Paltz
Real Estate and Mortgage Overview in New Paltz
| Characteristic | Without Mortgage | With Mortgage |
| Housing Units | 277 | 369 |
| Median Property Value | $381,400 | $317,700 |
| Median Household Income | $96,838 | $72 |
| Monthly Housing Costs | $848 | $188 |
| Real Estate Taxes | - | - |
Property Value by Mortgage Status in New Paltz
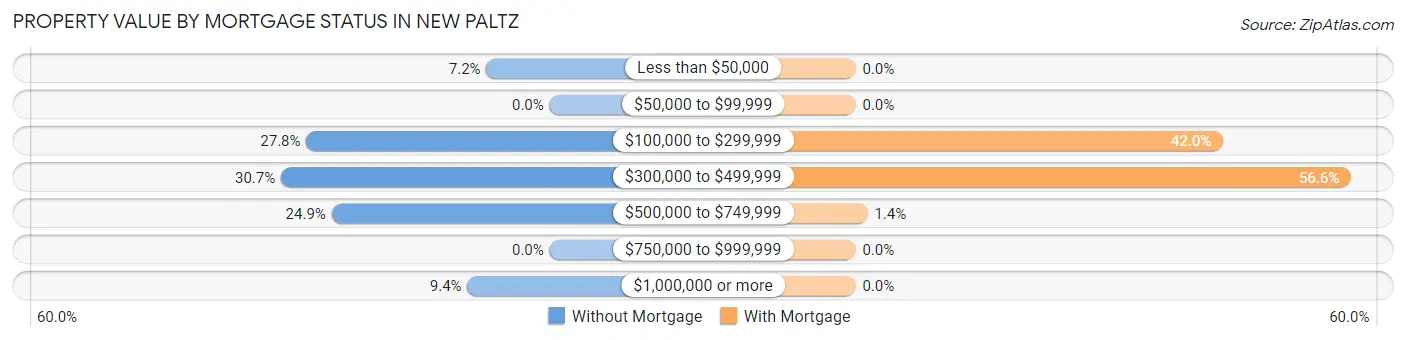
| Property Value | Without Mortgage | With Mortgage |
| Less than $50,000 | 20 (7.2%) | 0 (0.0%) |
| $50,000 to $99,999 | 0 (0.0%) | 0 (0.0%) |
| $100,000 to $299,999 | 77 (27.8%) | 155 (42.0%) |
| $300,000 to $499,999 | 85 (30.7%) | 209 (56.6%) |
| $500,000 to $749,999 | 69 (24.9%) | 5 (1.4%) |
| $750,000 to $999,999 | 0 (0.0%) | 0 (0.0%) |
| $1,000,000 or more | 26 (9.4%) | 0 (0.0%) |
| Total | 277 (100.0%) | 369 (100.0%) |
Household Income by Mortgage Status in New Paltz
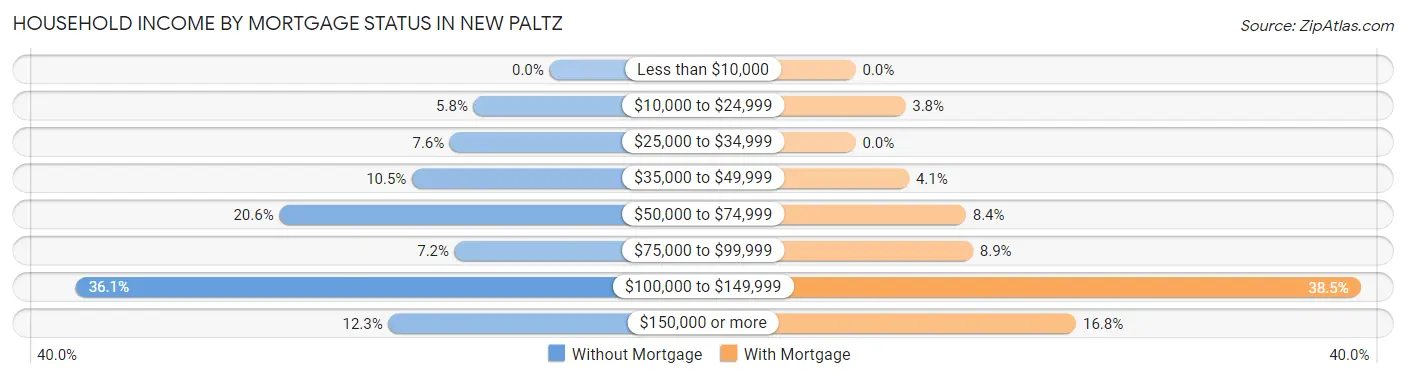
| Household Income | Without Mortgage | With Mortgage |
| Less than $10,000 | 0 (0.0%) | 0 (0.0%) |
| $10,000 to $24,999 | 16 (5.8%) | 14 (3.8%) |
| $25,000 to $34,999 | 21 (7.6%) | 0 (0.0%) |
| $35,000 to $49,999 | 29 (10.5%) | 15 (4.1%) |
| $50,000 to $74,999 | 57 (20.6%) | 31 (8.4%) |
| $75,000 to $99,999 | 20 (7.2%) | 33 (8.9%) |
| $100,000 to $149,999 | 100 (36.1%) | 142 (38.5%) |
| $150,000 or more | 34 (12.3%) | 62 (16.8%) |
| Total | 277 (100.0%) | 369 (100.0%) |
Property Value to Household Income Ratio in New Paltz
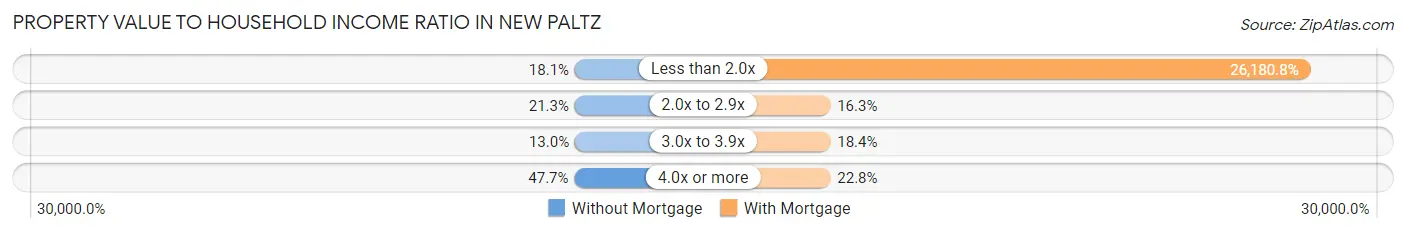
| Value-to-Income Ratio | Without Mortgage | With Mortgage |
| Less than 2.0x | 50 (18.0%) | 96,607 (26,180.8%) |
| 2.0x to 2.9x | 59 (21.3%) | 60 (16.3%) |
| 3.0x to 3.9x | 36 (13.0%) | 68 (18.4%) |
| 4.0x or more | 132 (47.6%) | 84 (22.8%) |
| Total | 277 (100.0%) | 369 (100.0%) |
Real Estate Taxes by Mortgage Status in New Paltz
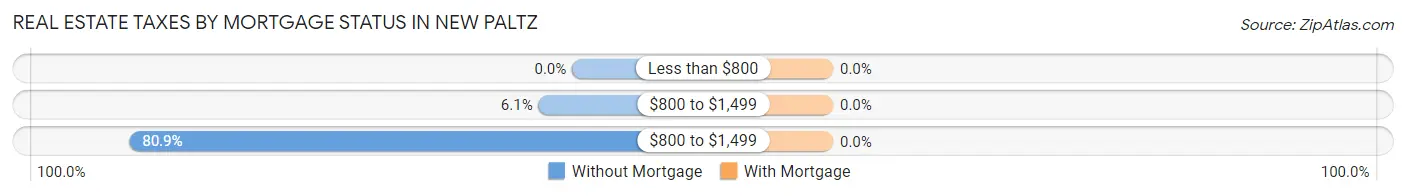
| Property Taxes | Without Mortgage | With Mortgage |
| Less than $800 | 0 (0.0%) | 0 (0.0%) |
| $800 to $1,499 | 17 (6.1%) | 0 (0.0%) |
| $800 to $1,499 | 224 (80.9%) | 0 (0.0%) |
| Total | 277 (100.0%) | 369 (100.0%) |
Health & Disability in New Paltz
Health Insurance Coverage by Age in New Paltz
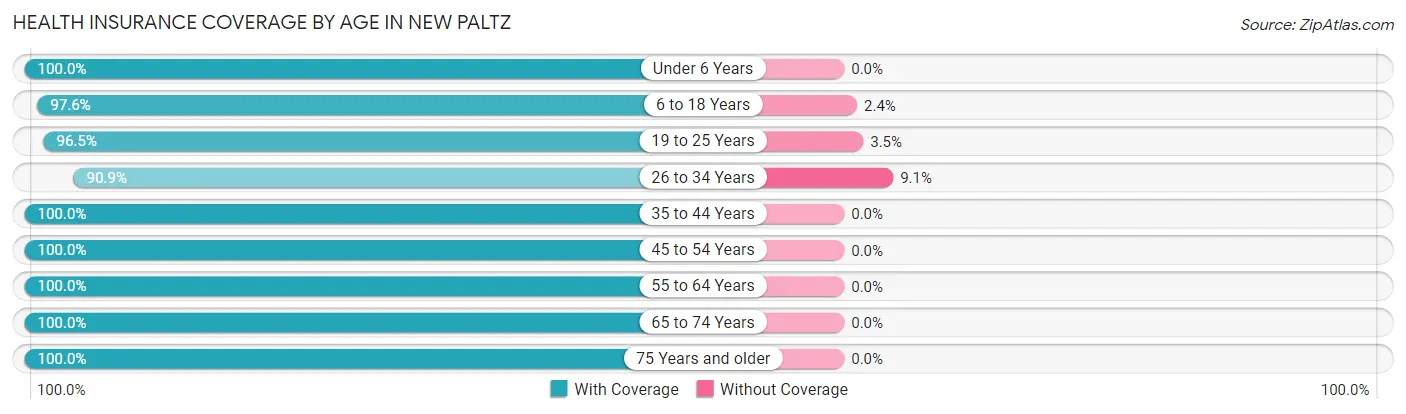
| Age Bracket | With Coverage | Without Coverage |
| Under 6 Years | 138 (100.0%) | 0 (0.0%) |
| 6 to 18 Years | 1,101 (97.6%) | 27 (2.4%) |
| 19 to 25 Years | 4,084 (96.5%) | 150 (3.5%) |
| 26 to 34 Years | 418 (90.9%) | 42 (9.1%) |
| 35 to 44 Years | 290 (100.0%) | 0 (0.0%) |
| 45 to 54 Years | 391 (100.0%) | 0 (0.0%) |
| 55 to 64 Years | 232 (100.0%) | 0 (0.0%) |
| 65 to 74 Years | 355 (100.0%) | 0 (0.0%) |
| 75 Years and older | 482 (100.0%) | 0 (0.0%) |
| Total | 7,491 (97.2%) | 219 (2.8%) |
Health Insurance Coverage by Citizenship Status in New Paltz
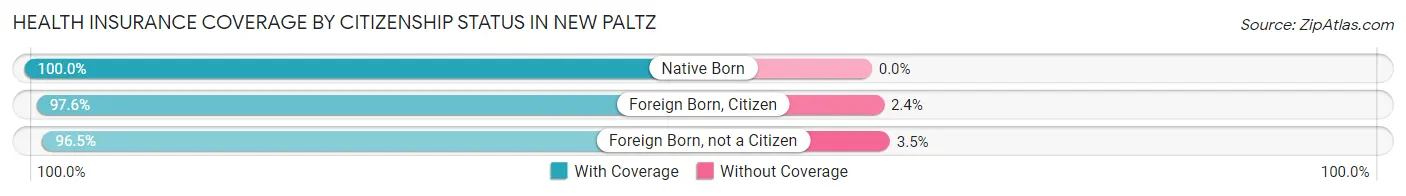
| Citizenship Status | With Coverage | Without Coverage |
| Native Born | 138 (100.0%) | 0 (0.0%) |
| Foreign Born, Citizen | 1,101 (97.6%) | 27 (2.4%) |
| Foreign Born, not a Citizen | 4,084 (96.5%) | 150 (3.5%) |
Health Insurance Coverage by Household Income in New Paltz
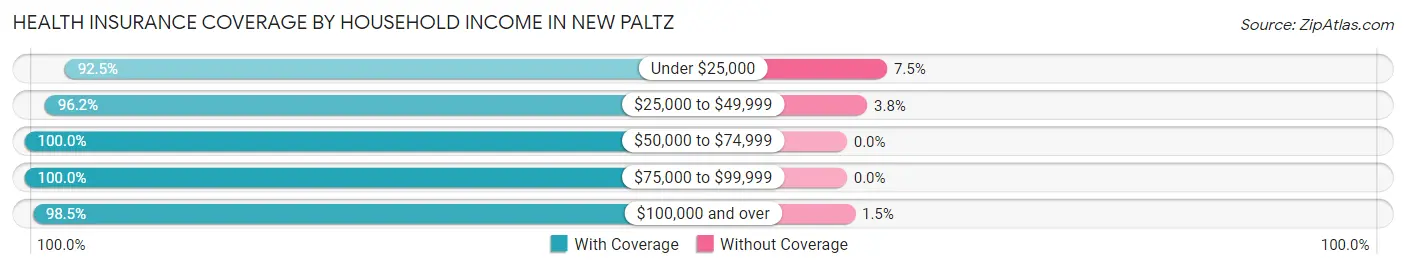
| Household Income | With Coverage | Without Coverage |
| Under $25,000 | 873 (92.5%) | 71 (7.5%) |
| $25,000 to $49,999 | 1,239 (96.2%) | 49 (3.8%) |
| $50,000 to $74,999 | 351 (100.0%) | 0 (0.0%) |
| $75,000 to $99,999 | 651 (100.0%) | 0 (0.0%) |
| $100,000 and over | 1,659 (98.5%) | 26 (1.5%) |
Public vs Private Health Insurance Coverage by Age in New Paltz
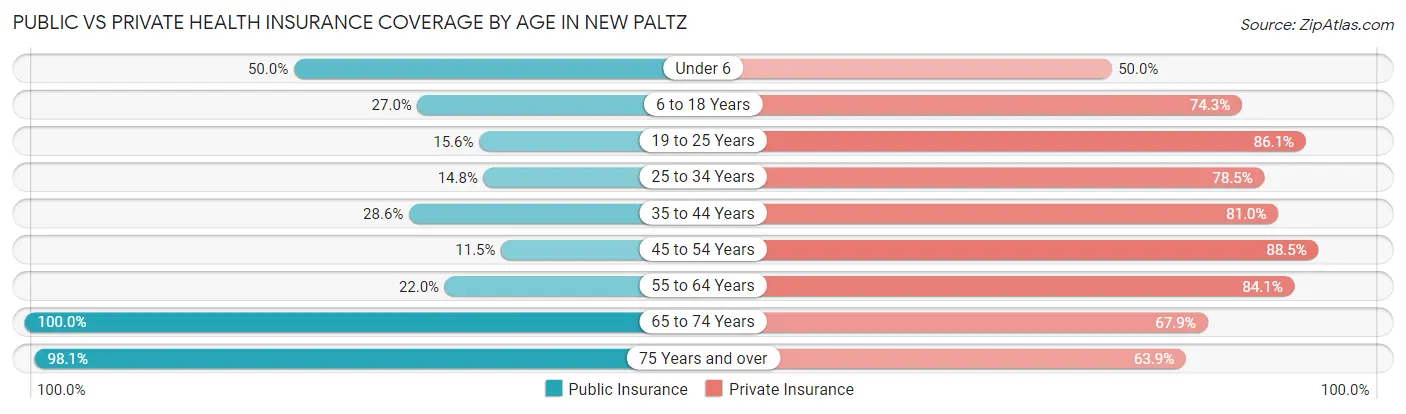
| Age Bracket | Public Insurance | Private Insurance |
| Under 6 | 69 (50.0%) | 69 (50.0%) |
| 6 to 18 Years | 305 (27.0%) | 838 (74.3%) |
| 19 to 25 Years | 661 (15.6%) | 3,647 (86.1%) |
| 25 to 34 Years | 68 (14.8%) | 361 (78.5%) |
| 35 to 44 Years | 83 (28.6%) | 235 (81.0%) |
| 45 to 54 Years | 45 (11.5%) | 346 (88.5%) |
| 55 to 64 Years | 51 (22.0%) | 195 (84.1%) |
| 65 to 74 Years | 355 (100.0%) | 241 (67.9%) |
| 75 Years and over | 473 (98.1%) | 308 (63.9%) |
| Total | 2,110 (27.4%) | 6,240 (80.9%) |
Disability Status by Sex by Age in New Paltz
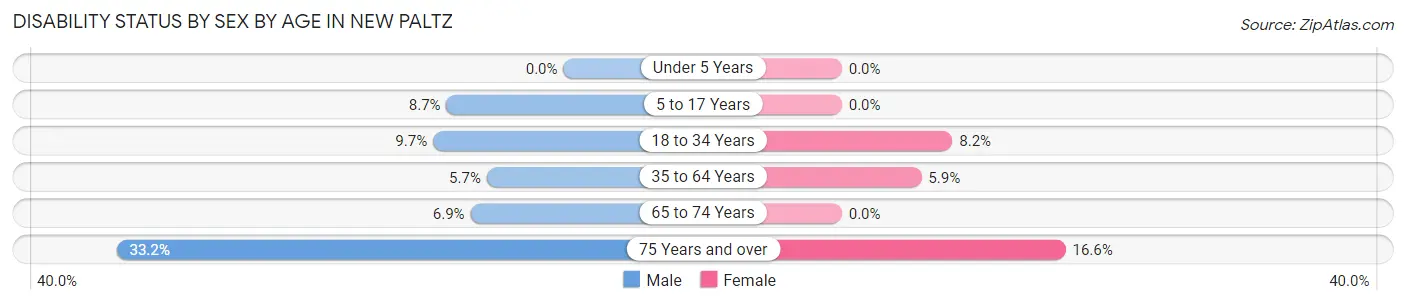
| Age Bracket | Male | Female |
| Under 5 Years | 0 (0.0%) | 0 (0.0%) |
| 5 to 17 Years | 19 (8.7%) | 0 (0.0%) |
| 18 to 34 Years | 174 (9.7%) | 295 (8.2%) |
| 35 to 64 Years | 25 (5.7%) | 28 (5.9%) |
| 65 to 74 Years | 14 (6.9%) | 0 (0.0%) |
| 75 Years and over | 68 (33.2%) | 46 (16.6%) |
Disability Class by Sex by Age in New Paltz
Disability Class: Hearing Difficulty
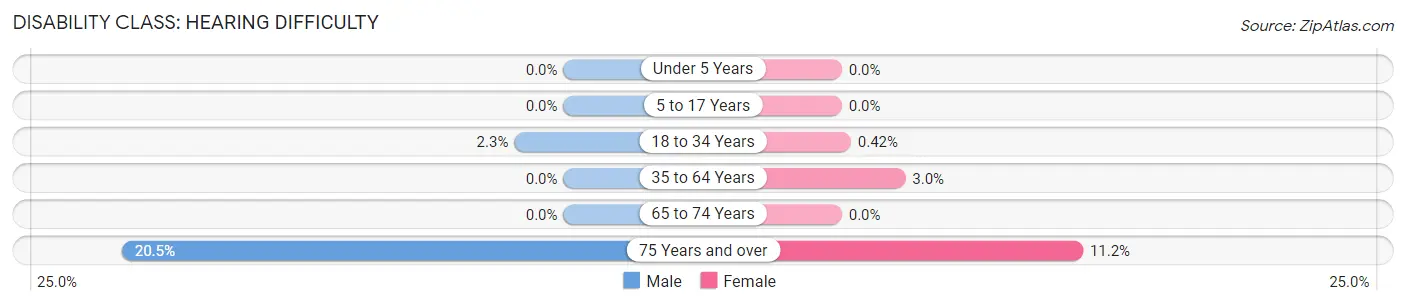
| Age Bracket | Male | Female |
| Under 5 Years | 0 (0.0%) | 0 (0.0%) |
| 5 to 17 Years | 0 (0.0%) | 0 (0.0%) |
| 18 to 34 Years | 41 (2.3%) | 15 (0.4%) |
| 35 to 64 Years | 0 (0.0%) | 14 (2.9%) |
| 65 to 74 Years | 0 (0.0%) | 0 (0.0%) |
| 75 Years and over | 42 (20.5%) | 31 (11.2%) |
Disability Class: Vision Difficulty
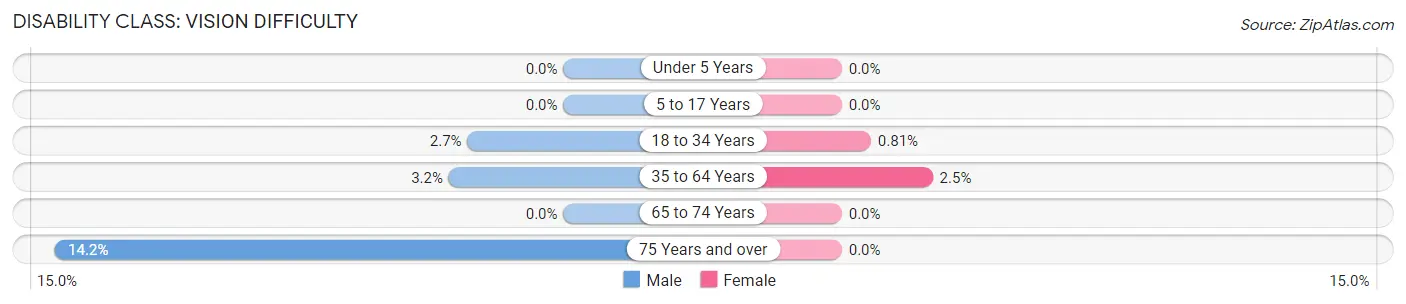
| Age Bracket | Male | Female |
| Under 5 Years | 0 (0.0%) | 0 (0.0%) |
| 5 to 17 Years | 0 (0.0%) | 0 (0.0%) |
| 18 to 34 Years | 48 (2.7%) | 29 (0.8%) |
| 35 to 64 Years | 14 (3.2%) | 12 (2.5%) |
| 65 to 74 Years | 0 (0.0%) | 0 (0.0%) |
| 75 Years and over | 29 (14.1%) | 0 (0.0%) |
Disability Class: Cognitive Difficulty
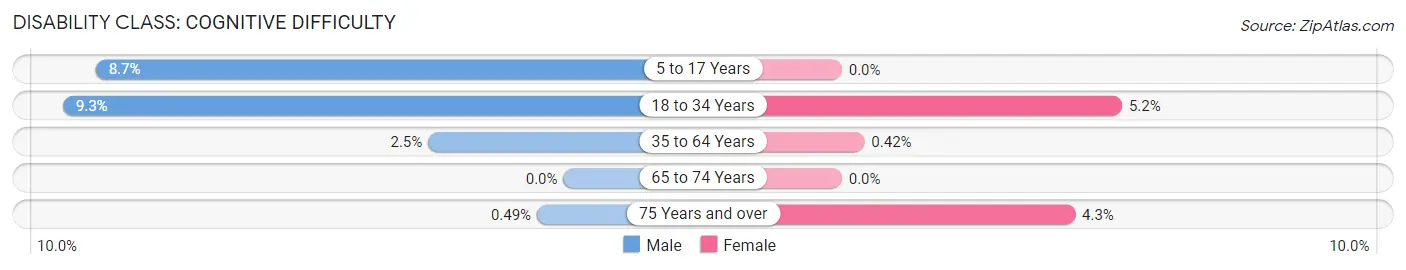
| Age Bracket | Male | Female |
| 5 to 17 Years | 19 (8.7%) | 0 (0.0%) |
| 18 to 34 Years | 167 (9.3%) | 187 (5.2%) |
| 35 to 64 Years | 11 (2.5%) | 2 (0.4%) |
| 65 to 74 Years | 0 (0.0%) | 0 (0.0%) |
| 75 Years and over | 1 (0.5%) | 12 (4.3%) |
Disability Class: Ambulatory Difficulty
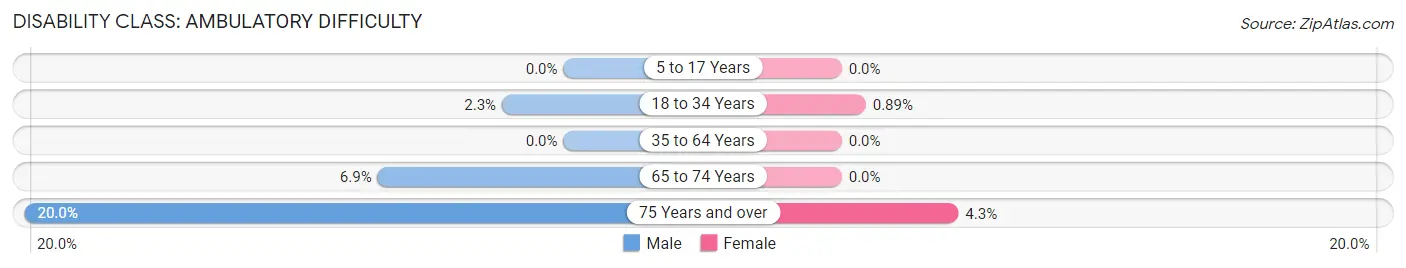
| Age Bracket | Male | Female |
| 5 to 17 Years | 0 (0.0%) | 0 (0.0%) |
| 18 to 34 Years | 41 (2.3%) | 32 (0.9%) |
| 35 to 64 Years | 0 (0.0%) | 0 (0.0%) |
| 65 to 74 Years | 14 (6.9%) | 0 (0.0%) |
| 75 Years and over | 41 (20.0%) | 12 (4.3%) |
Disability Class: Self-Care Difficulty
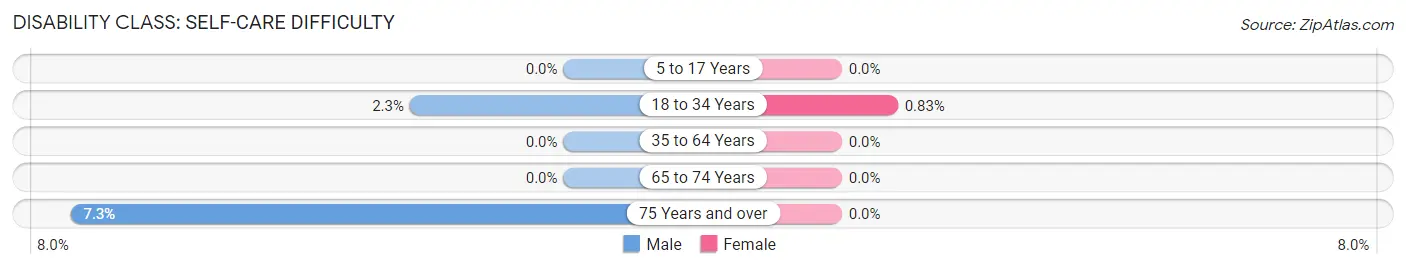
| Age Bracket | Male | Female |
| 5 to 17 Years | 0 (0.0%) | 0 (0.0%) |
| 18 to 34 Years | 41 (2.3%) | 30 (0.8%) |
| 35 to 64 Years | 0 (0.0%) | 0 (0.0%) |
| 65 to 74 Years | 0 (0.0%) | 0 (0.0%) |
| 75 Years and over | 15 (7.3%) | 0 (0.0%) |
Technology Access in New Paltz
Computing Device Access in New Paltz
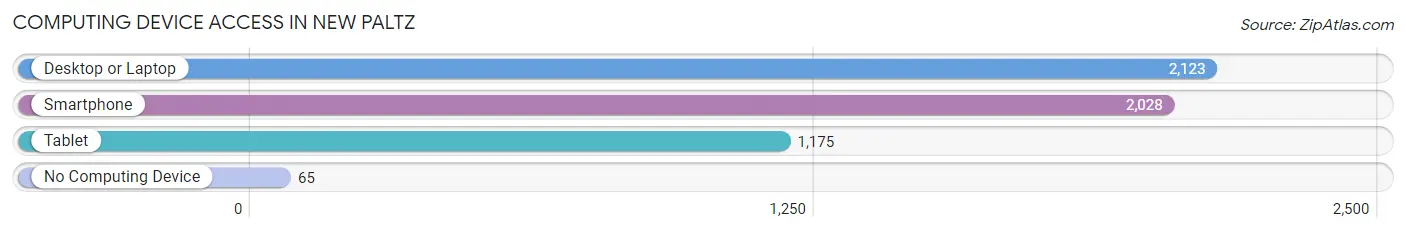
| Device Type | # Households | % Households |
| Desktop or Laptop | 2,123 | 95.6% |
| Smartphone | 2,028 | 91.3% |
| Tablet | 1,175 | 52.9% |
| No Computing Device | 65 | 2.9% |
| Total | 2,221 | 100.0% |
Internet Access in New Paltz
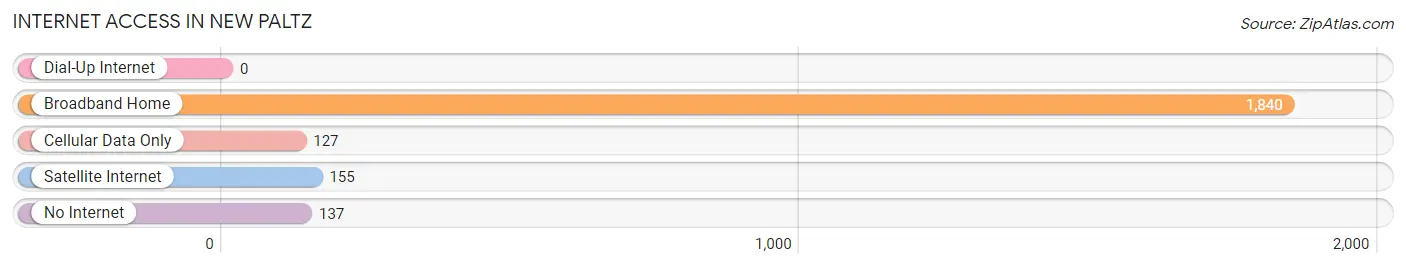
| Internet Type | # Households | % Households |
| Dial-Up Internet | 0 | 0.0% |
| Broadband Home | 1,840 | 82.9% |
| Cellular Data Only | 127 | 5.7% |
| Satellite Internet | 155 | 7.0% |
| No Internet | 137 | 6.2% |
| Total | 2,221 | 100.0% |
New Paltz Summary
New Paltz, NY is a small town located in Ulster County, New York, United States. It is situated in the Hudson Valley, about 80 miles north of New York City. The town is home to the State University of New York at New Paltz, as well as the Mohonk Mountain House, a popular resort. The town has a population of around 14,000 people and is known for its vibrant arts and culture scene.
History
New Paltz was first settled in 1678 by French Huguenots, who were fleeing religious persecution in France. The town was named after the Palatinate of the Rhine in Germany, where many of the settlers had come from. The settlers established a thriving agricultural community, and the town quickly grew in size and importance.
In 1777, the Battle of New Paltz was fought in the town during the American Revolutionary War. The battle was a victory for the American forces, and the town was later used as a base for the Continental Army.
In the 19th century, New Paltz became a popular tourist destination, thanks to the nearby Mohonk Mountain House. The resort was founded in 1869 and quickly became a popular destination for wealthy New Yorkers.
Geography
New Paltz is located in the Hudson Valley region of New York, about 80 miles north of New York City. The town is situated on the Shawangunk Ridge, a ridge of the Appalachian Mountains. The town is bordered by the Wallkill River to the east and the Rondout Creek to the west.
The town has a total area of 8.2 square miles, of which 8.1 square miles is land and 0.1 square miles is water. The terrain is mostly hilly, with some flat areas near the rivers.
Economy
New Paltz’s economy is largely driven by tourism, thanks to the nearby Mohonk Mountain House. The resort is a popular destination for wealthy New Yorkers, and it attracts thousands of visitors each year.
The town is also home to the State University of New York at New Paltz, which provides jobs for many local residents. The university also attracts students from around the world, which helps to boost the local economy.
In addition, New Paltz is home to several small businesses, including restaurants, shops, and galleries. The town also has a vibrant arts and culture scene, which helps to attract visitors and boost the local economy.
Demographics
As of the 2010 census, New Paltz had a population of 14,003. The racial makeup of the town was 87.3% White, 5.2% African American, 0.3% Native American, 3.2% Asian, 0.1% Pacific Islander, and 3.9% from other races. Hispanic or Latino of any race were 8.2% of the population.
The median household income in New Paltz was $50,945, and the median family income was $63,917. The per capita income was $25,945. About 11.2% of families and 20.2% of the population were below the poverty line.
New Paltz is a small town with a rich history and a vibrant culture. The town is home to the State University of New York at New Paltz, as well as the Mohonk Mountain House, a popular resort. The town has a diverse population and a strong economy, thanks to its tourism industry and its university.
Common Questions
What is Per Capita Income in New Paltz?
Per Capita income in New Paltz is $22,763.
What is the Median Family Income in New Paltz?
Median Family Income in New Paltz is $87,401.
What is the Median Household income in New Paltz?
Median Household Income in New Paltz is $59,779.
What is Income or Wage Gap in New Paltz?
Income or Wage Gap in New Paltz is 55.3%.
Women in New Paltz earn 44.7 cents for every dollar earned by a man.
What is Inequality or Gini Index in New Paltz?
Inequality or Gini Index in New Paltz is 0.46.
What is the Total Population of New Paltz?
Total Population of New Paltz is 7,732.
What is the Total Male Population of New Paltz?
Total Male Population of New Paltz is 2,933.
What is the Total Female Population of New Paltz?
Total Female Population of New Paltz is 4,799.
What is the Ratio of Males per 100 Females in New Paltz?
There are 61.12 Males per 100 Females in New Paltz.
What is the Ratio of Females per 100 Males in New Paltz?
There are 163.62 Females per 100 Males in New Paltz.
What is the Median Population Age in New Paltz?
Median Population Age in New Paltz is 21.6 Years.
What is the Average Family Size in New Paltz
Average Family Size in New Paltz is 2.7 People.
What is the Average Household Size in New Paltz
Average Household Size in New Paltz is 2.2 People.
How Large is the Labor Force in New Paltz?
There are 3,515 People in the Labor Forcein in New Paltz.
What is the Percentage of People in the Labor Force in New Paltz?
48.5% of People are in the Labor Force in New Paltz.
What is the Unemployment Rate in New Paltz?
Unemployment Rate in New Paltz is 9.2%.