Cities with the Largest British West Indian Community in New York
RELATED REPORTS & OPTIONS
British West Indian
New York
Compare Cities
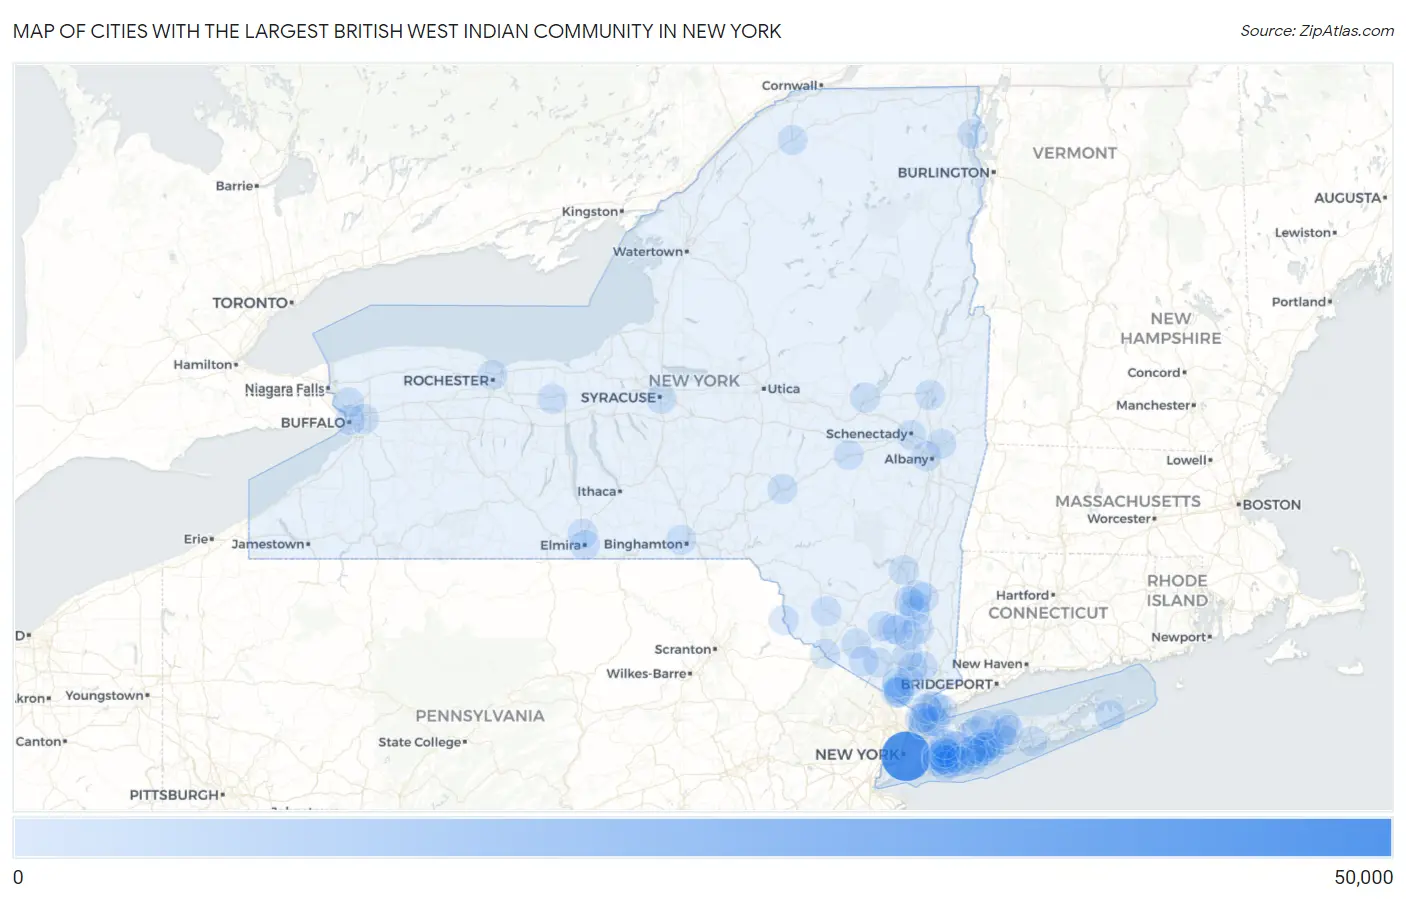
Map of Cities with the Largest British West Indian Community in New York
0
50,000
Cities with the Largest British West Indian Community in New York
| City | British West Indian | vs State | vs National | |
| 1. | New York | 49,370 | 57,691(85.58%)#1 | 121,005(40.80%)#1 |
| 2. | Mount Vernon | 918 | 57,691(1.59%)#2 | 121,005(0.76%)#4 |
| 3. | Yonkers | 569 | 57,691(0.99%)#3 | 121,005(0.47%)#14 |
| 4. | Elmont | 481 | 57,691(0.83%)#4 | 121,005(0.40%)#18 |
| 5. | Poughkeepsie | 339 | 57,691(0.59%)#5 | 121,005(0.28%)#32 |
| 6. | New Rochelle | 304 | 57,691(0.53%)#6 | 121,005(0.25%)#36 |
| 7. | Peekskill | 243 | 57,691(0.42%)#7 | 121,005(0.20%)#41 |
| 8. | Spackenkill | 179 | 57,691(0.31%)#8 | 121,005(0.15%)#64 |
| 9. | Port Jervis | 176 | 57,691(0.31%)#9 | 121,005(0.15%)#66 |
| 10. | Rochester | 172 | 57,691(0.30%)#10 | 121,005(0.14%)#67 |
| 11. | North Valley Stream | 163 | 57,691(0.28%)#11 | 121,005(0.13%)#76 |
| 12. | Shirley | 158 | 57,691(0.27%)#12 | 121,005(0.13%)#81 |
| 13. | Roosevelt | 143 | 57,691(0.25%)#13 | 121,005(0.12%)#92 |
| 14. | Freeport | 137 | 57,691(0.24%)#14 | 121,005(0.11%)#98 |
| 15. | Central Islip | 127 | 57,691(0.22%)#15 | 121,005(0.10%)#110 |
| 16. | New Cassel | 120 | 57,691(0.21%)#16 | 121,005(0.10%)#112 |
| 17. | Walton Park | 120 | 57,691(0.21%)#17 | 121,005(0.10%)#113 |
| 18. | West Babylon | 117 | 57,691(0.20%)#18 | 121,005(0.10%)#120 |
| 19. | Syracuse | 116 | 57,691(0.20%)#19 | 121,005(0.10%)#123 |
| 20. | Buffalo | 115 | 57,691(0.20%)#20 | 121,005(0.10%)#124 |
| 21. | Saratoga Springs | 111 | 57,691(0.19%)#21 | 121,005(0.09%)#128 |
| 22. | Hempstead | 104 | 57,691(0.18%)#22 | 121,005(0.09%)#135 |
| 23. | Mamaroneck | 101 | 57,691(0.18%)#23 | 121,005(0.08%)#141 |
| 24. | North Bay Shore | 86 | 57,691(0.15%)#24 | 121,005(0.07%)#164 |
| 25. | Schenectady | 84 | 57,691(0.15%)#25 | 121,005(0.07%)#172 |
| 26. | Johnson City | 83 | 57,691(0.14%)#26 | 121,005(0.07%)#178 |
| 27. | Wyandanch | 78 | 57,691(0.14%)#27 | 121,005(0.06%)#189 |
| 28. | Monticello | 76 | 57,691(0.13%)#28 | 121,005(0.06%)#192 |
| 29. | Baldwin | 74 | 57,691(0.13%)#29 | 121,005(0.06%)#195 |
| 30. | Merritt Park | 73 | 57,691(0.13%)#30 | 121,005(0.06%)#199 |
| 31. | Albany | 67 | 57,691(0.12%)#31 | 121,005(0.06%)#216 |
| 32. | Troy | 66 | 57,691(0.11%)#32 | 121,005(0.05%)#226 |
| 33. | Orange Lake | 65 | 57,691(0.11%)#33 | 121,005(0.05%)#231 |
| 34. | Huntington Station | 61 | 57,691(0.11%)#34 | 121,005(0.05%)#247 |
| 35. | Kingston | 60 | 57,691(0.10%)#35 | 121,005(0.05%)#250 |
| 36. | Harrison | 59 | 57,691(0.10%)#36 | 121,005(0.05%)#254 |
| 37. | Akwesasne | 59 | 57,691(0.10%)#37 | 121,005(0.05%)#256 |
| 38. | Valley Stream | 52 | 57,691(0.09%)#38 | 121,005(0.04%)#278 |
| 39. | White Plains | 51 | 57,691(0.09%)#39 | 121,005(0.04%)#279 |
| 40. | Middletown | 51 | 57,691(0.09%)#40 | 121,005(0.04%)#282 |
| 41. | Uniondale | 49 | 57,691(0.08%)#41 | 121,005(0.04%)#288 |
| 42. | North Merrick | 49 | 57,691(0.08%)#42 | 121,005(0.04%)#291 |
| 43. | Bay Shore | 48 | 57,691(0.08%)#43 | 121,005(0.04%)#295 |
| 44. | Newark | 48 | 57,691(0.08%)#44 | 121,005(0.04%)#297 |
| 45. | Tonawanda | 46 | 57,691(0.08%)#45 | 121,005(0.04%)#308 |
| 46. | Franklin Square | 45 | 57,691(0.08%)#46 | 121,005(0.04%)#315 |
| 47. | Florida | 45 | 57,691(0.08%)#47 | 121,005(0.04%)#318 |
| 48. | Haviland | 44 | 57,691(0.08%)#48 | 121,005(0.04%)#324 |
| 49. | Highland | 41 | 57,691(0.07%)#49 | 121,005(0.03%)#340 |
| 50. | Lakeview | 39 | 57,691(0.07%)#50 | 121,005(0.03%)#356 |
| 51. | Gananda | 38 | 57,691(0.07%)#51 | 121,005(0.03%)#362 |
| 52. | Hillcrest | 37 | 57,691(0.06%)#52 | 121,005(0.03%)#368 |
| 53. | East Hampton North | 36 | 57,691(0.06%)#53 | 121,005(0.03%)#372 |
| 54. | Deer Park | 34 | 57,691(0.06%)#54 | 121,005(0.03%)#386 |
| 55. | Greenlawn | 33 | 57,691(0.06%)#55 | 121,005(0.03%)#398 |
| 56. | East Massapequa | 32 | 57,691(0.06%)#56 | 121,005(0.03%)#405 |
| 57. | Oneonta | 32 | 57,691(0.06%)#57 | 121,005(0.03%)#406 |
| 58. | Spring Valley | 30 | 57,691(0.05%)#58 | 121,005(0.02%)#419 |
| 59. | Stony Brook University | 30 | 57,691(0.05%)#59 | 121,005(0.02%)#421 |
| 60. | Fairview Cdp Westchester County | 30 | 57,691(0.05%)#60 | 121,005(0.02%)#423 |
| 61. | Crompond | 29 | 57,691(0.05%)#61 | 121,005(0.02%)#434 |
| 62. | Oceanside | 28 | 57,691(0.05%)#62 | 121,005(0.02%)#440 |
| 63. | New Hempstead | 28 | 57,691(0.05%)#63 | 121,005(0.02%)#445 |
| 64. | Hicksville | 26 | 57,691(0.05%)#64 | 121,005(0.02%)#463 |
| 65. | Beacon | 22 | 57,691(0.04%)#65 | 121,005(0.02%)#508 |
| 66. | Baywood | 21 | 57,691(0.04%)#66 | 121,005(0.02%)#530 |
| 67. | Narrowsburg | 20 | 57,691(0.03%)#67 | 121,005(0.02%)#549 |
| 68. | Brentwood | 19 | 57,691(0.03%)#68 | 121,005(0.02%)#550 |
| 69. | Copiague | 19 | 57,691(0.03%)#69 | 121,005(0.02%)#555 |
| 70. | Ronkonkoma | 19 | 57,691(0.03%)#70 | 121,005(0.02%)#556 |
| 71. | Latham | 19 | 57,691(0.03%)#71 | 121,005(0.02%)#557 |
| 72. | Monsey | 18 | 57,691(0.03%)#72 | 121,005(0.01%)#575 |
| 73. | North Babylon | 18 | 57,691(0.03%)#73 | 121,005(0.01%)#581 |
| 74. | Gloversville | 18 | 57,691(0.03%)#74 | 121,005(0.01%)#583 |
| 75. | Nesconset | 18 | 57,691(0.03%)#75 | 121,005(0.01%)#584 |
| 76. | Roessleville | 18 | 57,691(0.03%)#76 | 121,005(0.01%)#585 |
| 77. | Pleasant Valley | 18 | 57,691(0.03%)#77 | 121,005(0.01%)#587 |
| 78. | Mineola | 17 | 57,691(0.03%)#78 | 121,005(0.01%)#594 |
| 79. | Haverstraw | 16 | 57,691(0.03%)#79 | 121,005(0.01%)#610 |
| 80. | Rockville Centre | 14 | 57,691(0.02%)#80 | 121,005(0.01%)#651 |
| 81. | Highland Falls | 14 | 57,691(0.02%)#81 | 121,005(0.01%)#660 |
| 82. | Hartsdale | 14 | 57,691(0.02%)#82 | 121,005(0.01%)#662 |
| 83. | Port Chester | 13 | 57,691(0.02%)#83 | 121,005(0.01%)#670 |
| 84. | Walden | 13 | 57,691(0.02%)#84 | 121,005(0.01%)#677 |
| 85. | East Farmingdale | 13 | 57,691(0.02%)#85 | 121,005(0.01%)#678 |
| 86. | Cheektowaga | 12 | 57,691(0.02%)#86 | 121,005(0.01%)#681 |
| 87. | Wantagh | 12 | 57,691(0.02%)#87 | 121,005(0.01%)#694 |
| 88. | Roslyn Heights | 12 | 57,691(0.02%)#88 | 121,005(0.01%)#701 |
| 89. | Garden City | 10 | 57,691(0.02%)#89 | 121,005(0.01%)#744 |
| 90. | Bard College | 10 | 57,691(0.02%)#90 | 121,005(0.01%)#752 |
| 91. | Fort Salonga | 9 | 57,691(0.02%)#91 | 121,005(0.01%)#769 |
| 92. | Cobleskill | 9 | 57,691(0.02%)#92 | 121,005(0.01%)#773 |
| 93. | Gardnertown | 9 | 57,691(0.02%)#93 | 121,005(0.01%)#774 |
| 94. | Potsdam | 8 | 57,691(0.01%)#94 | 121,005(0.01%)#794 |
| 95. | Tuckahoe | 8 | 57,691(0.01%)#95 | 121,005(0.01%)#796 |
| 96. | Horseheads | 8 | 57,691(0.01%)#96 | 121,005(0.01%)#799 |
| 97. | Pomona | 8 | 57,691(0.01%)#97 | 121,005(0.01%)#800 |
| 98. | Cumberland Head | 8 | 57,691(0.01%)#98 | 121,005(0.01%)#801 |
| 99. | Centereach | 7 | 57,691(0.01%)#99 | 121,005(0.01%)#811 |
| 100. | Elmira | 7 | 57,691(0.01%)#100 | 121,005(0.01%)#814 |
Common Questions
What are the Top 10 Cities with the Largest British West Indian Community in New York?
Top 10 Cities with the Largest British West Indian Community in New York are:
#1
49,370
#2
918
#3
569
#4
481
#5
339
#6
304
#7
243
#8
179
#9
176
#10
172
What city has the Largest British West Indian Community in New York?
New York has the Largest British West Indian Community in New York with 49,370.
What is the Total British West Indian Population in the State of New York?
Total British West Indian Population in New York is 57,691.
What is the Total British West Indian Population in the United States?
Total British West Indian Population in the United States is 121,005.